MAMMON v-1EN :
welcome everyone to MAMMON.
I coded this indicator to allow you to quickly and easily identify a price trend, refer to the last color of a horizontal bar, you will have your trend.
if your last horizontal bar is red then the period is bearish, if this bar is green then the trend is bullish.
MAMMON also includes indications on candles (buy / sell arrow - blue and red) which allows you to find good entry prices in trends, these indications are calculated on 2 criteria, pivot point and reversal.
It is recommended to use MAMMON only on 4h - 1D -1W charts and to couple the MAMMON indicator to the MAM-MOM indicator.
The strategy tester shows 32% profit on btc / usd on a daily chart.
To access this indicator please contact me by private message on trading view, you will soon find a dedicated website in the "signature" of my profile and in "about me".
If you have a question contact me by private message please.
FR :
bienvenue a tous sur MAMMON.
j'ai codé cet indicateur pour vous permettre d'identifier simplement et rapidement une tendance de prix, prenez référence à la dernière couleur d'une barre horizontale, vous aurez votre tendance.
si votre dernière barre horizontale est rouge alors la période est baissière, si cette barre est verte alors la tendance est haussière.
MAMMON inclut aussi des indications sur des bougies (flèche buy/sell - bleu et rouge) ce qui vous permet de trouver de bons prix d'entrée dans des tendances, ces indications sont calculées sur 2 critères, point pivot et renversement.
Il est recommandé d'utiliser MAMMON uniquement sur des graphiques 4 h - 1D -1W et de couplé l'indicateur MAMMON à l'indicateur MAM-MOM.
Le testeur de stratégie indique 32% de profit sur btc/usd en graphique daily.
Pour accéder à cet indicateur veuillez me contact par message privé sur trading view, vous trouverez bientôt un site web dédié dans la "signature" de mon profil et dans "à propos de moi".
Si vous avez une question me contacté par message privé svp.
Points pivots

Combo Backtest 123 Reversal & Floor Pivot Points This is combo strategies for get a cumulative signal.
First strategy
This System was created from the Book "How I Tripled My Money In The
Futures Market" by Ulf Jensen, Page 183. This is reverse type of strategies.
The strategy buys at market, if close price is higher than the previous close
during 2 days and the meaning of 9-days Stochastic Slow Oscillator is lower than 50.
The strategy sells at market, if close price is lower than the previous close price
during 2 days and the meaning of 9-days Stochastic Fast Oscillator is higher than 50.
Second strategy
The name ‘Floor-Trader Pivot,’ came from the fact that Pivot points can
be calculated quickly, on the fly using price data from the previous day
as an input. Although time-frames of less than a day can be used, Pivots are
commonly plotted on the Daily Chart; using price data from the previous day’s
trading activity.
WARNING:
- For purpose educate only
- This script to change bars colors.

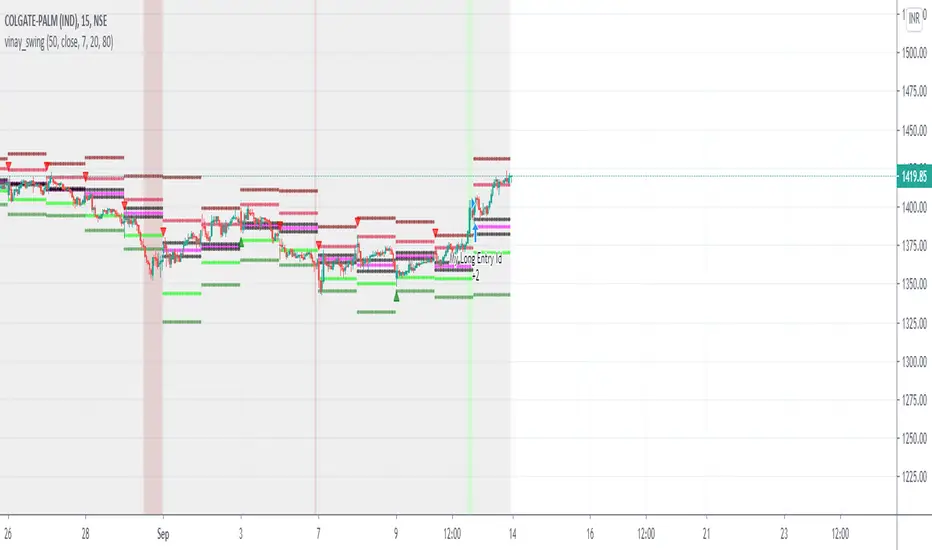
swing tradeTHIS strategy is based on the
franklin ochao swing trade book
confirmed bullish - when ever stock closed above R2 (more bullish)
when ever stock closed between R1 AND R2 (moderatly bullish or consolidation phase with respect to previous trend)
entry1 for more bullish trend is buy at every dips means when ever price low below pivot when it open above the pivot
entry2 for more bullish trend is buy at low is below s1
keep strictly stoploss at s1 of previous day (r2 close day)
trend reversal is possible once stock close below s1 in 1hr time frame
virgin cpr or missed pivot is added a advantage
For bearish mode this vice verse
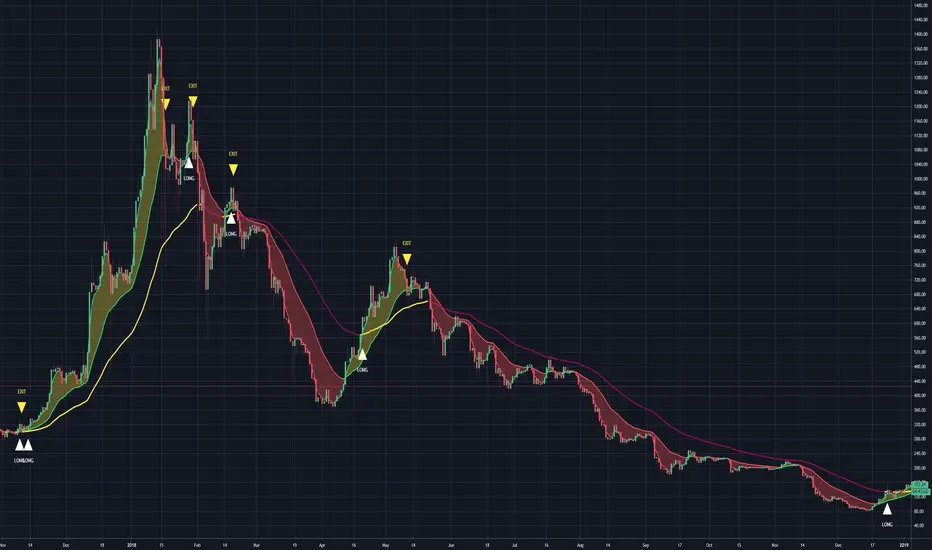
Arkaydeus Trend Strategy (by Arkaydeus) The Arkaydeus Trend Strategy uses a combination of a fast and slow EMA creating a trend ribbon but also introduces the following features:
A Big EMA to filter out buys which aren't following a higher level trend
A filter on only positive candles for entry
An entry only closing above a positive trending ribbon
A sideways noise threshold filter which is configurable to remove too many trades whilst ranging sideways
A toggled spike switch to exit trades on lows hitting threshold even if close doesn't
A % based trailing stop feature that is turned off by default
The indicator can be used as a trading strategy or you can switch trades off and just use the enter and exit points painted on the graph.
This strategy is designed for the larger Crypto assets ( BTC /ETH) and should be run on the daily time frame. It has been optimised for these and may not perform as well on other instruments.
It should not be used in heavily ranging markets which move sideways and is designed as a trend based long only strategy.

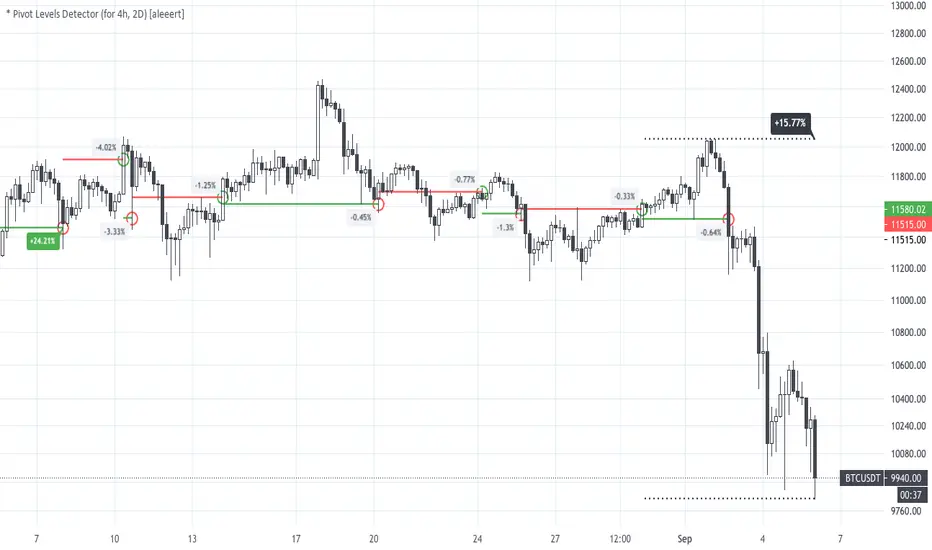
* Pivot Levels Detector (for H4, D2) [aleeert]Pivot Levels Detector is the script based on idea about breakouts of pivot levels which based on certain numbers of bars used for reaching the target and breakout the level. Working timeframes are H4 and 2D . The script works better with BTCUSD, ETHUSD, EOSBTC, AAPL, TSLA.
No repainting!
The script doesn't use any moving averages or other relative methods which cancel or change data on previous bars. Once the signal is showed it will stay forever.
NOTE: The results from Strategy Tester could slight vary from results you see on the chart. It's because of calculation method used on Strategy Tester, which uses a data from closed bars only, not by target reaching. So the results you see on the chart are more correct.
Follow me for receiving more scripts and indicators.
Regards,
aleeert
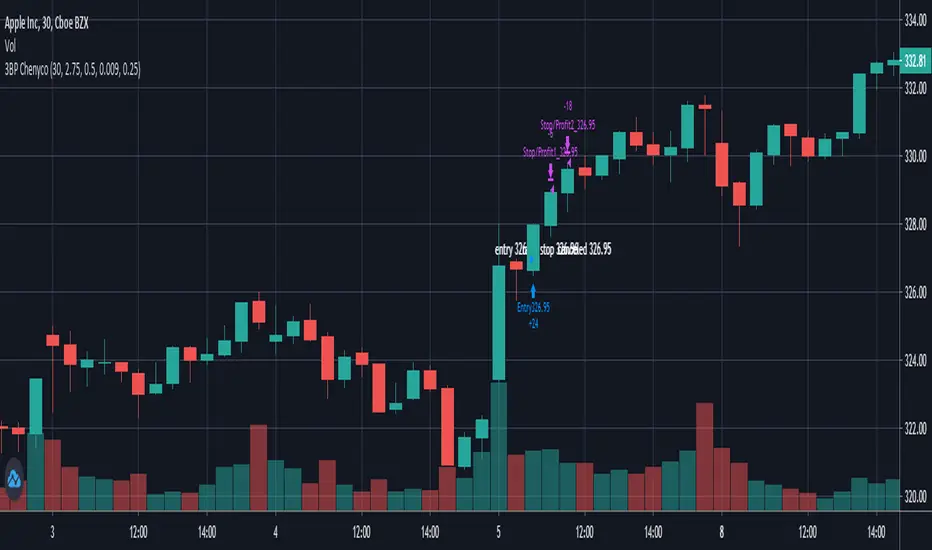
3 bar play partial1 1:1, take all 2:1 By ChenycoThis script is trying to find 3 Bar Play pattern and take profit of 2:1 with option to partial at 1:1.
The pattern has a weighted first bar and then a smaller bar with relative equally high. The first entry should be by the next bar only.
Parameters:
* Default strategy parameters, including initial capital and commissions.
* Risk Unit $ - The risk unit per trade in currency.
* Weighted Bar ATR Ratio - the ratio between the weighted bar true range to the ATR.
* Small Bar Ratio - The ratio between the smaller bar true range to weighted bar.
* Equal Price Ratio - The ratio of acceptable price change in compare to the stock price.
* Partial Qty Ratio - The ratio of the first partial equity.
Good luck!
Chen.
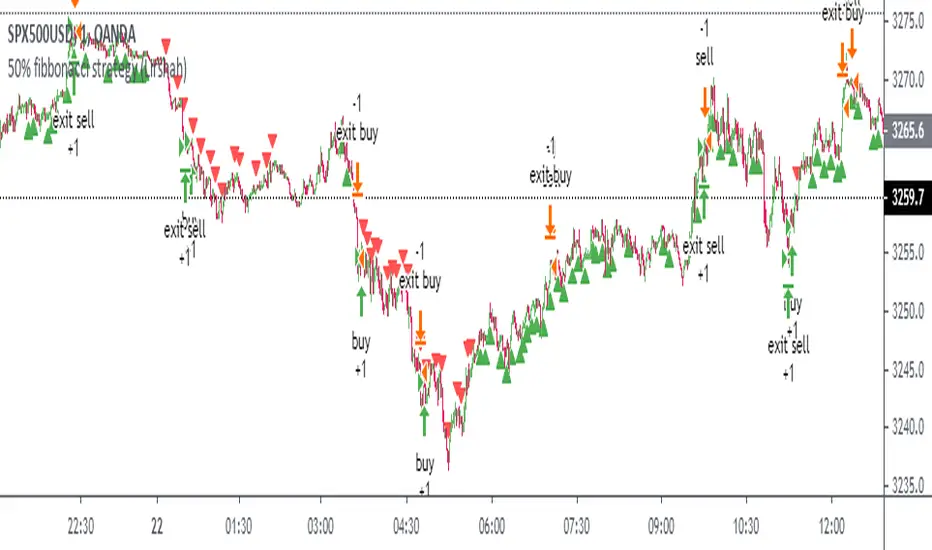
50% fibbonacci strategy (Lirshah)50% Fibonacci is driven from long term average price action in combined with pivot point.
the strategy trigger buy signal when its on uptrend long term and buy on pivots.
the similar scenario for sell signals.
the strategy has good results on indices and some forex pairs.
the parameter are as below:
1)last bar calculation
2)pivot point
3)take profit
4)stop-loss
the below is results of 1 contract wall street index on 5sec time frame without calculation of commission.
in order to access scripts contact me directly.
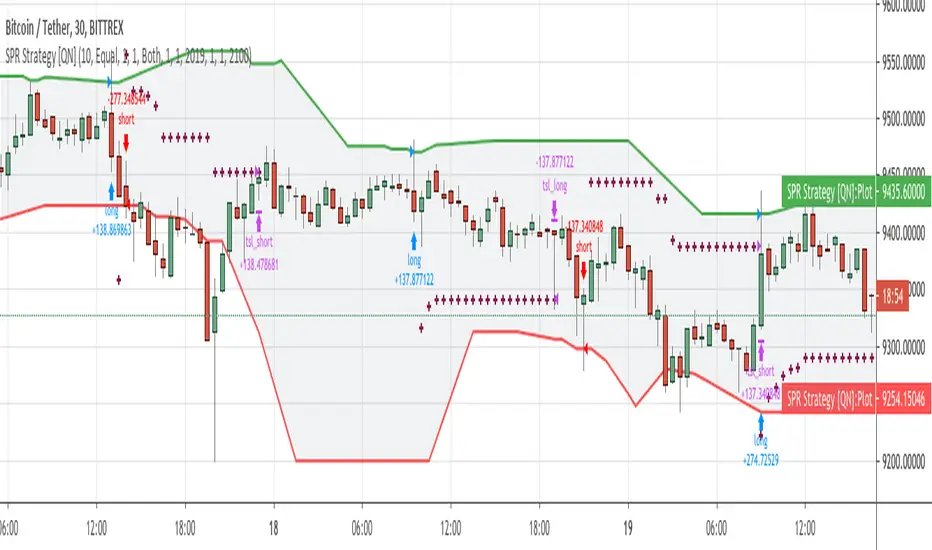
Smoothed Pivot Reversal Strategy [QuantNomad]With this strategy trying to rethink the standard pivot reversal strategy.
Don't like the idea that for 10/10 pivot you have to wait for 10points to confirm it. So I used multiple pivot levels and calculated the average line. This way when we have a new high level approaching it smoothly.
This way you can have a bit better price for entries but the risk of fake entries bit bigger as well.
I'm using the usual trailing stop loss as an exit for this strategy.
Parameters for this strategy is pretty simple:
Left/Right bars for pivot points.
Additional smoothing - you can additionally smooth pivot lines with EMA
% for Traling SL
Pivot Point V2 Backtest Pivot points simply took the high, low, and closing price from the previous period and
divided by 3 to find the pivot. From this pivot, traders would then base their
calculations for three support, and three resistance levels. The calculation for the most
basic flavor of pivot points, known as ‘floor-trader pivots’, along with their support and
resistance levels.
WARNING:
- For purpose educate only
- This script to change bars colors.

Fibonacci + RSI - StrategyStrategy: Fibonacci + RSI:
- Intraday trading strategy (Scalping).
Time Frames Tested with best Results:
30 Minutes.
5 Minutes.
15 Minutes.
1 Minute
Indicators Used:
RSI (30 / 70)
Fibonacci (1 - 0.784)
How it Works:
Once the Price Hits the 1 or -1 Fibonacci Level and bounces a little bit, It checks the RSI if Over Bought or Over Sold According to 30 - 70.
If both conditions are satisfied, it triggers a Long or Short Positions.
Further Notes:
- I have put a Stop-loss with a 2% just for further upgrades.
- Not advised to use in High Volatility Markets.
- No Repaint was observed during a 2-Weeks Tests.
If you have any suggestions or modifications please contact to add.
If you have observed any bad behavior please contact to fix.
Trade wisely.

Camarilla Pivot Points V2 Backtest Camarilla pivot point formula is the refined form of existing classic pivot point formula.
The Camarilla method was developed by Nick Stott who was a very successful bond trader.
What makes it better is the use of Fibonacci numbers in calculation of levels.
Camarilla equations are used to calculate intraday support and resistance levels using
the previous days volatility spread. Camarilla equations take previous day’s high, low and
close as input and generates 8 levels of intraday support and resistance based on pivot points.
There are 4 levels above pivot point and 4 levels below pivot points. The most important levels
are L3 L4 and H3 H4. H3 and L3 are the levels to go against the trend with stop loss around H4 or L4 .
While L4 and H4 are considered as breakout levels when these levels are breached its time to
trade with the trend.
WARNING:
- For purpose educate only
- This script to change bars colors.

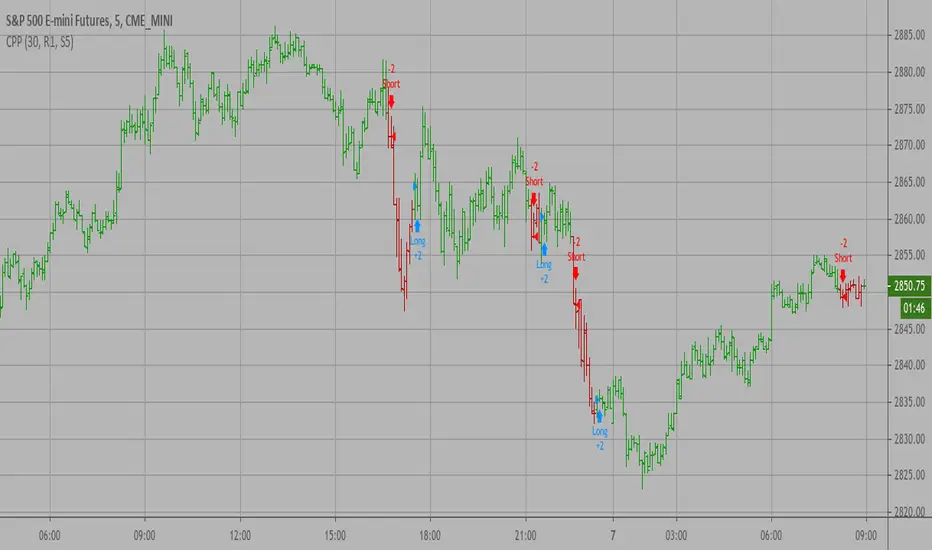
PRP - Pivot Reversal + PSAR Strategy [QuantNomad]PRP is a combination of Pivot Reversal and PSAR Strategy. With this strategy, I tried to be in a position for big moves in the market.
The strategy uses Pivot Reversal entries with an additional condition that TR of entry bar should be at least X ATRs. This allows to filter out some false signals.
For exits, I recoded the PSAR indicator as trailing stop loss. So I start PSAR Y ATRs below the Pivot level price crossed at entry. After that PSAR behaves as usual.
For stability and easier execution, I check conditions only on the close, no stop/limit orders are used.

Camarilla Pivot Points Backtest Pivot point studies highlight prices considered to be a likely turning point
when looking at values from a previous period, whether it be daily, weekly,
quarterly or annual. Each pivot point study has its own characteristics on
how these points are calculated.
Red color = Sell
Green color = Buy
WARNING:
- For purpose educate only
- This script to change bars colors.
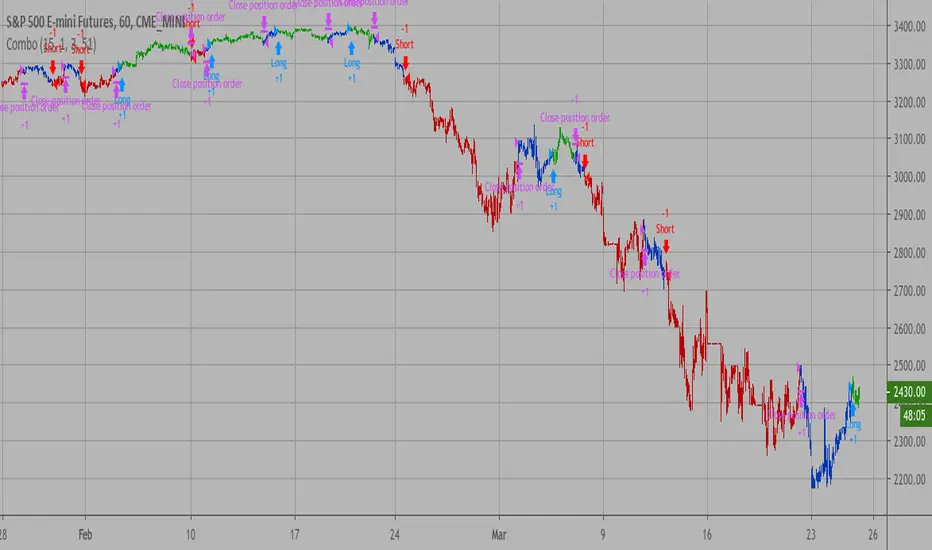
Combo Backtest 123 Reversal & Dynamic Pivot Point This is combo strategies for get a cumulative signal.
First strategy
This System was created from the Book "How I Tripled My Money In The
Futures Market" by Ulf Jensen, Page 183. This is reverse type of strategies.
The strategy buys at market, if close price is higher than the previous close
during 2 days and the meaning of 9-days Stochastic Slow Oscillator is lower than 50.
The strategy sells at market, if close price is lower than the previous close price
during 2 days and the meaning of 9-days Stochastic Fast Oscillator is higher than 50.
Second strategy
This Pivot points is calculated on the current day.
Pivot points simply took the high, low, and closing price from the previous period and
divided by 3 to find the pivot. From this pivot, traders would then base their
calculations for three support, and three resistance levels. The calculation for the most
basic flavor of pivot points, known as ‘floor-trader pivots’, along with their support and
resistance levels.
WARNING:
- For purpose educate only
- This script to change bars colors.
PASS: Price Action Support StrategyPASS is dedicated to all Intraday Traders.
This is based on Secret of Pivot Boss book by Frank Ochoa. Suitable for Intraday Trading.
It is combination of two Price action theory and one indicator mainly known as Floor Pivots, Camarilla Pivots and MACD.
MACD gives the better entry & exit levels for Day Trading whereas the other two Price action theory give the "levels/zones" where actions can be expected during live market hours.
You can view Daily time frame cpr/support/resistance.
You can also view Previous Day,Week,Month High/Low.
You can also turn on/off as per your wish and adjust the colors as per your preferences.
Happy Trading !!

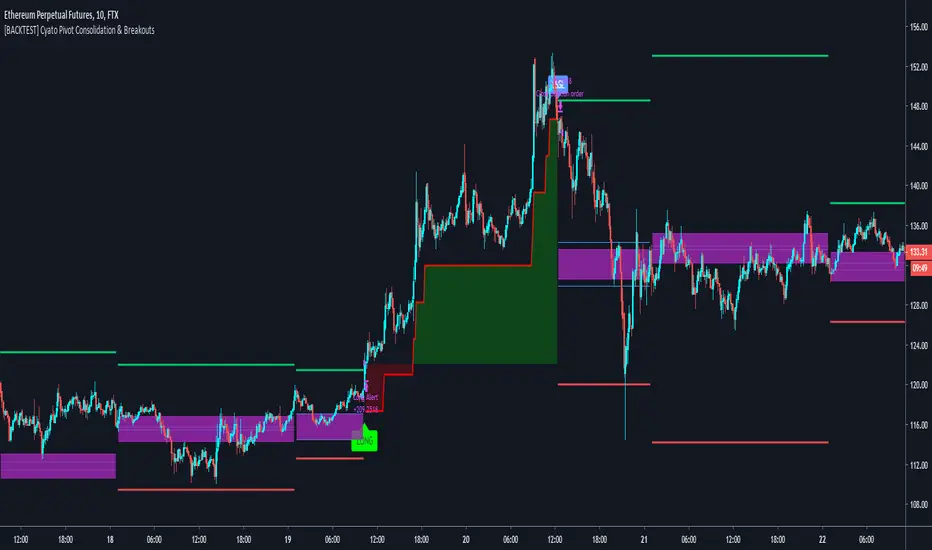
Cyatophilum Pivot Consolidation & Breakouts [BACKTEST]Intraday Strategy built on Pivot Points Standard and Pivot Range.
The idea is to wait for a consolidation period AND a breakout. This really strong condition allows to set a 1/1 Risk/Reward ratio.
Starting from there we secure the profits with a Trailing Stop loss and/or Take Profit system integrated in the script.
This is the Backtest version and you can see the results below. Default settings work great on the 15m chart.
You can change the timeframe of the pivot points as well as the consolidation band in the settings. The SL/TP system is also configurable. This script includes a DCA feature.
To get the indicator, please use the link below, thanks!
ASH1StrategyPositional Hourly trading system, to be used in conjunction with the default Choppiness indicator. Filter: Choppiness <= 44 for entry

Pivot RSI - A trading strategy using Pivots Rel StrengthThis strategy uses a new concept called Relative Strength of Pivots.
The concept emanates from the fact that the market weakness starts from bottom to top when it comes to pivot as against top to bottom in conventional indicators.
It signals long if the daily pivot shows better strength than monthly pivots and short if the daily pivot shows weaker strength than monthly pivots.
The Strength of pivots is defined better if :
a) if relative strength of lower pivots are higher than higher pivots or crosses higher pivots.
b) if relative strength of lower pivots are sloping upwards and is above mid point (50).
This strength of pivots is combined with pivot shift indicator for additional confirmation which means that if pivot shift indicator is sloping upwards and the strength of pivots satisfies the above definition, then the long is signalled.
How to use this in trading?
The best way is to have this indicator along with the following
a) 50 period ema
b) 200 period ema
c) Daily CPR / Weekly pivot / monthly pivot (MUPS indicator preferred - Please refer to the same in public library)
d) Pivot Shift Indicator (IndianPivotBossPivotShiftIndicator - Please refer to the same in public library)
When a long is signalled, ensure that there are no immediate nearby resistances in the form of EMAs or Pivots. Similarly when a short is signalled, ensure that there are no immediate nearby supports in the form of EMAs or Pivots.
In other words when a long is signalled and if there is a nearby resistance, just wait for the resistance to break convincingly before going long and vice versa for shorts.
In general a blue color indicates that the strength of daily pivot is better alongwith a bullish pivotshift which facilitates a possible long and HENCE STRICTLY SHOULD NOT BE ON THE SHORT SIDE.
In general a red color indicates that the strength of daily pivot is better alongwith a bearish pivotshift which facilitates a possible short and HENCE STRICTLY SHOULD NOT BE ON THE LONG SIDE.
Please ensure that you use this with a proper Risk Management and Money Management guidelines.

Only CPR StrategyHello Everyone This Strategy Base on CPR
By Default 1 Percentage TP AND 0.5 Percentage Sl & quantity 500
By Default Backtesting Starting Time 1 Jan 2020 and end time 31 Dec 2020
You Can also change everything.
In future, I will Enhance this Strategy
if you have any suggestion Mention here
Thank you so much

IndianPivotBossPivotShiftThis Indicator has to be used as a censorship as under:
Do not go long (STRICTLY) when the following is observed:
(ie, either go short if any other indicator supports or do nothing)
a) If the histogram is lower than the previous histogram; in other words sloping downwards.
Do not go short (STRICTLY) when the following is observed:
(ie, either go long if any other indicator supports or do nothing)
a) If the histogram is higher than the previous histogram; in other words sloping upwards.
This can be used for intraday / swing / positional.
The histogram are constructed from combination of floor pivots. The histogram are different from Pivot based oscillators.
For intraday, select Daily from the parameters and use chart timeframe less than 15 min preferably.
For swing, select Weekly from the parameters and use chart timeframe more than 15 min preferably but less than daily charts.
For positional, select Monthly from the parameters and use daily time frame charts.
It is an effective indicator that potentially prevents you from taking wrong trades.
The computation mechanism of the indicator is confidential as it is proprietary.

TFs Pivot Reversal StrategyThe Pivot Reversal strategy script uses pivot points to create a support and resistance level; based on this levels the strategy creates virtual stop-market orders to catch the trend if the price is crossing the pivot lines.
A configurable trailing-stop and stop-loss is being used to exit an open position.
How to use
The strategy works with all timeframes; the current chart setting is using a 15min timeframe. The strategy enters about 10 trades per day, depending on the used settings.
I'm also providing a "study" version of this strategy, which can be used to automate the strategy by using webhooks for instance.
The script is using a default commission of 0.075% which reflects Bitmex' Taker-Fees. This is just a default and can be modified in the strategy settings for each instrument individually.
How to access
This strategy is a "Invite Only" script. You can can subscribe or purchase the strategy ; please use the link below or send me a message via Tradingview to obtain access to the strategy and study script.
For enabling the script in your Tradingview chart window, click on "Indicators" and select "Invite-Only Scripts".
Full list of parameters:
"Pivot Left Bars" ... Number of bars on the left of the pivot point - used for pivot/peak detection
"Pivot Right Bars" ... Number of bars on the right of the pivot point - used for pivot/peak detection
"Entry Offset " ... Entry price offset after crossing pivot line (in %)
"Trailing Activation Level " ... Trailing stop activation level above/below average price (in %)
"Trailing Offset " ... Trailing stop price (in %)
"Stop Loss " ... Absolute stop-loss (in %)
"Capital Risk Factor " ... Capital risk factor (in %)
"Margin / Leverage " ... Optional leverage factor which can be used to leverage position (in %)
"Backtest ..." ... Backtest timeframe; area outside this timeframe will be grayed out
I'm looking forward to any feedback, reviews or change requests!

