Day25RangeDay25Range(1) - Plot on the candle the 25% low range of the daily price. This helps to show when the current price is at or below the 25% price range of the day. Best when used with other indicators to show early wakening strength in price. On the attached chart, if you look at Jan 23, 2018 you will see a red candle that closed below the 25% mark of the trading day. For that day the 25% mark was at 38.66 and the close of the day was at 38.25 That indicators a potential start of a strong swing trade down. A second signal was given on Jan 25, 2018 when a red candle closed (37.25) below the 25% mark (38.08) again. Within the next few days a third weak indicator signaled on Jan 30,2018 with a close (35.88) below the Day25Range (37.46). price continued down from there for the next 4 days before starting to reverse. If the price closes below the 25% daily range as shown on the Day25Range(1) indicator, this could indicate a possible start of weakening in the price movement.
Plot
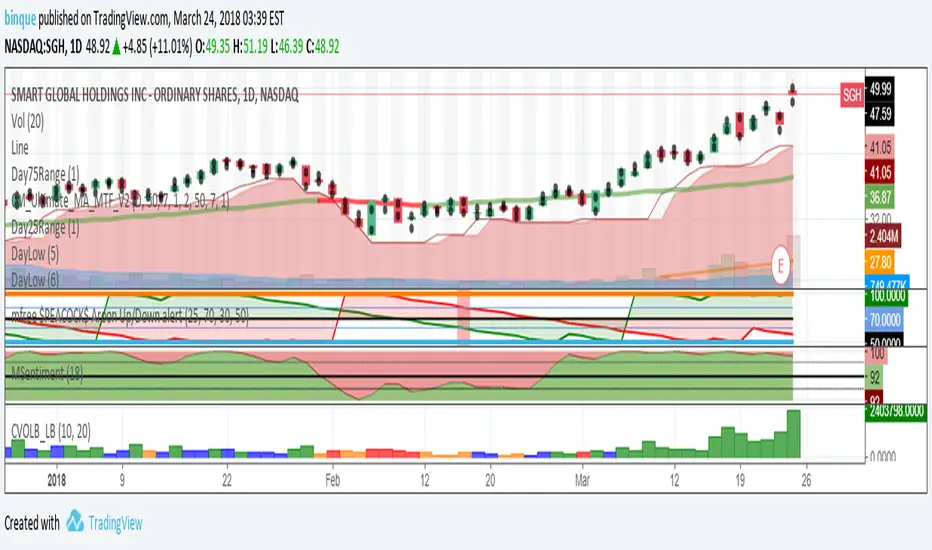
Day25RangeDay25Range(1) - I use this indicator to show where the lower 25% daily range of a stock is. This helps to show weakness in a stock during the trading day. I use this indicator with a CIRCLE or DOT plotted on the candle. Makes it easy to show weakness during the trading day.
draw line at bar on condition, up to 40 bars in lengthDraws line at bar on condition, up to 40 bars in length.
Well, that's not a line, but a set of `—` characters. But it looks like a line, so it is line.
[M]HLC PlotsHLC Plots
Draws points (lines) to high low and close. In some trading situations, this method is more convenient than candles or bars.
--------------------------------------
Рисует точки(линии) по high low и close. В некоторых ситуациях торговли такой способ бывает удобней, чем свечи или бары. На вкус и цвет все фломастеры разные =)