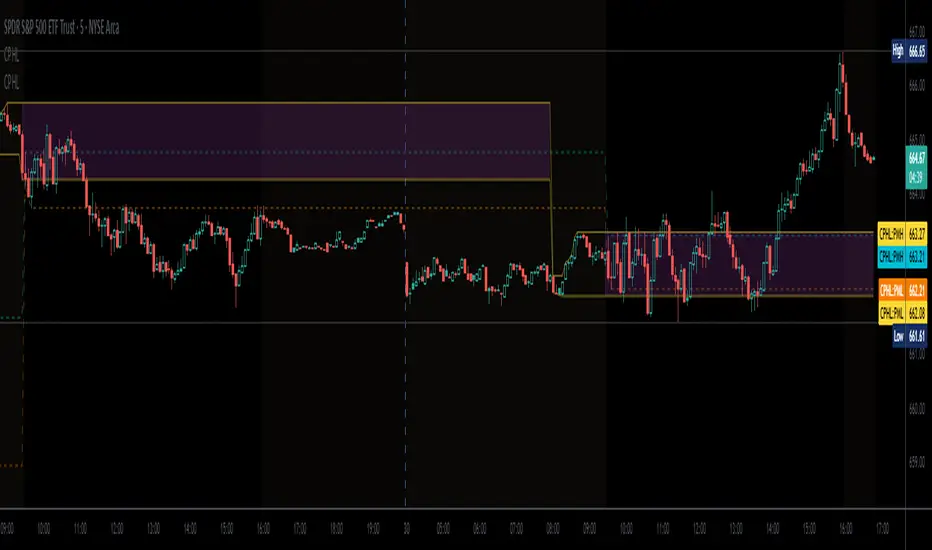
Malama's Pre-Market BoxThis script is a comprehensive Pre-Market range visualizer designed to replace older, single-candle analysis tools. It automatically highlights the full pre-market session (04:00–09:30 EST) and extends key support/resistance levels into the regular trading day.
Why this script was created (Evolution from previous versions): This is a complete architectural rewrite of the older "Malama's KAYCAP Pre-Market Box."
Old Logic: The previous version focused on isolating a single, specific 1-minute candle (e.g., exactly 4:00 AM) to determine levels.
New Logic: This version tracks the entire pre-market session range. It dynamically updates the True High and True Low as the pre-market develops, providing a much more accurate support/resistance zone for the open.
Visual Overhaul: Instead of static plots, this version uses Pine Script v6 box and line objects to draw a clean, shading-customizable range that automatically extends rightward until the trading session ends.
How it works:
Session Tracking: The script monitors the user-defined session (default 04:00-09:30).
Dynamic Box: As price moves during pre-market, a box is drawn covering the highest high and lowest low of that period.
Level Extension: At 09:30 (Market Open), the script locks the High and Low values. It then projects two horizontal lines (Resistance and Support) across the chart for the rest of the day.
Breakout Detection: If the price closes outside these levels during regular hours, the script can optionally trigger Alerts and plot "BREAK" labels on the chart.
Settings:
Time Settings: Customizable session string (default captures standard US Pre-Market).
Visuals: Fully adjustable box colors, border transparency, and line width.
Signals: Toggle breakout labels on/off.
Alerts Included:
Bullish Breakout: Triggers when price crosses and closes above the Pre-Market High.
Bearish Breakdown: Triggers when price crosses and closes below the Pre-Market Low.
Premarketlevels

Custom Period High LowSummary
I'm moving over from TradeStation and default Pre-Market Session there is 0800-0930. Default PMS on TradingView is 0400-0930. I find that the 0800-0930 High and Low are more accurate levels. This script addresses exactly that - it allows you to grab High and Low of any custom time slot.
This script started as Custom Pre-Market H/L, that's why the shading. Then I realized it can be used for any custom time period, so I renamed it to PERIOD H/L.
Limitations
Different tickers are provided by different exchanges, in different time zones. The end result is that the SAME session time (0800-0930) may shift for different tickers. Examples:
- SPY : 0800-0930 // no shift: NYSE, in NYC
- ES1!: 0900-1030 // shifted 1 hr ahead: CME, in Chicago
- NQ1!: 0900-1030 // shifted 1 hr ahead: CME, in Chicago
To see for yourself, set Time Zone config parameter to empty string for non-NYC tickers like ES1! or NQ1 and watch times for shaded and non-shaded areas.
Why TV chooses to go by the ticker's TZ, and not the TZ that's configured in the lower right corner of my TV screen - I have no idea. But asking for user's TZ is how you fix it.
If you know how I can get that value so I don't have to ask the user - let me know. I'm new to TV.
Hacks
You can use it more than once for, say, Opening Range Breakout. Configure your custom PMS for 0930-0945, change lines, remove area fill - and ta-da - you have High and Low for first 15 min! See release chart for the example.
Tristan's Box: Pre-Market Range Breakout + RetestMarket Context:
This is designed for U.S. stocks, focusing on pre-market price action (4:00–9:30 AM ET) to identify key support/resistance levels before the regular session opens.
Built for 1 min and 5 min timelines, and is intended for day trading / scalping.
Core Idea:
Pre-market range (high/low) often acts as a magnet for price during regular hours.
The first breakout outside this range signals potential strong momentum in that direction.
Retest of the breakout level confirms whether the breakout is valid, avoiding false moves.
Step-by-Step Logic:
Pre-Market Range Identification:
Track high and low from 4:00–9:30 AM ET.
Draw a box spanning this range for visual reference and calculation.
Breakout Detection:
When the first candle closes above the pre-market high → long breakout.
When the first candle closes below the pre-market low → short breakout.
The first breakout candle is highlighted with a “YOLO” label for visual confirmation.
Retest Confirmation:
Identify the first candle whose wick touches the pre-market box (high touches top for short, low touches bottom for long).
Wait for the next candle: if it closes outside the box, it confirms the breakout.
Entry Execution:
Long entry: on the confirming candle after a wick-touch above the pre-market high.
Short entry: on the confirming candle after a wick-touch below the pre-market low.
Only the first valid entry per direction per day is taken.
Visuals & Alerts:
Box represents pre-market high/low.
Top/bottom box border lines show the pre-market high / low levels cleanly.
BUY/SELL markers are pinned to the confirming candle.
Added a "YOLO" marker on breakout candle.
Alert conditions trigger when a breakout is confirmed by the retest.
Strategy Type:
Momentum breakout strategy with confirmation retest.
Combines pre-market structure and risk-managed entries.
Designed to filter false breakouts by requiring confirmation on the candle after the wick-touch.
In short, it’s a pre-market breakout momentum strategy: it uses the pre-market high/low as reference, waits for a breakout, and then enters only after a confirmation retest, reducing the chance of entering on a false spike.
Always use good risk management.

Yelober - Market Internal direction+ Key levelsYelober – Market Internals + Key Levels is a focused intraday trading tool that helps you spot high-probability price direction by anchoring decisions to structure that matters: yesterday’s RTH High/Low, today’s pre-market High/Low, and a fast Value Area/POC from the prior session. Paired with a compact market internals dashboard (NYSE/NASDAQ UVOL vs. DVOL ratios, VOLD slopes, TICK/TICKQ momentum, and optional VIX trend), it gives you a real-time read on breadth so you can choose which direction to trade, when to enter (breaks, retests, or fades at PMH/PML/VAH/VAL/POC), and how to plan exits as internals confirm or deteriorate. On top of these intraday decision benefits, it also allows traders—in a very subtle but powerful way—to keep an eye on the VIX and immediately recognize significant spikes or sharp decreases that should be factored in before entering a trade, or used as a quick signal to modify an existing position. In short: clear levels for the chart, live internals for the context, and a smarter, rules-based path to execution.
# Yelober – Market Internals + Key Levels
*A TradingView indicator for session key levels + real‑time market internals (NYSE/NASDAQ TICK, UVOL/DVOL/VOLD, and VIX).*
**Script name in Pine:** `Yelober - Market Internal direction+ Key levels` (Pine v6)
---
## 1) What this indicator does
**Purpose:** Help intraday traders quickly find high‑probability reaction zones and read market internals momentum without switching charts. It overlays yesterday/today’s **automatic price levels** on your active chart and shows a **market breadth table** that summarizes NYSE/NASDAQ buying pressure and TICK direction, with an optional VIX trend read.
### Key features at a glance
* **Automatic Price Levels (overlay on chart)**
* Yesterday’s High/Low of Day (**yHoD**, **yLoD**)
* Extended Hours High/Low (**yEHH**, **yEHL**) across yesterday AH + today pre‑market
* Today’s Pre‑Market High/Low (**PMH**, **PML**)
* Yesterday’s **Value Area High/Low** (**VAH/VAL**) and **Point of Control (POC)** computed from a volume profile of yesterday’s **regular session**
* Smart de‑duplication:
* Shows **only the higher** of (yEHH vs PMH) and **only the lower** of (yEHL vs PML) to avoid redundant bands
* **Market Breadth Table (on‑chart table)**
* **NYSE ratio** = UVOL/DVOL (signed) with **VOLD slope** from session open
* **NASDAQ ratio** = UVOLQ/DVOLQ (signed) with **VOLDQ slope** from session open
* **TICK** and **TICKQ**: live cumulative ratio and short‑term slope
* **VIX** (optional): current value + slope over a configurable lookback/timeframe
* Color‑coded trends with sensible thresholds and optional normalization
---
## 2) How to use it (trader workflow)
1. **Mark your reaction zones**
* Watch **yHoD/yLoD**, **PMH/PML**, and **VAH/VAL/POC** for first touches, break/retest, and failure tests.
* Expect increased responsiveness when multiple levels cluster (e.g., PMH ≈ VAH ≈ daily pivot).
2. **Read the breadth panel for context**
* **NYSE/NASDAQ ratio** (>1 = more up‑volume than down‑volume; <−1 = down‑dominant). Strong green across both favors long setups; red favors short setups.
* **VOLD slopes** (NYSE & NASDAQ): positive and accelerating → broadening participation; negative → persistent pressure.
* **TICK/TICKQ**: cumulative ratio and **slope arrows** (↗ / ↘ / →). Use the slope to gauge **near‑term thrust or fade**.
* **VIX slope**: rising VIX (red) often coincides with risk‑off; falling VIX (green) with risk‑on.
3. **Confluence = higher confidence**
* Example: Price reclaims **PMH** while **NYSE/NASDAQ ratios** print green and **TICK slopes** point ↗ — consider break‑and‑go; if VIX slope is ↘, that adds risk‑on confidence.
* Example: Price rejects **VAH** while **VOLD slopes** roll negative and VIX ↗ — consider fade/reversal.
4. **Risk management**
* Place stops just beyond key levels tested; if breadth flips, tighten or exit.
> **Timeframes:** Works best on 1–15m charts for intraday. Value Area is computed from **yesterday’s RTH**; choose a smaller calculation timeframe (e.g., 5–15m) for stable profiles.
---
## 3) Inputs & settings (what each option controls)
### Global Style
* **Enable all automatic price levels**: master toggle for yHoD/yLoD, yEHH/yEHL, PMH/PML, VAH/VAL/POC.
* **Line style/width**: applies to all drawn levels.
* **Label size/style** and **label color linking**: use the same color as the line or override with a global label color.
* **Maximum bars lookback**: how far the script scans to build yesterday metrics (performance‑sensitive).
### Value Area / Volume Profile
* **Enable Value Area calculations** *(on by default)*: computes yesterday’s **POC**, **VAH**, **VAL** from a simplified intraday volume profile built from yesterday’s **regular session bars**.
* **Max Volume Profile Points** *(default 50)*: lower values = faster; higher = more precise.
* **Value Area Calculation Timeframe** *(default 15)*: the security timeframe used when collecting yesterday’s highs/lows/volumes.
### Individual Level Toggles & Colors
* **yHoD / yLoD** (yesterday high/low)
* **yEHH / yEHL** (yesterday AH + today pre‑market extremes)
* **PMH / PML** (today pre‑market extremes)
* **VAH / VAL / POC** (yesterday RTH value area + point of control)
### Market Breadth Panel
* **Show NYSE / NASDAQ / VIX**: choose which series to display in the table.
* **Table Position / Size / Background Color**: UI placement and legibility.
* **Slope Averaging Periods** *(default 5)*: number of recent TICK/TICKQ ratio points used in slope calculation.
* **Candles for Rate** *(default 10)* & **Normalize Rate**: VIX slope calculation as % change between `now` and `n` candles ago; normalize divides by `n`.
* **VIX Timeframe**: optionally compute VIX on a higher TF (e.g., 15, 30, 60) for a smoother regime read.
* **Volume Normalization** (NYSE & NASDAQ): display VOLD slopes scaled to `tens/thousands/millions/10th millions` for readable magnitudes; color thresholds adapt to your choice.
---
## 4) Data sources & definitions
* **UVOL/VOLD (NYSE)** and **UVOLQ/DVOLQ/VOLDQ (NASDAQ)** via `request.security()`
* **Ratio** = `UVOL/DVOL` (signed; negative when down‑volume dominates)
* **VOLD slope** ≈ `(VOLD_now − VOLD_open) / bars_since_open`, then normalized per your setting
* **TICK/TICKQ**: cumulative sum of prints this session with **positives vs negatives ratio**, plus a simple linear regression **slope** of the last `N` ratio values
* **VIX**: value and slope across a user‑selected timeframe and lookback
* **Sessions (EST/EDT)**
* **Regular:** 09:30–16:00
* **Pre‑Market:** 04:00–09:30
* **After Hours:** 16:00–20:00
* **Extended‑hours extremes** combine **yesterday AH** + **today PM**
> **Note:** All session checks are done with TradingView’s `time(…,"America/New_York")` context. If your broker’s RTH differs (e.g., futures), adjust expectations accordingly.
---
## 5) How the algorithms work (plain English)
### A) Key Levels
* **Yesterday’s RTH High/Low**: scans yesterday’s bars within 09:30–16:00 and records the extremes + bar indices.
* **Extended Hours**: scans yesterday AH and today PM to get **yEHH/yEHL**. Script shows **either yEHH or PMH** (whichever is **higher**) and **either yEHL or PML** (whichever is **lower**) to avoid duplicate bands stacked together.
* **Value Area & POC (RTH only)**
* Build a coarse volume profile with `Max Volume Profile Points` buckets across the price range formed by yesterday’s RTH bars.
* Distribute each bar’s volume uniformly across the buckets it spans (fast approximation to keep Pine within execution limits).
* **POC** = bucket with max volume. **VA** expands from POC outward until **70%** of cumulative volume is enclosed → yields **VAH/VAL**.
### B) Market Breadth Table
* **NYSE/NASDAQ Ratio**: signed UVOL/DVOL with basic coloring.
* **VOLD Slopes**: from session open to current, normalized to human‑readable units; colors flip green/red based on thresholds that map to your normalization setting (e.g., ±2M for NYSE, ±3.5×10M for NASDAQ).
* **TICK/TICKQ Slope**: linear regression over the last `N` ratio points → **↗ / → / ↘** with the rounded slope value.
* **VIX Slope**: % change between now and `n` candles ago (optionally divided by `n`). Red when rising beyond threshold; green when falling.
---
## 6) Recommended presets
* **Stocks (liquid, intraday)**
* Value Area **ON**, `Max Volume Points` = **40–60**, **Timeframe** = **5–15**
* Breadth: show **NYSE & NASDAQ & VIX**, `Slope periods` = **5–8**, `Candles for rate` = **10–20**, **Normalize VIX** = **ON**
* **Index futures / very high‑volume symbols**
* If you see Pine timeouts, set `Max Volume Points` = **20–40** or temporarily **disable Value Area**.
* Keep breadth panel **ON** (it’s light). Consider **VIX timeframe = 15/30** for regime clarity.
---
## 7) Tips, edge cases & performance
* **Performance:** The volume profile is capped (`maxBarsToProcess ≤ 500` and bucketed) to keep it responsive. If you experience slowdowns, reduce `Max Volume Points`, `Maximum bars lookback`, or disable Value Area.
* **Redundant lines:** The script **intentionally suppresses** PMH/PML when yEHH/yEHL are more extreme, and vice‑versa.
* **Label visibility:** Use `Label style = none` if you only want clean lines and read values from the right‑end labels.
* **Futures/RTH differences:** Value Area is from **yesterday’s RTH** only; for 24h instruments the RTH period may not reflect overnight structure.
* **Session transitions:** PMH/PML tracking stops as soon as RTH starts; values persist as static levels for the session.
---
## 8) Known limitations
* Uses public TradingView symbols: `UVOL`, `VOLD`, `UVOLQ`, `DVOLQ`, `VOLDQ`, `TICK`, `TICKQ`, `VIX`. If your data plan or region limits any symbol, the corresponding table rows may show `na`.
* The VA/POC approximation assumes uniform distribution of each bar’s volume across its high–low. That’s fast but not a tick‑level profile.
* Works best on US equities with standard NY session; alternative sessions may need code changes.
---
## 9) Troubleshooting
* **“Script is too slow / timed out”** → Lower `Max Volume Points`, lower `Maximum bars lookback`, or toggle **OFF** `Enable Value Area calculations` for that instrument.
* **Missing breadth values** → Ensure the symbols above load on your account; try reloading chart or switching timeframes once.
* **Overlapping labels** → Set `Label style = none` or reduce label size.
---
## 10) Version / license / contribution
* **Version:** Initial public release (Pine v6).
* **Author:** © yelober
* **License:** Free for community use and enhancement. Please keep author credit.
* **Contributing:** Open PRs/ideas: presets, alert conditions, multi‑day VA composites, optional mid‑value (`(VAH+VAL)/2`), session filter for futures, and alertable state machine for breadth regime transitions.
---
## 11) Quick start (TL;DR)
1. Add the indicator and **keep default settings**.
2. Trade **reactions** at yHoD/yLoD/PMH/PML/VAH/VAL/POC.
3. Use the **breadth table**: look for **green ratios + ↗ slopes** (risk‑on) or **red ratios + ↘ slopes** (risk‑off). Check **VIX** slope for confirmation.
4. Manage risk around levels; when breadth flips against you, tighten or exit.
---
### Changelog (public)
* **v1.0:** First community release with automatic RTH levels, VA/POC approximation, breadth dashboard (NYSE/NASDAQ/TICK/TICKQ/VIX) with normalization and adaptive color thresholds.

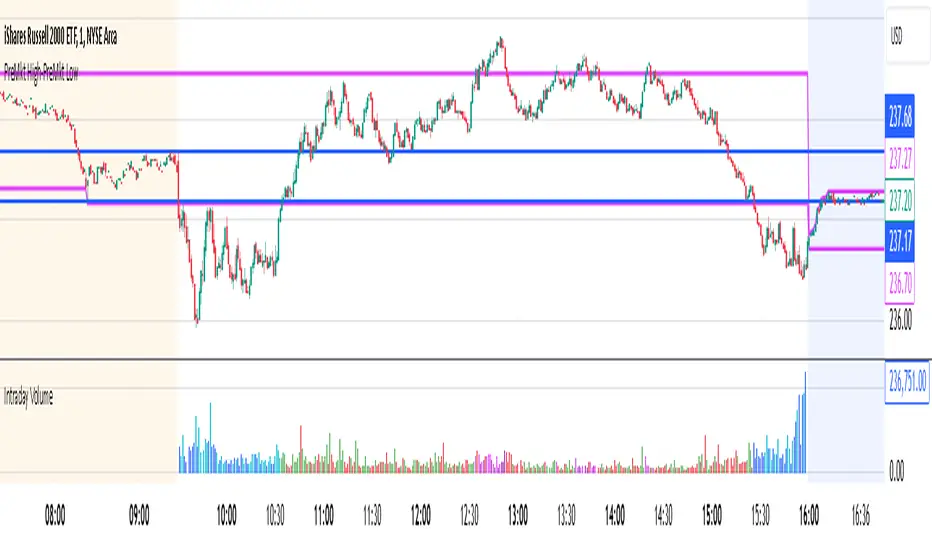
Intraday Volume### Intraday Volume Indicator Explanation
--- this was Mostly created by OpenAI ChatGPT --- it's pretty good!
--- My Commentary: One of the problems I find is with Volume is - it is skewed by the overwhelming volume around the Open and Close. So, as an experiment, I asked ChatGPT to create an indicator to plot the volume everywhere BUT the open.
I added in the CandleColor() function and set the times.
I also changed the Intraday Volume calculation from Cumulative to live.
still Chat GPT - did about 90% of the heavy lift! And, wrote the summary !
----
The "Intraday Volume" indicator is a custom script designed for use on the TradingView platform. It provides a visual representation of the total accumulated trading volume during the intraday trading session, specifically between the market open and close times. Below is a detailed explanation of its functionality:
#### **Key Features:**
1. **Session Times:**
- The indicator defines the intraday session as the period between 9:30 AM EST (market open) and 4:00 PM EST (market close).
- It uses the `timestamp` function to set these times dynamically for each trading day.
2. **Intraday Volume Calculation:**
- During the defined intraday session, the indicator accumulates the trading volume from each bar (candlestick).
- Outside the intraday session, the volume is reset to `na` (not available) to ensure only intraday data is plotted.
3. **Plotting the Volume:**
- The accumulated intraday volume is plotted as a blue column chart in a separate pane below the price chart.
- This provides a clear visualization of how the trading volume evolves throughout the trading session.
4. **Horizontal Reference Line:**
- A horizontal line is added at zero as a visual reference, making it easier to interpret the volume data.
#### **Use Cases:**
- **Volume Analysis:**
- Traders can use the indicator to identify periods of high or low trading activity during the intraday session.
- Peaks in the volume chart may correspond to key market events, such as news releases or significant price movements.
- **Trend Confirmation:**
- Comparing intraday volume with price action can help traders confirm the strength of a trend or the likelihood of a reversal.
- **Custom Time Frames:**
- Although this script is tailored for regular U.S. market hours, it can be adapted for other markets or time zones by modifying the session times.
#### **Customization:**
- **Colors and Styles:**
- The plot color (blue) and style (columns) can be customized to suit user preferences.
- **Session Times:**
- Users can change the session start and end times to match their trading needs or regional market hours.
This indicator is especially useful for intraday traders seeking insights into trading volume dynamics within the trading day. By visualizing the intraday volume, traders can gain a deeper understanding of market behavior and make informed decisions.
Previous Day and Current Day High/LowKey Features:
Previous Day High and Low Lines:
Displays the high (PDH) and low (PDL) levels of the previous trading day.
Allows customization of line colors, styles (solid, dashed, or dotted), and widths.
Extends these lines by a specified number of candles into the current day for better visualization.
Current Day High and Low Lines:
Displays the high (CDH) and low (CDL) levels during the current day's regular trading hours.
Customizable line attributes, including color, style, width, and extension length.
Customizable Input Options:
User-configurable settings for both the previous and current day high/low lines, grouped under respective sections for clarity.
Regular trading hours can be defined manually (default is 9:30 AM to 4:00 PM).
Ability to toggle the visibility of the lines for both the previous and current days.
Automatic Reset at the Start of a New Day:
Captures the high and low values of the completed day and resets for the new day.
Deletes old lines and labels to ensure clarity and avoid overlap.
Dynamic Updates:
Updates the current day's high and low lines and labels as new data comes in.
Adjusts previous day lines dynamically based on the user-defined number of candles to extend.
Session-Based Filtering:
Ensures the calculations and updates are restricted to the defined regular trading hours.
Code Logic:
Input Groups: The script uses grouped inputs to allow users to configure settings for previous and current day levels separately.
Line and Label Management: It creates and deletes lines and labels dynamically to prevent clutter and keep the chart organized.
Session Check: Uses the session input to determine if a bar falls within regular trading hours.
High/Low Calculation: Tracks the high and low for both the previous and current days during regular trading hours.
New Day Detection: Identifies the start of a new trading day to update previous day values and reset current day variables.
Applications:
Intraday Trading: Helps traders identify critical support and resistance levels from the previous and current days.
Trend Analysis: Provides visual cues for price movement trends across consecutive days.
Custom Visualization: With extensive customization options, traders can adapt the indicator to suit their trading style and chart aesthetics.
This script is highly configurable, making it versatile for a wide range of trading strategies and styles.

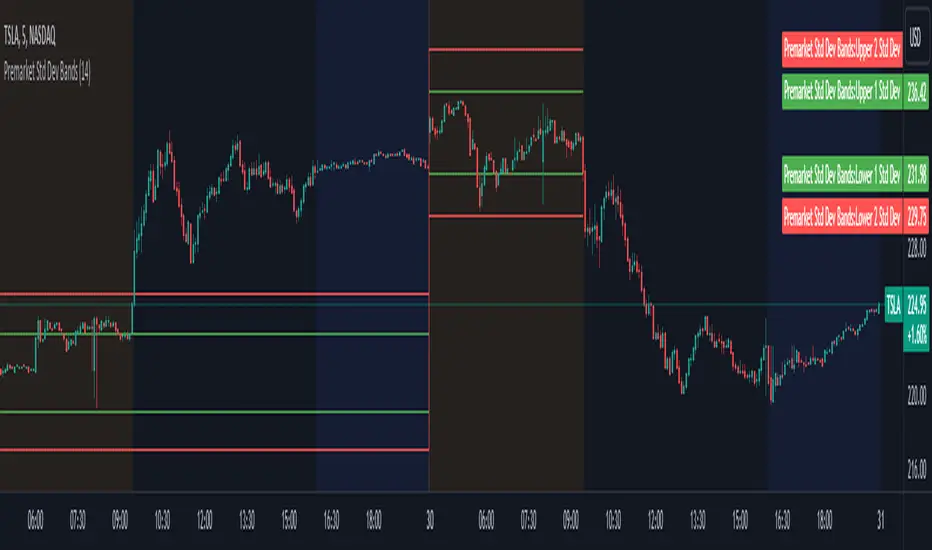
Premarket Std Dev BandsOverview
The Premarket Std Dev Bands indicator is a powerful Pine Script tool designed to help traders gain deeper insights into the premarket session's price movements. This indicator calculates and displays the standard deviation bands for premarket trading, providing valuable information on price volatility and potential support and resistance levels during the premarket hours.
Key Features
Premarket Focus: Specifically designed to analyze price movements during the premarket session, offering unique insights not available with traditional indicators.
Customizable Length: Users can adjust the averaging period for calculating the standard deviation, allowing for tailored analysis based on their trading strategy.
Standard Deviation Bands: Displays both 1 and 2 standard deviation bands, helping traders identify significant price movements and potential reversal points.
Real-Time Updates: Continuously updates the premarket open and close prices, ensuring the bands are accurate and reflective of current market conditions.
How It Works
Premarket Session Identification: The script identifies when the current bar is within the premarket session.
Track Premarket Prices: It tracks the open and close prices during the premarket session.
Calculate Premarket Moves: Once the premarket session ends, it calculates the price movement and stores it in an array.
Compute Averages and Standard Deviation: The script calculates the simple moving average (SMA) and standard deviation of the premarket moves over a specified period.
Plot Standard Deviation Bands: Based on the calculated standard deviation, it plots the 1 and 2 standard deviation bands around the premarket open price.
Usage
To utilize the Premarket Std Dev Bands indicator:
Add the script to your TradingView chart.
Adjust the Length input to set the averaging period for calculating the standard deviation.
Observe the plotted standard deviation bands during the premarket session to identify potential trading opportunities.
Benefits
Enhanced Volatility Analysis: Understand price volatility during the premarket session, which can be crucial for making informed trading decisions.
Support and Resistance Levels: Use the standard deviation bands to identify key support and resistance levels, aiding in better entry and exit points.
Customizable and Flexible: Tailor the averaging period to match your trading style and strategy, making this indicator versatile for various market conditions.
Previous and Premarket High/Low IndicatorDescription:
The "Previous and Premarket High/Low" indicator is designed to help traders identify key levels during the premarket, postmarket, and regular trading sessions. It highlights the highest and lowest prices during the premarket session and the previous trading day, providing critical levels for intraday trading strategies.
Features:
Customizable Display Settings: Users can adjust the colors, line styles, and line widths for the premarket and previous day high/low levels.
Session Labels: Clear labels indicating premarket and postmarket sessions for easy identification.
Alerts: Set alerts for significant price movements, such as new highs or lows during premarket and previous trading sessions.

NSDT Custom High and Low LinesFirst, the credit for the original script to plot a High and Low between a certain time goes to developer paaax.
I took that idea, converted it to Pinescript V5, cleaned up the code, and added a few more lines so you can plot different levels based on time of day.
Published open source like the original.
The example shown has:
Blue - plotting from the start of the Futures Asian session to the start of the Futures USA Session. (6:00PM - 9:30AM Eastern)
Yellow - plotting from the start of the Futures Europe session to the start of the Futures USA Session. (3:00AM - 9:30AM Eastern)
Green - plotting from the start of the Futures US Premarket session to the start of the Futures USA Session. (8:00AM - 9:30AM Eastern)
These are great levels to use for breakouts and/or support and resistance.
Combine these levels with the 5 min Open Range levels, as you have some good trades.
Each of the three sessions have individual start and end times that can be modified by the trader, so you can easily mark off important areas for your style of trading.

Pre-market Highs & Lows on regular trading hours (RTH) chartShows pre-market highs and lows on RTH or ETH chart
-Pre-market duration user input (default is 16 'bar hours'; covering the time from S&P RTH close at 4pm >> 9:30am RTH open next day
-Displays on both RTH and ETH charts
-Written for ES (ES1! or e.g ESM2023), but tested and working on SPY, SPX
-Works across timeframes
Example usage on Electronic trading hours (ETH) chart; showing the 'bar hours' user input lookback duration visually

[Pt] Premarket Breakout StrategyThis is a 1 trade per day strategy for trading SPY or QQQ index. By default, this is designed for 1 min time frame. This was an experimental script that seems to be profitable at the time of publication.
How it works:
Pre-market high and low is defined per trading day between 9:00 to 9:30 EST.
Then we looking for the first breakout on either PM high or PM low.
- Breakout high = long trade
- Breakout low = short trade
If long trade, we wait until Stochastic RSI D signal line to hit a lower threshold (18 by default). Then we enter long when K crosses above D line.
If short trade, we wait until Stochastic RSI D signal line to hit an upper threshold (82 by default). Then we enter short when K crosses below D line.
Stop loss for long
- set to PM low if entry is above PM high + %ATR buffer
- or set to PM range + %ATR buffer
Stop loss for short
- set to PM high if entry is below PM low + %ATR buffer
- or set to PM range + %ATR buffer
Profit target is set to 2x the risk by default.
*Note: Different Stochastic RSI lengths should be used if trading 5 min time frame. See tooltip.
Happy trading~~!

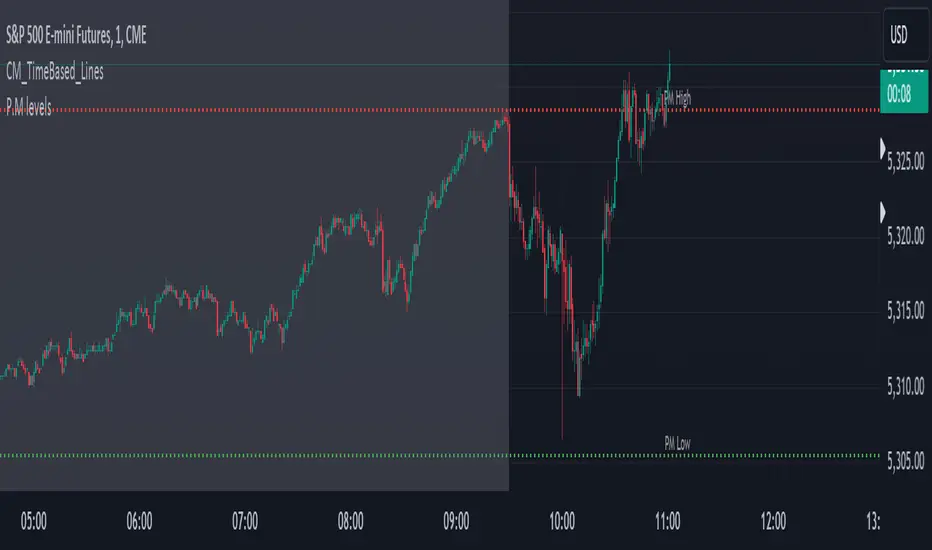
Pre-Market levels for Futures This indicator draws the Pre-Market Low and High for futures. Futures do not really have "P.M" because they are almost always open, but I chart /ES and trade $SPY options, so this has been useful in finding P.M levels.
Lepelle's Key LevelsCredit to original code goes to paaax and NSDT. Modified to include premarket H/L levels and to show only daily levels. Indicator includes Close levels.
-US Premarket High and Low Levels
-Daily OHL Levels (No close included)
-Yesterday and Previous day OHLC level
-Labels and ability to modify user preferences (color, line)
