Mini ChartDescription:
The indicator displays a mini candlestick chart as a table. You can add up to 3 such charts and use different assets / timeframes in any of them. Each chart can have a max of 15-20 candles (depending on the settings). You can customise the colors and styles, including price scale, grid and a volume chart. If you hover on any displayed candle, you will see price and volume info for that candle. The candles can also be highlighted based on price or volume. The indicator can display data from both higher and lower timeframes, but is not updating very quickly if you display too many candles.
Inputs:
Each mini chart has inputs for:
- Number of candles
- Timeframe
- Asset
- Table position
- Table height
- Grid resolution
- Left and Right price scales
- Candle highlighting (which can be based on Min/Max price, Min/Max Volume, Rising/Falling Volume)
- And a checkbox for displaying volume chart below the candles
Below those inputs you have inputs for customising all the mini charts with the following:
- Header and Footer info
- Colors and styles of the charts, candles and price scales
- Sizing and spacing of the candles
- Height of the volume chart and padding of the price chart
Note:
The indicator utilises "table" objects. The limit of table cells for a chart is 10,000. Thus, the more candles you display in the mini charts, the more laggy the indicator will feel, and at some point you may surpass the 10,000 cells limit, at which point you're going to get an error.
The indicator might not update very quickly, especially if you're using data from lower timeframes.
Preview

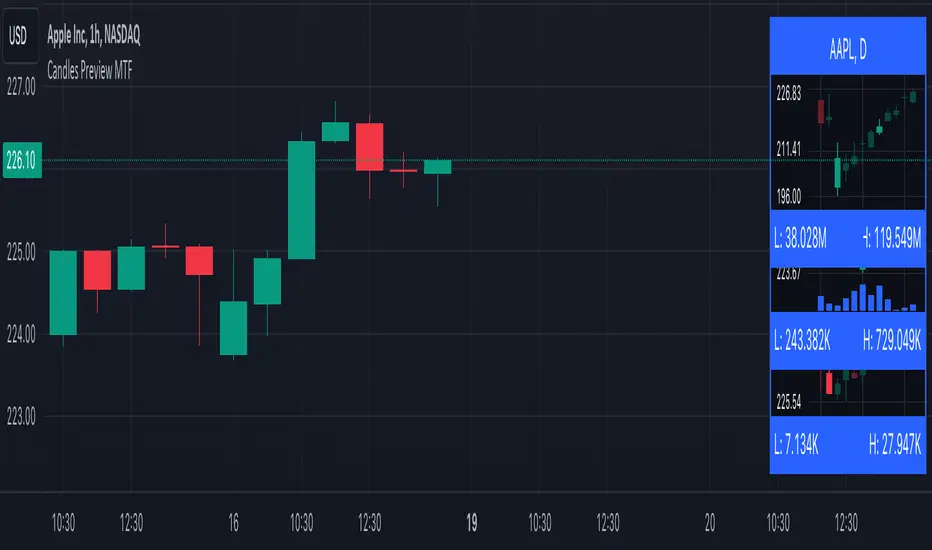
Candles Preview MTFDescription:
The script displays a mini-chart with candlesticks from different symbols and timeframes (up to 8 in total). It can display up to 24 candles. You can use it on any timeframe, but it is intended to work with the same or higher timeframes than the chart's. For example: you can add a mini-chart displaying candles of the chart's symbol from Weekly timeframe, while being on Daily timeframe. The script updates in realtime, but it is not recommended to use it on very low timeframes (1 second for example).
Below you can find some examples of using the indicator:
(custom colors, highest and lowest volume in footer, symbol name with exchange in header)
(a chart with Weekly and a chart with Monthly candles, custom colors, no footer, timeframe in header)
(charts for 5 different stocks, no footer, symbol name in header)
Along with the chart it displays a header with Symbol and Timeframe, as well as footer with highest and lowest Price or Volume for selected number of candles. Each candle displays a tooltip with the following information when hovered:
- Date / Time
- Open, High, Low and Close prices
- Price change (absolute and %)
- Volume
- Volume change (absolute and %)
By default the interface changes colors if you switch to / from "Dark mode", but you can also manually customise any colors to your likings. You can also hide both header and footer, customise what information is displayed in them, show / hide the chart's grid and change its "density", choose position and height for each of the 8 charts. Additionally, you can change the timezone used to calculate time and date.
Inputs:
The indicator's inputs are separated into groups:
- Other (contains the "Timezone" parameter)
- Chart 1 (contains parameters specific for each chart)
- Chart 2
- Chart N
- ...
- Charts (contains parameters that modify all the 8 charts)
- Colors (contains parameters for styling)
How to get it:
Contact me on Tradingview using private chat, and I will grant you a 3 day trial access
On a side note:
You can share your feedback or ideas in the comments, it will help me improve the indicator. Refer to "Release notes" section for any future updates. Thank you!
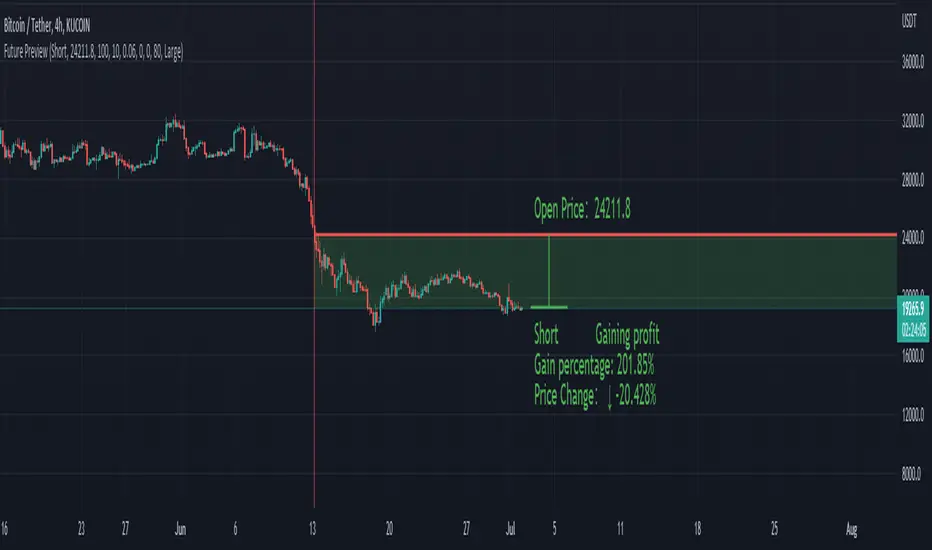
Future PreviewFuture Preview
Calculate real-time future order profit with open price, leverage and commission fee. Simple and straight forward. If you need any additional feature, please leave a comment below. I am glad to help.
Usage:
When adding Future Preview to chart, it will ask order open time and open price on the chart by clicking with left mouse on the desired value. These value can be changed lately, as well as the leverage and commission fee. Default leverage is 10 and default commission fee is 0.06% (taker).
There will be two horizontal lines. The solid longer line is the open price line, it shows the order open price. The shorter line moving with real-time price is the current price line, it shows the current price. There will be preview data shows on top or below the price line. Open price line is red for short order and green for long order. The current price line is red when the order is losing and it is green when it profiting. The back ground color follows the color of current price line. Background color transparency and gain/loss color can be changed in options.
There will be one horizontal line on the left if the option of showing open time is on (default is on). It shows the time stamp when current order opened.
After adding Future Preview to chart, there is option to add Taking Profit(TP) or Stop Loss(SL) to the chart.
Font size can be changed in option