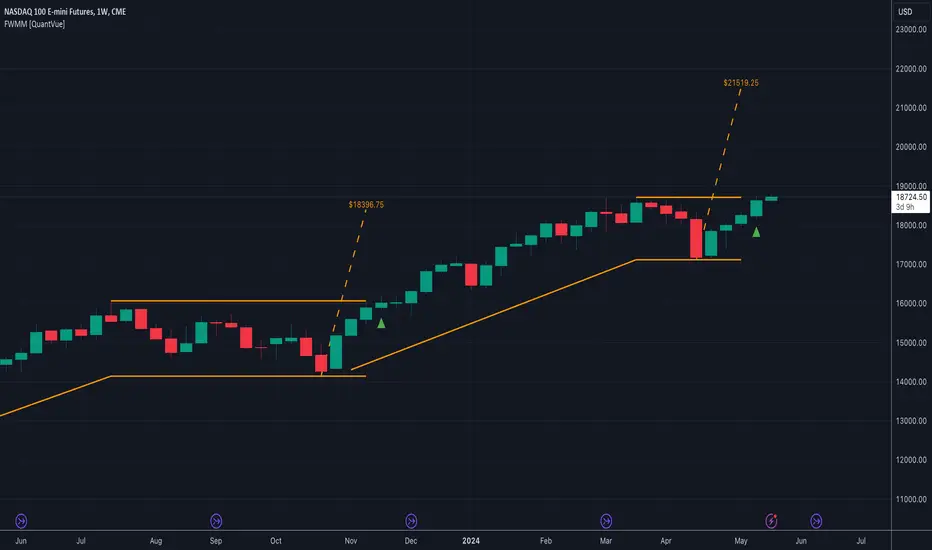
Flags With Measured Move [QuantVue]Flags with Measured Moves is a technical analysis tool that identifies bull flags and provides a measured move target.
A bull flag is a continuation pattern that occurs within the context of a general uptrend. It represents a pause or small consolidation before the price resumes its upward movement.
A bull flag consists of two sections: the flagpole and the flag.
The flagpole is the initial upward movement that occurs before the flag forms.
The flag forms as the price consolidates after the initial uptrend. During this phase, the price tends to drift downward or sideways, ideally with declining volume.
Once the flag has put in a low, the initial range of thrust is added to the flag low to form the measured move target.
Every element of the flag is customizable by the trader, including the size and length of the prior uptrend and the minimum and maximum flag depth and length.
The indicator also includes alerts for when new flags are formed, when a breakout from the flag occurs, and when the measured move target is reached.
By default, the indicator settings are set for use on a daily timeframe. If using the indicator on an intraday timeframe, you will need to adjust the settings.
Give this indicator a BOOST and COMMENT your thoughts!
We hope you enjoy.
Cheers!
Pricepattern
Pattern Forecast (Expo)█ Overview
The Pattern Forecast indicator is a technical analysis tool that scans historical price data to identify common chart patterns and then analyzes the price movements that followed these patterns. It takes this information and projects it into the future to provide traders with potential price actions that may occur if the same pattern is identified in real-time market data. This projection helps traders to understand the possible outcomes based on the previous occurrences of the pattern, thereby offering a clearer perspective of the market scenario. By analyzing the historical data and understanding the subsequent price movements following the appearance of a specific pattern, the indicator can provide valuable insights into potential future market behavior.
█ Calculations
The indicator works by scanning historical price data for various candlestick patterns. It includes all in-built TradingView patterns, credit to TradingView that has coded them.
Essentially, the indicator takes the historical price moves that followed the pattern to forecast what might happen next.
█ Example
In this example, the algorithm is set to search for the Inverted Hammer Bullish candlestick pattern. If the pattern is found, the historical outcome is then projected into the future. This helps traders to understand how the past pattern evolved over time.
█ How to use
Providing traders with a comprehensive understanding of historical patterns and their implications for future price action allows them to assess the likelihood of specific market scenarios objectively. For example, suppose the pattern forecast indicator suggests that a particular pattern is likely to lead to a bullish move in the market. A trader might consider going long if the same pattern is identified in the real-time market. Similarly, a trader might consider shorting the asset if the indicator suggests a bearish move is likely, if the same pattern is identified in the real-time market.
█ Settings
Pattern
Select the pattern that the indicator should scan for. All inbuilt TradingView patterns can be selected.
Forecast Candles
Number of candles to project into the future.
-----------------
Disclaimer
The information contained in my Scripts/Indicators/Ideas/Algos/Systems does not constitute financial advice or a solicitation to buy or sell any securities of any type. I will not accept liability for any loss or damage, including without limitation any loss of profit, which may arise directly or indirectly from the use of or reliance on such information.
All investments involve risk, and the past performance of a security, industry, sector, market, financial product, trading strategy, backtest, or individual's trading does not guarantee future results or returns. Investors are fully responsible for any investment decisions they make. Such decisions should be based solely on an evaluation of their financial circumstances, investment objectives, risk tolerance, and liquidity needs.
My Scripts/Indicators/Ideas/Algos/Systems are only for educational purposes!

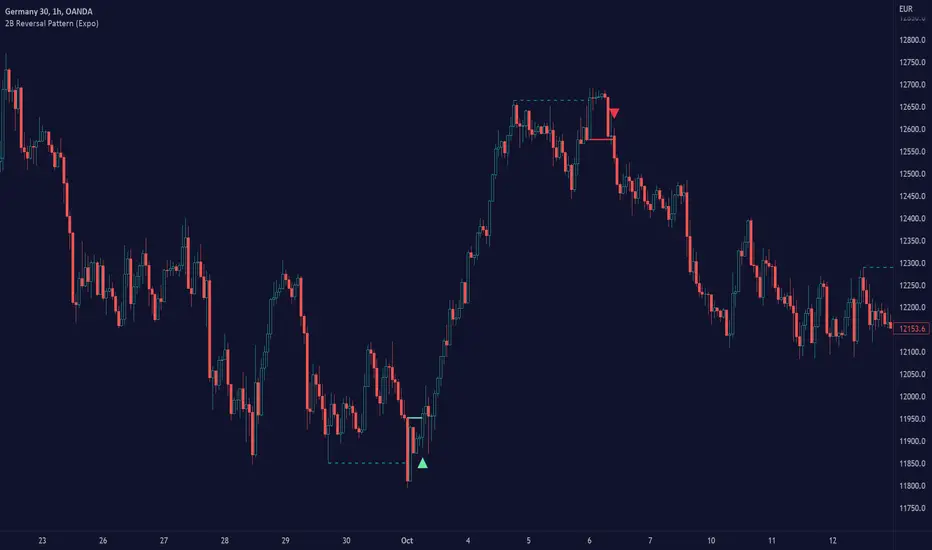
2B Reversal Pattern (Expo)█ Overview
The 2B reversal pattern , also called the "spring pattern", is a popular chart pattern professional traders use to identify potential trend reversals. It occurs when the price appears to be breaking down or up and then suddenly bounces back up/down, forming a "spring" or "false breakout" pattern. This pattern indicates that the trend is losing momentum and that a reversal is coming.
In a bearish market , the "spring pattern" occurs when the price of an asset breaks below a support level, causing many traders to sell their positions and causing the price to drop even further. However, the selling pressure eases at some point, and the price begins to rebound, "springing" back above the support level. This rebound creates a long opportunity for traders who can enter the market at a lower price.
In a bullish market , the "spring pattern" occurs when the price of an asset breaks above a resistance level, causing many traders to buy into the asset and drive the price up even further. However, the buying pressure eases at some point, and the price begins to decline, "springing" below the resistance level. This decline creates a selling opportunity for traders who can short the market at a higher price.
█ What are the benefits of using the 2B Reversal Pattern?
The benefits of using the 2B Reversal pattern as a trader include identifying potential buying or selling opportunities with reduced risk. By waiting for the price to "spring back" to the initial breakout level, traders can avoid entering the market too soon and minimize the risk of potential losses.
█ How to use
Traders can use the 2B reversal pattern to identify reversals. If the pattern occurs after an uptrend, traders may sell their long positions or enter a short position, anticipating a reversal to a downtrend. If the pattern occurs after a downtrend, traders may sell their short positions or enter a long position, anticipating a reversal to an uptrend.
█ Consolidation Strategy
First, traders should identify a period of price consolidation or a trading range where the price has been trading sideways for some time. The key feature of the "spring pattern" is a sudden, sharp move downward/upwards through the lower/upper boundary of this trading range, often accompanied by high volume.
However, instead of continuing to move lower/higher, the price then quickly recovers and moves back into the trading range, often on low volume. This quick recovery is the "spring" part of the pattern and suggests that the market has rejected the lower/higher price and that buying/selling pressure is building.
Traders may use the "spring pattern" as a signal to buy/sell the asset, suggesting strong demand/supply for the stock at the lower/higher price level. However, as with all trading strategies, it is important to use other indicators and to manage risk to minimize potential losses carefully.
-----------------
Disclaimer
The information contained in my Scripts/Indicators/Ideas/Algos/Systems does not constitute financial advice or a solicitation to buy or sell any securities of any type. I will not accept liability for any loss or damage, including without limitation any loss of profit, which may arise directly or indirectly from the use of or reliance on such information.
All investments involve risk, and the past performance of a security, industry, sector, market, financial product, trading strategy, backtest, or individual's trading does not guarantee future results or returns. Investors are fully responsible for any investment decisions they make. Such decisions should be based solely on an evaluation of their financial circumstances, investment objectives, risk tolerance, and liquidity needs.
My Scripts/Indicators/Ideas/Algos/Systems are only for educational purposes!
PPSRMA -COMPILATION OF 2 GREAT SCRIPTS AND DOUBLE MAFirst of all I just did the compilation so this is not my idea, it is just a miscellany.
This script has been compiled for authors who have just been introduced to scripts : for unloading and leaving room for other indicators especially:non-pro users needs space for indicators and users seeking best technical combination. This script says thousands of comments.
It's the best combination I've ever try and see everything about future. All efforts belongs to ChrisMoody.
( And fernandofurtado for double moving average codes)
--------------- INGREDIENTS ------------------
1-) Price Action Bars - Price Patterns - CM_Price-Action-Bars-Price Patterns That Work! ( by ChrisMoody )
Original :
2-) Oldschool Projected High & Lows - CM_OldSchool_Projected_high_Low ( by ChrisMoody )
Original :
3-) Multiple Moving Averages - ( by fernandofurtado )
Original :
---------- SETTINGS- -----------
- Use dark theme
- Select SMA fast : 25 SMA slow : 50 ( Inputs)
- Tick all inputs and see price action bars ( Inputs)
FOR FLOW TRADERS :
** Use 30 mins graphs with - Weekly Projected High & Lows
*** Choose high liquidity stocks ( Bank stocks etc.)
FOR MEDIUM - LONG TERM TRADERS AND INVESTORS
** Use 4 hour graphs with - Quarterly Projected High & Lows OR
** 1 day graphs with - Yearly Projected High &Lows ( OR Quarterly Projected High & Lows )
------------------- SUGGESTIONS --------------------
* Add MACD (12,26) and RSI (14) in your empty slots.
* Use mostly on stock markets.
* Be careful about stocks under red breakout line are dangerous same as above green breakout levels.
* Always consider with all indicators and patterns (especially price patterns), get confirmed from Volume.
* Consider with financial analysis ( mostly for medium-long term )
NOTE : The authors' codes are specified on scripts source codes.

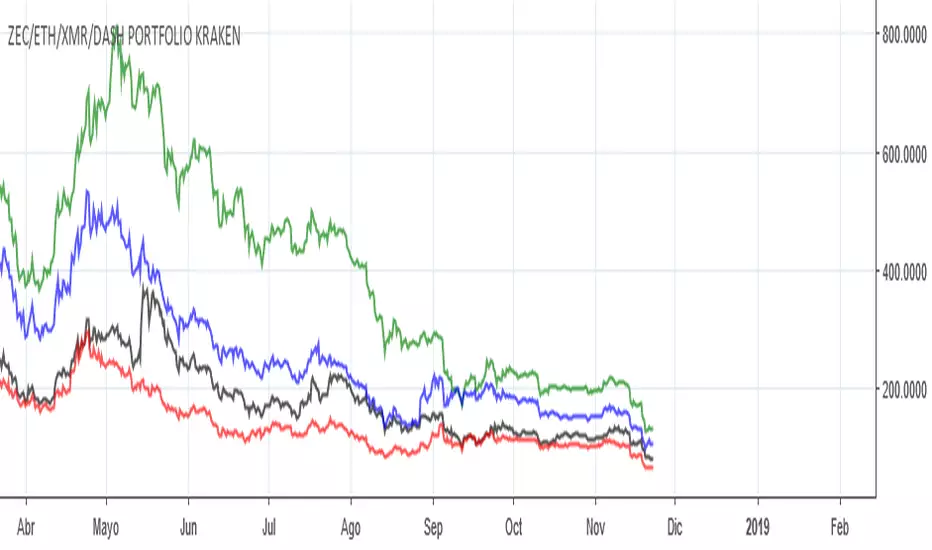
ZEC/ETH/XMR/DASH PORTFOLIO KRAKENPortfolio chart with total value.
I will try to optimize it, maybe add % option if I findout how ;p
Or maybe a normalization would be good, idk.
Cheers!