SuperTrend + Relative Volume (Kernel Optimized)Introducing our new KDE Optimized Supertrend + Relative Volume Indicator!
This innovative indicator combines the power of the Supertrend indicator along with Relative Volume. It utilizes the Kernel Density Estimation (KDE) to estimate the probability of a candlestick marking a significant trend break or reversal.
❓How to Interpret the KDE %:
The KDE % is a crucial metric that reflects the likelihood that the current candlestick represents a true break in the SuperTrend line, supported by an increase in relative volume. It estimates the probability of a trend shift or continuation based on historical SuperTrend breaks and volume patterns:
Low KDE %: A lower probability that the current break is significant. Price action is less likely to reverse, and the trend may continue.
Moderate KDE - High KDE %: An increased possibility that a trend reversal or consolidation could occur. Traders should start watching for confirmation signals.
📌How Does It Work?
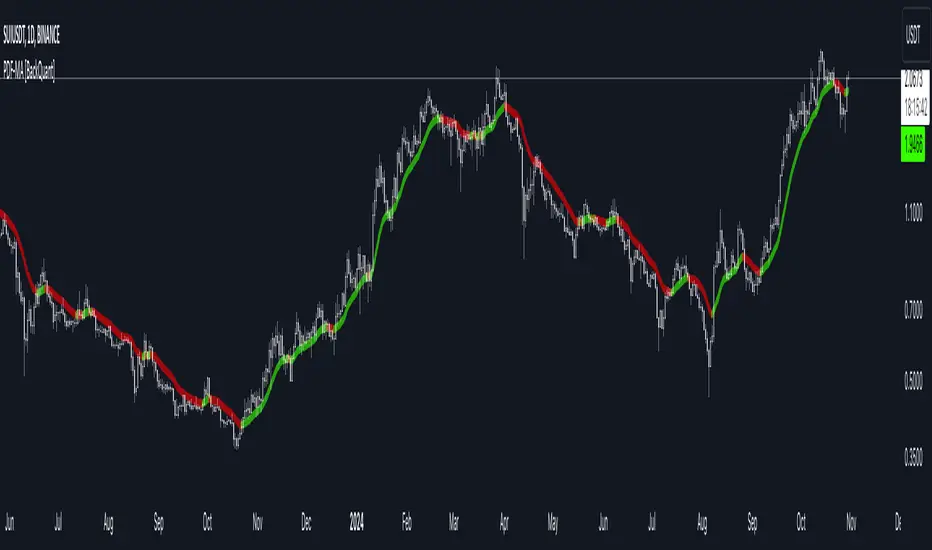
The SuperTrend indicator uses the Average True Range (ATR) to determine the direction of the trend and identifies when the price crosses the SuperTrend line, signaling a potential trend reversal. Here's how the KDE Optimized SuperTrend Indicator works:
SuperTrend Calculation: The SuperTrend indicator is calculated, and when the price breaks above (bullish) or below (bearish) the SuperTrend line, it is logged as a significant event.
Relative Volume: For each break in the SuperTrend line, we calculate the relative volume (current volume vs. the average volume over a defined period). High relative volume can suggest stronger confirmation of the trend break.
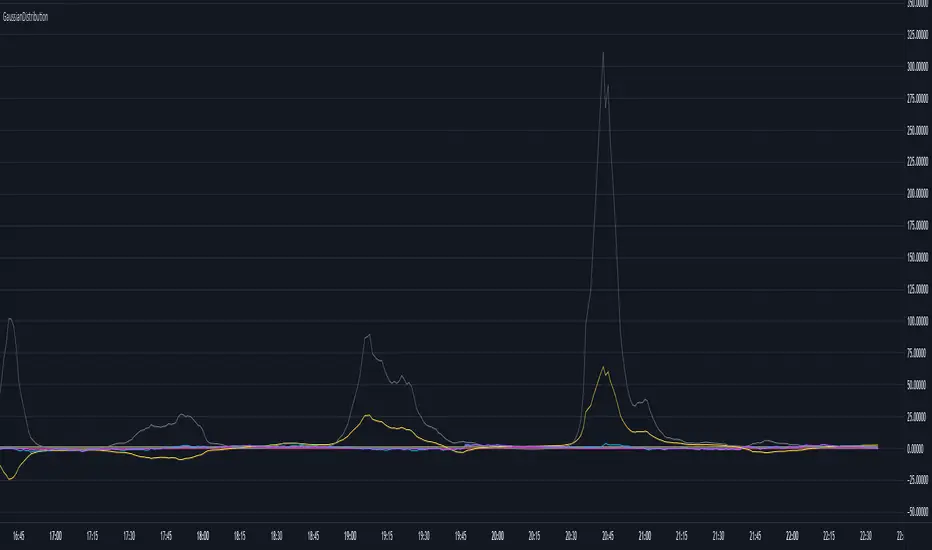
KDE Array Calculation: KDE is applied to the break points and relative volume data:
Define the KDE options: Bandwidth, Number of Steps, and Array Range (Array Max - Array Min).
Create a density range array using the defined number of steps, corresponding to potential break points.
Apply a Gaussian kernel function to the break points and volume data to estimate the likelihood of the trend break being significant.
KDE Value and Signal Generation: The KDE array is updated as each break occurs. The KDE % is calculated for the breakout candlestick, representing the likelihood of the trend break being significant. If the KDE value exceeds the defined activation threshold, a darker bullish or bearish arrow is plotted after bar confirmation. If the KDE value falls below the threshold, a more transparent arrow is drawn, indicating a possible but lower probability break.
⚙️Settings:
SuperTrend Settings:
ATR Length: The period over which the Average True Range (ATR) is calculated.
Multiplier: The multiplier applied to the ATR to determine the SuperTrend threshold.
KDE Settings:
Bandwidth: Determines the smoothness of the KDE function and the width of the influence of each break point.
Number of Bins (Steps): Defines the precision of the KDE algorithm, with higher values offering more detailed calculations.
KDE Threshold %: The level at which relative volume is considered significant for confirming a break.
Relative Volume Length: The number of historic candles used in calculating KDE %
Indicateur Pine Script®