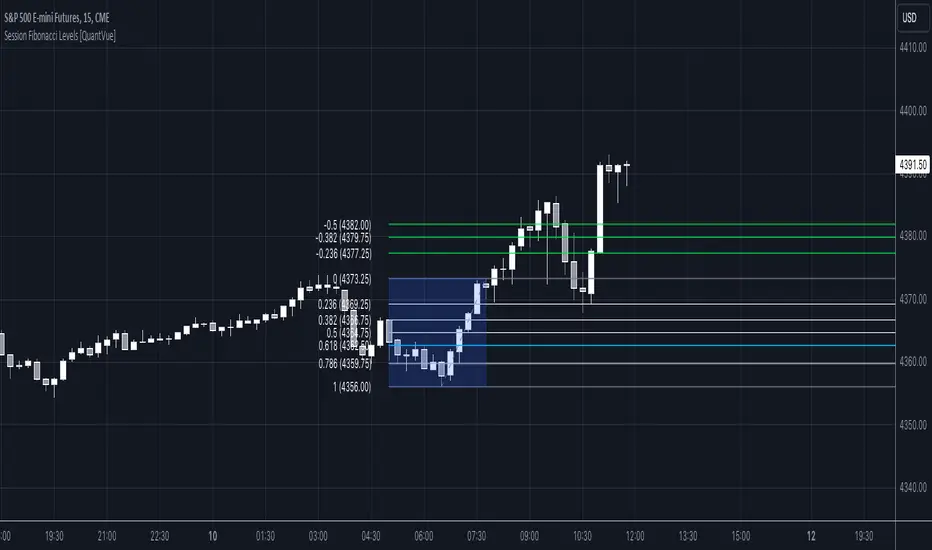
Session Fibonacci Levels [QuantVue]The "Session Fibonacci Levels" indicator is a powerful tool designed for traders who aim to use Fibonacci retracement and extension levels in their trading strategy.
The indicator combines Fibonacci levels with customized trading sessions, allowing traders to observe and utilize Fibonacci levels that are automatically calculated for each defined session.
This approach offers a dynamic and session-relevant perspective on potential support and resistance levels, which can be crucial for intraday trading strategies.
🔹The indicator calculates Fibonacci retracement and extension levels based on the high and low prices of a specified trading session, dynamically adjusting to the location of the high and low bar.
If the low of the session occurs before the high, the fib levels are measured from low to high.
If the low of the session occurs after the high, the fib levels are measured from high to low.
🔹Users can set their time zone and define trading sessions, allowing for flexibility and applicability across global markets. This is particularly beneficial for traders who focus on specific market hours like the London or New York sessions.
Important sessions:
New York (8:00am - 5:00pm EST)
London (3:00am - 12:00pm EST)
Asia (7:00pm - 4:00am EST)
Custom session (user defined session in indicator settings)
🔹The indicator dynamically updates Fibonacci levels as new highs and lows are made within the session, keeping the analysis current. Additionally, it provides alerts when prices hit key Fibonacci levels, aiding in timely decision-making.
How to Use:
Configure the time zone and session time
Once the session begins, the indicator will begin highlighting the session range
When the session ends, Fibonacci levels based on the high and low of the session will be drawn
Use these levels to identify potential support and resistance areas
Quantvue
Monthly Range Support & Resistance [QuantVue]The Monthly Range Support & Resistance Levels is an advanced analytical tool designed to assess monthly price movements and provide potential support and resistance levels.
This tool examines the average monthly price fluctuations over the past 7 months (default), and creates support and resistance levels based on the opening price.
The indicator also considers a standard deviation multiplier.
This enables traders and investors to identify potential price zones.
The support and resistance levels are dynamically updated every month.
Users can also choose to view previous daily levels as well.
Customizable settings for this tool include:
-Averaging Period: Adjust the number of months to calculate the average monthly range.
-Standard Deviation Multiplier: Modify the standard deviation multiplier to fine-tune the sensitivity of the support and resistance levels. A higher multiplier will result in wider levels, accommodating higher price fluctuations.
-Toggle Support & Resistance Prices: Easily switch on or off the display of support and resistance price levels.
-Show Monthly Open Line: Display the monthly opening price as a reference point on the chart.
-Show Previous Levels: Choose whether to display past daily support and resistance levels.
Note: this indicator works on a 1 hour timeframe or higher
Give this indicator a BOOST and COMMENT your thoughts!
We hope you enjoy.
Cheers!

Reversal Confirmations [QuantVue]The Reversal Confirmation Indicator is based on price action and looks to provide opportunities when price gets stretched.
The indicator works by finding the highest and lowest points over the user selected lookback period.
If price closes below the low of the highest bar or closes above the high of the lowest bar a possible reversion to the mean may occur and the indicator will plot a triangle and fire an alert.
This indicator works a reversion to the mean or to potentially time entries in trending markets.
Fully customizable settings:
🔹Lookback Period
🔹Colors
🔹Show / hide upper & lower channels
🔹Show / hide the mean
Give this indicator a BOOST and COMMENT your thoughts!
We hope you enjoy.
Cheers!

Double Tops & Bottoms [QuantVue]This indicator is designed to detect and plot Double Tops and Double Bottoms, by setting the initial high or low using standard pivot points.
Double Tops
A Double Top is a bearish reversal pattern, typically found when an uptrend returns back to a prior peak. It signifies a potential turning point or resistance level and could potentially reverse in direction.
The pattern is confirmed as a Double Top when the price breaks above the resistance level, but closes below it. A decisive close below this level is seen as a confirmation of the bearish trend.
Double Bottoms
A Double Bottom, on the other hand, is a bullish reversal pattern typically found after a downtrend. It signals a potential turning point or support level where the price has bottomed and could potentially reverse upwards.
The pattern is confirmed as a Double Bottom when the price breaks below the support level, but closes above it. A decisive close above this level is viewed as a confirmation of the bullish trend.
Indicator Features
🔹Double Top Detection: When a double top is identified, a downward-pointing triangle will be plotted above the bar, and if the alerts are enabled, a notification will be triggered.
🔹Double Bottom Detection: When a double bottom is identified, an upward-pointing triangle will be plotted below the bar, and if the alerts are enabled, a notification will be triggered.
🔹Pivot Lookback: Defines the number of bars to the left and right of the pivot that must be lower/higher to qualify as a pivot.
🔹Maximum Length Between Tops/Bottoms: Maximum number of bars between two tops/bottoms to be considered a double top or bottom.
🔹Style Settings: Allows the user to customize the appearance of the lines indicating the tops/bottoms. Options include color selection, line style (dotted, dashed, or solid), and line thickness.
🔹Alerts: The user can enable or disable alerts for Double Top and Double Bottom.
Give this indicator a BOOST and COMMENT your thoughts!
We hope you enjoy.
Cheers!

FVG w/ Fibs [QuantVue]The "FVG w/ Fibs" indicator is a trading tool designed to identify and visualize Fair Value Gaps (FVGs) while overlaying two Fibonacci retracement levels.
• Bullish FVG: Occurs when the low of the current bar is higher than the high of two bars ago, and the previous close is higher than the high of two bars ago.
• Bearish FVG: Occurs when the high of the current bar is lower than the low of two bars ago, and the previous close is lower than the low of two bars ago.
The indicator filters these gaps based on user-defined criteria such as the minimum percentage size of the gap.
Once identified, these FVGs are highlighted on the chart using customizable boxes and the 50% and 61.8% (default settings) Fibonacci retracement levels are calculated and drawn based on the size of the identified FVG.
• Dynamically updates and extends the boxes as the price evolves.
• Alerts / visual changes for FVGs that get filled.
• User option for fills by Wicks or Close
• User-customizable settings for box colors, styles, and Fibonacci level appearances
Give this indicator a BOOST and COMMENT your thoughts!
We hope you enjoy.
Cheers!

Coppock Curve w/ Early Turns [QuantVue]The Coppock Curve is a momentum oscillator developed by Edwin Coppock in 1962. The curve is calculated using a combination of the rate of change (ROC) for two distinct periods, which are then subjected to a weighted moving average (WMA).
History of the Coppock Curve:
The Coppock Curve was originally designed for use on a monthly time frame to identify buying opportunities in stock market indices, primarily after significant declines or bear markets.
Historically, the monthly time frame has been the most popular for the Coppock Curve, especially for long-term trend analysis and spotting the beginnings of potential bull markets after bearish periods.
The signal wasn't initially designed for finding sell signals, however it can be used to look for tops as well.
When the indicator is above zero it indicates a hold. When the indicator drops below zero it indicates a sell, and when the indicator moves above zero it signals a buy.
While this indicator was originally designed to be used on monthly charts of the indices, many traders now use this on individual equities and etfs on all different time frames.
About this Indicator:
The Coppock Curve is plotted with colors changing based on its position relative to the zero line. When above zero, it's green, and when below, it's red. (default settings)
An absolute zero line is also plotted in black to serve as a reference.
In addition to the classic Coppock Curve, this indicator looks to identify "early turns" or potential reversals of the Coppock Curve rather than waiting for the indicator to cross above or below the zero line.
Give this indicator a BOOST and COMMENT your thoughts!
We hope you enjoy.
Cheers!

Moving Average Continuity [QuantVue]"Moving Average Continuity," is designed to compare the position of two Moving Averages (MAs) across multiple timeframes.
The user can select three timeframes and determine the length and type of both a fast and slow moving average.
The indicator will display a small table in a user selected location.
This table helps traders quickly determine if, for their selected timeframes, the faster moving average is trending above or below the slower moving average.
The “Moving Average Continuity” indicator can also send you three types of alerts;
1. All moving averages are aligned bullish
2. All moving averages are aligned bearish
3. Moving averages are mixed
Key Features:
1. Timeframes: The user can select up to three distinct timeframes to compare the moving averages.
2. Moving Average Inputs: For each MA, users can determine:
• Length of the MA
• Type of the MA - Options include EMA (Exponential Moving Average), SMA (Simple Moving Average), HMA (Hull Moving Average), WMA (Weighted Moving Average), and VWMA (Volume Weighted Moving Average).
3. Positioning: Users have the ability to adjust the table's positioning (top, middle, or bottom) and horizontal alignment (right, center, or left) on the chart overlay.
4. Runtime Error Prevention: The indicator will throw an error if the chart's timeframe exceeds the maximum selected timeframe, ensuring that comparisons are done correctly.
Give this indicator a BOOST and COMMENT your thoughts!
We hope you enjoy.
Cheers.

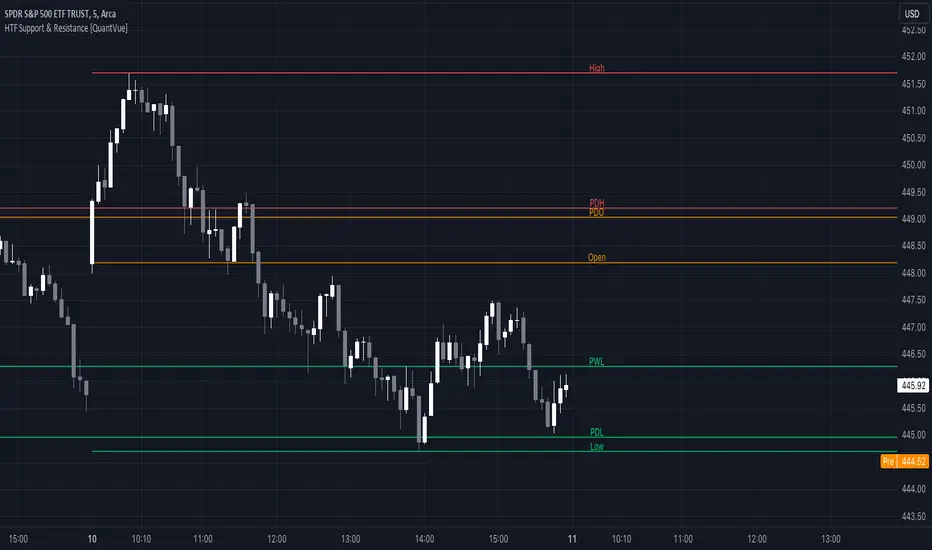
HTF Support & Resistance [QuantVue]The "HTF Support / Resistance" indicator highlights critical price levels across multiple timeframes helping you recognize major support/resistance areas.
Whether you're a day trader needing to understand the current day's price action, or a long-term investor looking to analyze yearly trends, this indicator can be a valuable addition to your trading toolkit.
The daily levels, which can be enabled or disabled according to your preference, will give you insights into the open, high, and low levels for the current and previous day.
Similarly, weekly levels provide information for the current and previous weeks, while monthly levels cover the current and previous months.
In addition, the indicator offers more extended views through its quarterly and yearly levels. These will help you understand long-term trends and major support/resistance areas, and they can be particularly beneficial for major support/resistance levels.
Features:
🔹Visualization: View support and resistance levels from Daily, Weekly, Monthly, Quarterly, and Yearly timeframes.
🔹Customizable Appearance: Tailor the display colors and line styles for each level according to your preferences.
🔹Clear Labeling: Each level is clearly labeled for quick identification.
🔹Extension Option: Opt to extend the support and resistance lines across the chart for better visualization.
Give this indicator a BOOST and COMMENT your thoughts!
We hope you enjoy.
Cheers.
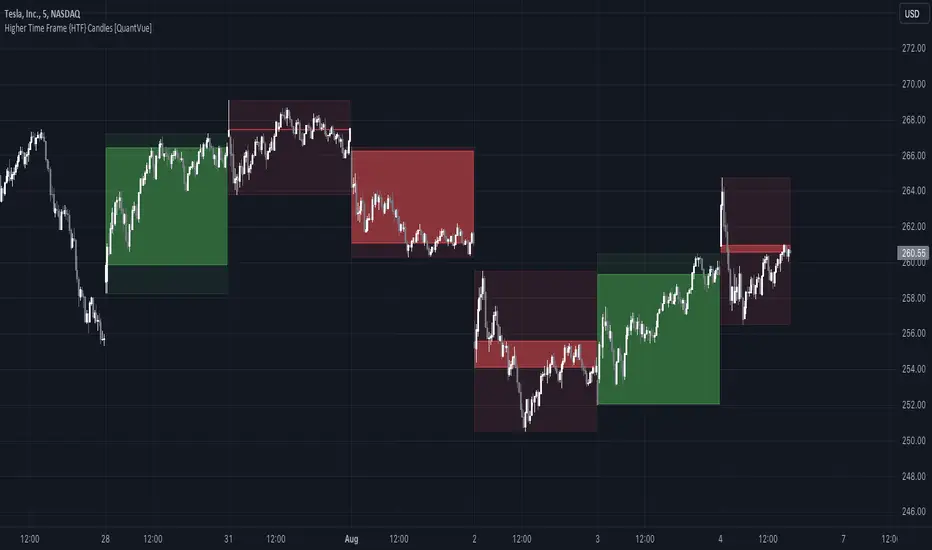
Higher Time Frame {HTF} Candles [QuantVue]Introducing the Higher Time Frame {HTF} Candles from QuantVue!
This script was developed to help you visually emphasize higher time frame (HTF) candles.
Higher time frames reduce the 'noise' inherent in lower time frames, providing a clearer, more accurate picture of the market's movements.
By examining higher time frames, you can better identify trends, reversals, and key areas of support and resistance.
The Higher Time Frame Candles indicator overlays higher time frame data directly onto your current chart.
You can easily specify the higher time frame candles you'd like to view, and the indicator will overlay the higher time frame candles directly over the corresponding current time frame bars.
This indicator by default will display the most current higher time frame candle plus the previous 5 candles.
Give this indicator a BOOST and COMMENT your thoughts!
We hope you enjoy.
Cheers.
ATR Extension [QuantVue]The Moving Average ATR Extension Indicator offers a powerful blend of two key market elements: the Average True Range (ATR) and Moving Averages (MA), capturing the dynamics of market momentum and trend direction.
This indicator is used to measure market extension from a user-selected moving average based on multiples of the Average True Range (ATR). By doing this, it becomes remarkably straightforward to spot strength at breakout points or exhaustion near the end of a run.
As a market breaks out the extension indicates a surge in buying pressure, while an extension after a sizeable move can often be an indication of market exhaustion. This extended position essentially reflects over-enthusiastic buying and could be an early warning sign of a potential trend reversal.
Breakout Strength:
Exhaustion:
Give this indicator a BOOST and COMMENT your thoughts!
We hope you enjoy.
Cheers.

Daily Range Support & Resistance Levels [QuantVue]The Daily Range Support & Resistance Levels is an advanced analytical tool designed to assess daily price movements and provide potential support and resistance levels.
This tool examines the average daily price fluctuations over the past 150 trading days, and creates support and resistance levels based on the opening price.
The indicator also considers a standard deviation multiplier.
This enables traders and investors to identify potential price zones.
The support and resistance levels are dynamically updated every day.
Users can also choose to view previous daily levels as well.
Customizable settings for this tool include:
-Averaging Period: Adjust the number of days to calculate the average daily range.
-Standard Deviation Multiplier: Modify the standard deviation multiplier to fine-tune the sensitivity of the support and resistance levels. A higher multiplier will result in wider levels, accommodating higher price fluctuations.
-Toggle Support & Resistance Prices: Easily switch on or off the display of support and resistance price levels.
-Show Daily Open Line: Display the daily opening price as a reference point on the chart.
-Show Previous Levels: Choose whether to display past daily support and resistance levels.
Note: this indicator works best on 5 or 15 minute charts.
Give this indicator a BOOST and COMMENT your thoughts!
We hope you enjoy.
Cheers.

Time Profile [QuantVue]The Time Profile indicator provides traders with a comprehensive view of volume and time-based price activity. The indicator combines two essential components into one indicator: the volume profile and the time profile.
The volume profile represents the distribution of trading volume at different price levels over a specified period and is displayed as a circle on the chart.
It provides a visual representation of where the majority of trading volume occurred and often highlights significant support and resistance levels. The volume profile is calculated as the closing price of the highest volume intraday bar, based on the user selected lower time frame.
On the other hand, the time profile focuses on analyzing the time spent at certain price levels. The indicator divides the current bars range into 10 blocks and counts the number of user selected lower time frame closes within each time block.
The block with the most lower time frame closes in it is deemed the time point of control. Traders can use this information to identify time blocks where price movement was most significant.
The time profile is drawn on the Y axis of the current bar to allow for an easy visualization of where price spent most of its time. Historical time profiles are also noted on previous bars with a dash marking the level.
The Time Profile indicator offers several customization options. Traders can adjust the timeframe for the lower time frame data, decide whether to display the time profile, and customize colors for visual clarity.
Additionally, traders can choose to highlight instances where the Volume POC and Time POC align, indicating a strong concentration of volume and price activity.
Don't hesitate to reach out with any questions or concerns.
We hope you enjoy!
Cheers.

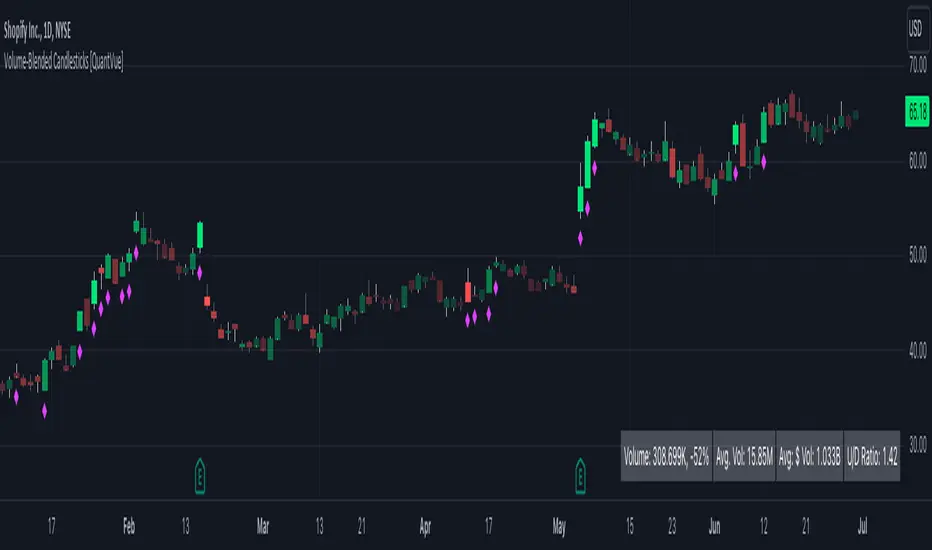
Volume-Blended Candlesticks [QuantVue]Introducing the Volume-Blended Candlestick Indicator, a powerful tool that seamlessly integrates volume information with candlesticks, providing you with a comprehensive view of market dynamics in a single glance.
The Volume-Blended Candlestick Indicator employs a unique approach of projecting volume totals by calculating the total volume traded per second and comparing it to the time left in the session as well as the historical average length selected by the user.
The indicator then dynamically adjusts the opacity of the candlestick colors based on the intensity of the projected volume. As volume intensifies, the candlestick colors become more pronounced, while low volume will cause colors to fade allowing you to visually perceive the level of buying or selling.
One of the standout features of the Volume-Blended Candlestick Indicator is its ability to identify pocket pivots. A pocket pivot is an up day with volume greater than any of the down days volume in the past 10 days. By highlighting these pocket pivots on your chart, the indicator helps you identify potential stealth accumulation.
In addition to blending volume with candlesticks and spotting pocket pivots, this versatile indicator provides you with an insightful table displaying key volume metrics. The table includes the average volume, average dollar volume, and the up-down volume ratio, allowing you to get a clear picture of buying and selling pressure.
Settings Include:
🔹Sensitivty Level: Normal, More, Less
🔹Volume MA Length
🔹Toggle Color based on previous close
🔹Show or hide volume info
🔹Chose candlestick colors
🔹Show or hide pocket pivots
🔹Show or hide volume info table
Don't hesitate to reach out with any questions or concerns.
We hope you enjoy!
Cheers.
ATR Momentum [QuantVue]ATR Momentum is a dynamic technical analysis tool designed to assess the momentum of a securities price movement. It utilizes the comparison between a faster short-term Average True Range (ATR) and a slower long-term ATR to determine whether momentum is increasing or decreasing.
This indicator visually represents the momentum relationship by plotting both ATR values as lines on a chart and applying color fill between the lines based on if momentum is increasing or decreasing.
When the short-term ATR is greater than the long-term ATR, representing increasing momentum, the area between them is filled with green.
Conversely, when the short-term ATR is less than the long-term ATR line, the area between them is filled with red. This red fill indicates decreasing momentum.
Don't hesitate to reach out with any questions or concerns.
We hope you enjoy!
Cheers.

Broadening Formations [QuantVue]Broadening formations are common chart patterns observed by technical traders. A broadening formation is formed when the volatility of an asset increases, thus expanding the range of its price resulting in higher highs and lower lows.
The Broadening Trendline indicator, works by looking for pivot points where a higher high or lower low is made compared to the previous pivot point. If a top and bottom line are detected a broadening formation is formed.
Indicator includes alerts, custom colors and styles, the ability to see previous trendlines, and notifications when a trendline is crossed.
Don't hesitate to reach out with any questions or concerns.
We hope you enjoy!
Cheers.
