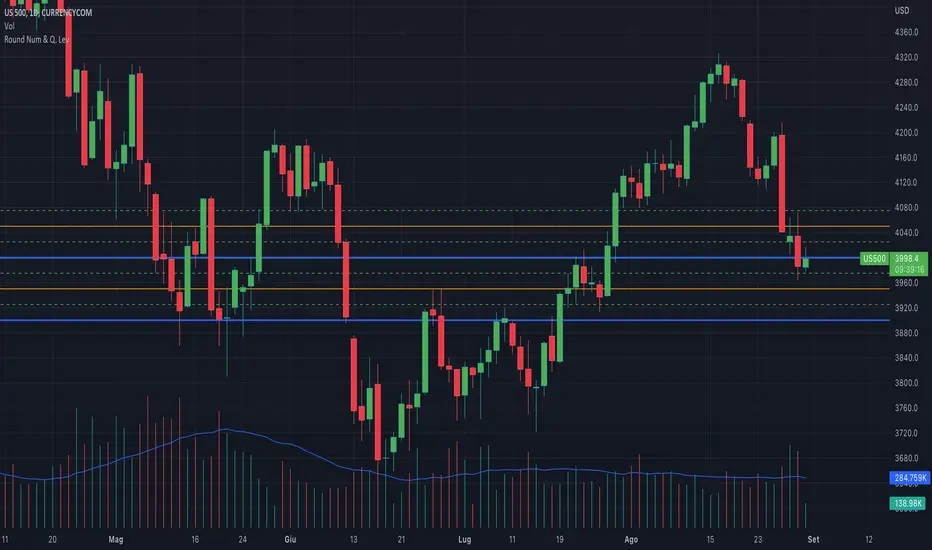
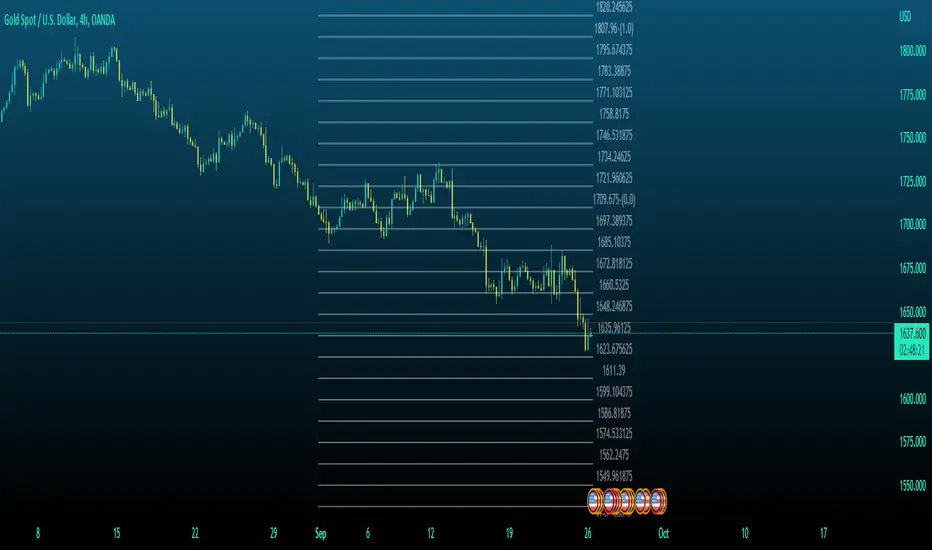
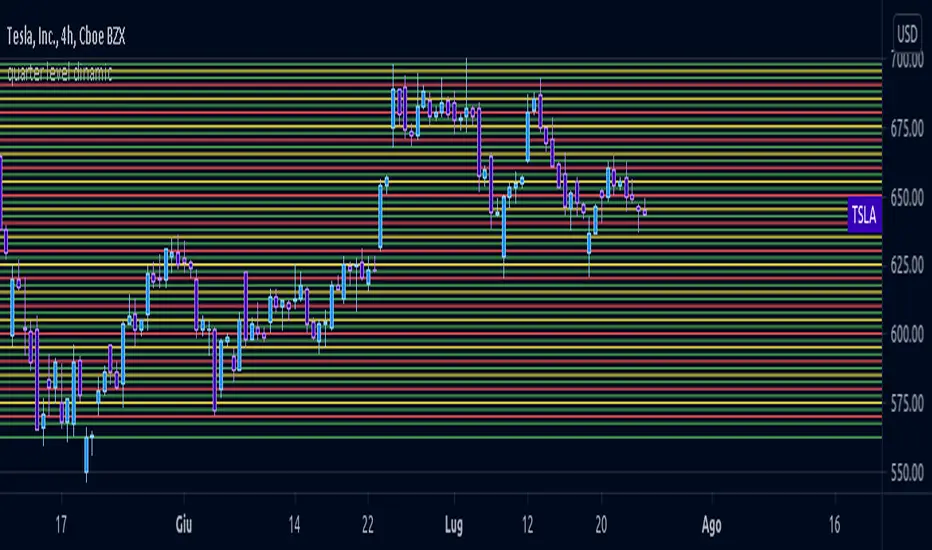
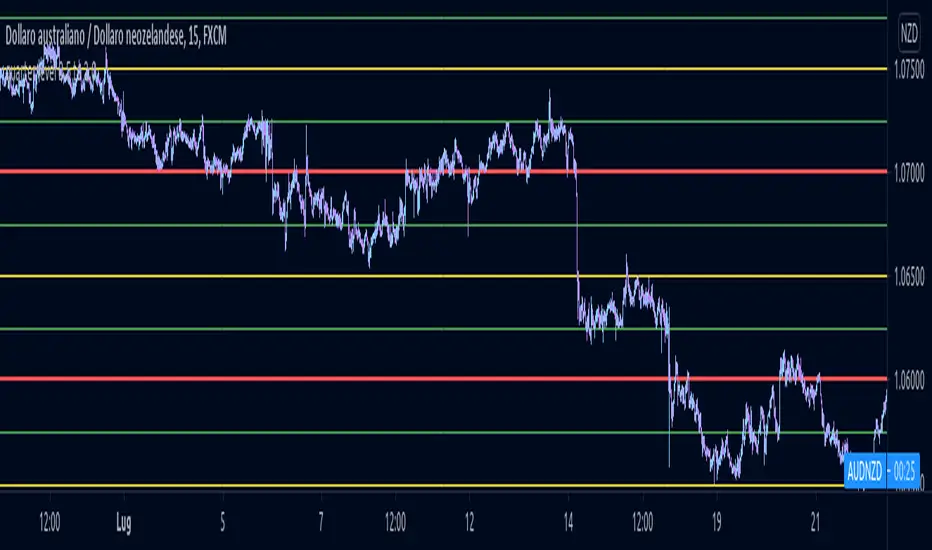
Quarterly Theory ICT 01 [TradingFinder] XAMD + Q1-Q4 Sessions🔵 Introduction
The Quarterly Theory ICT indicator is an advanced analytical system based on the concepts of ICT (Inner Circle Trader) and fractal time. It divides time into quarterly periods and accurately determines entry and exit points for trades by using the True Open as the starting point of each cycle. This system is applicable across various time frames including annual, monthly, weekly, daily, and even 90-minute sessions.
Time is divided into four quarters: in the first quarter (Q1), which is dedicated to the Accumulation phase, the market is in a consolidation state, laying the groundwork for a new trend; in the second quarter (Q2), allocated to the Manipulation phase (also known as Judas Swing), sudden price changes and false moves occur, marking the true starting point of a trend change; the third quarter (Q3) is dedicated to the Distribution phase, during which prices are broadly distributed and price volatility peaks; and the fourth quarter (Q4), corresponding to the Continuation/Reversal phase, either continues or reverses the previous trend.
By leveraging smart algorithms and technical analysis, this system identifies optimal price patterns and trading positions through the precise detection of stop-run and liquidity zones.
With the division of time into Q1 through Q4 and by incorporating key terms such as Quarterly Theory ICT, True Open, Accumulation, Manipulation (Judas Swing), Distribution, Continuation/Reversal, ICT, fractal time, smart algorithms, technical analysis, price patterns, trading positions, stop-run, and liquidity, this system enables traders to identify market trends and make informed trading decisions using real data and precise analysis.
♦ Important Note :
This indicator and the "Quarterly Theory ICT" concept have been developed based on material published in primary sources, notably the articles on Daye( traderdaye ) and Joshuuu . All copyright rights are reserved.
🔵 How to Use
The Quarterly Theory ICT strategy is built on dividing time into four distinct periods across various time frames such as annual, monthly, weekly, daily, and even 90-minute sessions. In this approach, time is segmented into four quarters, during which the phases of Accumulation, Manipulation (Judas Swing), Distribution, and Continuation/Reversal appear in a systematic and recurring manner.
The first segment (Q1) functions as the Accumulation phase, where the market consolidates and lays the foundation for future movement; the second segment (Q2) represents the Manipulation phase, during which prices experience sudden initial changes, and with the aid of the True Open concept, the real starting point of the market’s movement is determined; in the third segment (Q3), the Distribution phase takes place, where prices are widely dispersed and price volatility reaches its peak; and finally, the fourth segment (Q4) is recognized as the Continuation/Reversal phase, in which the previous trend either continues or reverses.
This strategy, by harnessing the concepts of fractal time and smart algorithms, enables precise analysis of price patterns across multiple time frames and, through the identification of key points such as stop-run and liquidity zones, assists traders in optimizing their trading positions. Utilizing real market data and dividing time into Q1 through Q4 allows for a comprehensive and multi-level technical analysis in which optimal entry and exit points are identified by comparing prices to the True Open.
Thus, by focusing on keywords like Quarterly Theory ICT, True Open, Accumulation, Manipulation, Distribution, Continuation/Reversal, ICT, fractal time, smart algorithms, technical analysis, price patterns, trading positions, stop-run, and liquidity, the Quarterly Theory ICT strategy acts as a coherent framework for predicting market trends and developing trading strategies.
🔵b]Settings
Cycle Display Mode: Determines whether the cycle is displayed on the chart or on the indicator panel.
Show Cycle: Enables or disables the display of the ranges corresponding to each quarter within the micro cycles (e.g., Q1/1, Q1/2, Q1/3, Q1/4, etc.).
Show Cycle Label: Toggles the display of textual labels for identifying the micro cycle phases (for example, Q1/1 or Q2/2).
Table Display Mode: Enables or disables the ability to display cycle information in a tabular format.
Show Table: Determines whether the table—which summarizes the phases (Q1 to Q4)—is displayed.
Show More Info: Adds additional details to the table, such as the name of the phase (Accumulation, Manipulation, Distribution, or Continuation/Reversal) or further specifics about each cycle.
🔵 Conclusion
Quarterly Theory ICT provides a fractal and recurring approach to analyzing price behavior by dividing time into four quarters (Q1, Q2, Q3, and Q4) and defining the True Open at the beginning of the second phase.
The Accumulation, Manipulation (Judas Swing), Distribution, and Continuation/Reversal phases repeat in each cycle, allowing traders to identify price patterns with greater precision across annual, monthly, weekly, daily, and even micro-level time frames.
Focusing on the True Open as the primary reference point enables faster recognition of potential trend changes and facilitates optimal management of trading positions. In summary, this strategy, based on ICT principles and fractal time concepts, offers a powerful framework for predicting future market movements, identifying optimal entry and exit points, and managing risk in various trading conditions.
Quarters
Quarter Theory LevelsQuarter Theory Levels is a script that will create level lines based on major round numbers and spilt those levels into half and quarter ranges. This tool is intended to help traders see major levels that price will likely react to in the future.
The Script is inspired by Quarters Theory.
Round Numbers and Quarter LevelsThis script is based on "Round Numbers Above and Below" by BitcoinJesus-Not-Roger-Ver, but unlike this script that only shows "Round Numbers" levels, my script also shows "Quarter Number" levels like 25 and 75 that are very important for those who follow the quarters theory.
Also the original script doesn't have different colors for different levels while my script has different colors and different styles for every level, this way it will be much easyer to recognize the levels at first sight.
Finally the origianl script only works with Forex while my script also works with indexes like SP500 and others.
Round Numbers are very important psychological levels in trading but also quarters levels (25 and 75) have a huge importance, so I created this script that shows all these levels with different colors and different lines style.
You can edit the color and the style of the lines as you wish and you can add all the levels you want.
In 1 hour chart 4 levels is usually enough but if you watch a daily chart then 8 levels is way better.
Features:
Personalize color to 00 round levels
Personalize color to 50 round levels
Personalize color to Quarters levels
Personalize line style to 00 round levels
Personalize line style to 50 round levels
Personalize line style to Quarters levels
Choose number of lines above and below price level (4 is default)
MTF High and Low FractionsMTF High and Low Fractions
Description
An experimental script that prints 1/3, 1/4 and 1/8 levels of the previous timeframe's high and low to the current timeframe. The idea is quite simple. It mirrors the the previous high and low with user selected levels. The default setting is the previous daily high and low but can be customized on user discretion.
New levels are printed after the close of the previous timeframe and open of the new timeframe (user's timeframe setting).
How To Use
Levels should not be used blindly. Levels can be used as confluence when aligned with high probability supply and demand zones, support, resistance, order blocks, and so on.
MTF previous high and low quarter levelsDescription
An experimental script that prints quarter levels of the previous timeframe's high and low to the current timeframe. The idea is quite simple and is basically the Fibonacci pivoted on the previous high and low with quarter level settings (0,0.25,0.5,0.75,1 etc). The default setting is the previous daily high and low but can be customized on user discretion.
New quarter levels are printed after the close of the previous timeframe and open of the new timeframe (user's timeframe setting)
How To Use
Levels should not be used blindly. Levels can be used as confluence when aligned with high probability supply and demand zones, support, resistance, order blocks, and so on.
Credit to @HeWhoMustNotBeNamed for the Previous High/Low MTF indicator code and @mrbirman for the idea to put this together.
quarter level dinamicLimited quarter level script but more flexible in compared to my FX script, same logic behind
quarter level 0.5 to 2.0This script could help to see edged level for a reverse on forex, not for yen pairs and is based on quarter and round number theory.
I suggest to use it on H4 timeframe or lower to have a confermation on support or resistance level.
Automated Quarters Theory With BTC and ETHThis is based on "Automatic Quarters Theory Lines" by monzakaamera. Added calculations for BTC and ETH and fixed script to work on the weekends.
PRIME-QUARTERS W-XsThis script applies both the Quaters theory for easy analysis of market structure, as well as a 50 and 800 SMA to be used in conjunction with the 4 and 21 SMA found in Prime-Pulse, to pin point sniper entries. $auceCamp
Quarters TheoryThis indicator helps you to put Quarter Theory lines on your chart. It's defaults are meant for EURUSD , but you can change it for other charts. There are 16 lines in this indicator.
For EURUSD recommended settings right now are: Starting Price (Bottom):1.12 and Gap: 0.0025
USDCAD: Starting Price (Bottom):1.315 and Gap: 0.005
EURAUD: Starting Price (Bottom):1.59 and Gap: 0.005
USDJPY: Starting Price (Bottom):107 and Gap: 0.5
USDCHF: Starting Price (Bottom):0.97 and Gap: 0.0025
BTCUSD: Starting Price (Bottom):3200 and Gap: 100
XAUUSD: Starting Price (Bottom): 1230 and Gap: 5
These settings are the ones I use, but you could find better settings for yourself.
Works very well on JPY pairs.
Quarters v2Quarters Theory v2
Quarters Theory automatically plotted for you on your chart. This theory is primary on forex pairs. Major quarters, Minor quarters, quarters, and hesitation zones all plotting. Please refer to the inputs on their color. (still having a fill issues with the hesitation zone)