Volume HistogramShows volume as Histogram, so it's still readable while RVol bars are shown behind in the same pane.
I want to see both because:
Relative volume indicates higher activity than usual
Absolute volume helps with "Volume Price Analysis"
This is meant to be used for 5m, 15m, 30m, 1w charts.
For 1d charts I recommend Volume Auto fit though, since RVol can be gigantic there sometimes.
RDT

RDT Buy/Sell Signals Scalp 1MExit alerts for scalps for the 1m chart.
An alert is triggered, if a 1m candle ended and a 3/8 EMA cross was created in the according direction (depending on whether Long or Short Exit alert is set).
Entry alerts basically work the same. I've never ever used them so far though, since it never made sense the way I trade.
More infos: www.reddit.com

15/30M Alerts"X Candle Close":
Same as in 5m Enter alert: it's really helpful to wait for a 15m/30m candle to be confirmed, to see f. e. whether a candle really broke a support / resistance or not - and to prevent making bad decisions.
More infos: www.reddit.com

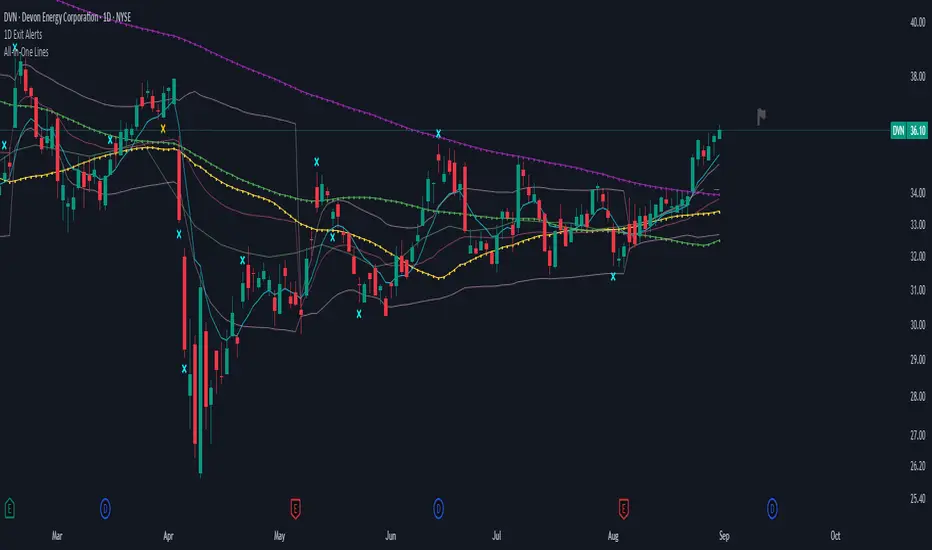
1D Exit Alerts"A Daily Exit LONG" + "B Daily Exit SHORT":
I'm not using this one anymore since they often make me worry more than necessary, and I focus more on aiming to reach specific price targets, or using the 5m Exit alerts instead.
Also swing trades require less time-sensitive operations than day trades, so for me personally they felt a bit redundant.
But maybe it helps some of you:
There are 4 conditions that trigger it. As with 5m Exit Alerts, the triggering reasons show up in the exit alert message (unfortunately only as a number, since alert messages can't have "dynamic text" in TradingView).
Here are the conditions sorted from best to worst:
Gap Up / Down. Better check SPY and the stock whether a Gap Reversal is likely to happen (aka get out) or whether the stock will keep going higher / lower.
Earnings: End of day or Tomorrow morning. Alert is triggered at beginning of morning before earnings, and then again 15m before market close.
Mental stop loss: Broke daily EMA 8 or SMA - in the wrong direction....
Wrong direction: Broke below / above yesterday's Low / High. It's not immediately triggered, but only after re-touching VWAP again, to prevent too impulsive exits.
As with 5m Exit alerts: Always consider how the market and stock looks like, then decide whether to exit or not! These are meant to make you look at the chart, not to FOMO-exit.
"X Candle Close":
Same as in 1D Enter alert: Is triggered 15m before market close (I put it in here as well because I kept forgetting whether I put this one into Enter or Exit alerts...)
More infos: www.reddit.com
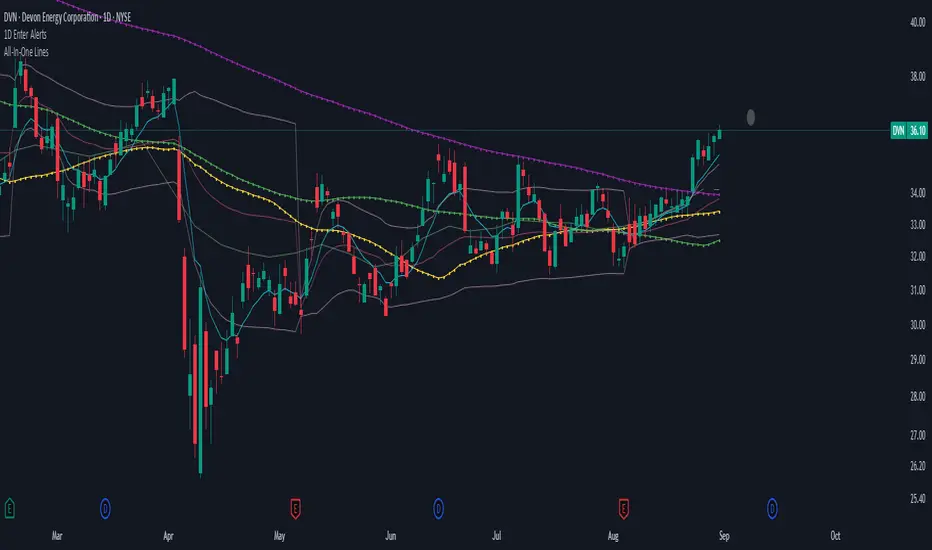
1D Enter AlertsThis is only a remaining of an experiment. I had real swing enter alerts, but it just made more sense to use classic TradingView alerts for horizontal / trendline / SMA breaks.
(Btw you can set up a horizontal alert in TradingView just by hovering the mouse on the chart so it's at the price point you aim for, and pressing "Alt + A").
Once this horizontal alert triggered I would usually wait for confirmation of the move on the 5m. If it's f. e. a break of an SMA and I'm not convinced yet, I might wait until end of the day. For exactly that purpose the following alert comes in handy:
"X Candle Close":
Is triggered 15m before market close - good reminder to check a stock again to see whether a resistance / support break was valid - and the stock should be entered as a swing, or maybe whether it should be closed as a loss.
"Z Trend Change: UP" + "Z Trend Change: DOWN":
Same as on 5m Exit Alert: meant to be only applied on SPY, and to have it set up to never end!
Criteria:
SPY broke through daily EMA 8 or daily SMA today, indicating an important short-term change on the daily chart.
Is triggered 15m before market close
More infos: www.reddit.com
5m Exit AlertsThese can help a lot with Daytrading if you don't have a price target in mind when there's no clear resistance / support nearby, and you don't trust the market enough to hold it as a swing trade.
Keep in mind that its main purpose is to give you a "warning" that it might be good to look at your screen, instead of guaranteeing you "now is the best time to exit". You won't reach high winning stats by blindly following this alert.
"A Exit LONG":
(I'm using letters instead of numbers for all Exit alerts to make sure I don't accidentally confuse Enter and Exit alerts).
There are 4 conditions that might trigger it. The reasons show up in the exit alert message (unfortunately only as a number, since alert messages can't have "dynamic text" in TradingView), and can also be displayed as symbols in the chart (see image above - make sure to enable "Show Signals" in the indicator settings first though).
Here are the conditions sorted from best to worst:
Technical reversal: Bearish Hammer candle with Volume > 2 * avg volume (of last 30 candles), when 5m candle closed. Reversal very likely. This is usually the best time to take your gains for the rest of the day.
EMA 3/8 cross: standard 5m EMA 3/8 cross, indicating a trend reversal, or at least a pullback. Can also be helpful to detect double tops / double bottoms.
Trailing Stop Loss: Crossed below 30m EMA 8, 5m candle closed. This is a "fallback" alert in case EMA 3 was already below EMA 8 before you set up the alert. It's not unlikely that the stock might go further down to VWAP, so depending on the chart and market this might be a good opportunity to save the gains you have left.
"Final" Stop Loss: Crossed below VWAP. Usually not a good sign. If you entered around VWAP your losses shouldn't be big yet, but if you plan on holding the stock the Daily chart and market outlook should better be quite convincing, and you wouldn't have needed to use this alert in the first place.
Keep in mind these work of course best if you picked a "good" stock: clear movement, tidy price action, high volume. Otherwise alerts are more likely to be triggered redundantly.
Always consider how the market and stock looks like, then decide whether to exit or not! Usually it makes sense to wait a bit to see f. e. whether the stock bounces off the 30m EMA 8, and it's just a pullback.
"B Enter SHORT":
Similar, but for shorts...
"C 1m Scalp LONG" + "D 1m Scalp SHORT":
Simple Scalping alert for EMA 3/8 cross on a 1m chart - but without needing to use a 1m chart to set it up!
Unfortunately it's not as accurate as manually setting this alert up on a 1m chart. It might be an advantage though that it sometimes is triggered 1-2 min later, since this means there are less redundant triggerings.
It can be useful esp. on high momentum trades, but I honestly haven't used it in a looong while.
"X Candle Close":
same as in 5m Entry indicator: triggered when 5m candle is confirmed
"Z Trend Change: UP" + "Z Trend Change: DOWN":
This one is meant to be used only on SPY: It alerts you when SPY is changing its trending direction, which might mean entering or closing existing trades.
I have therefore set it up to never end (by setting it to "Once Per Bar Close" in the alert settings).
It's based on DMI positive or negative being > 25. I had it based on VWAP at the beginning, but there were days where it was triggered every 5 minutes...
More infos: www.reddit.com

5m Enter AlertsThese alerts work really well to help you find good entries on the 5m chart:
"1 Enter LONG":
This one I use more often than any other alert. It's really great if the stock looks good but is currently overextended on the 5m, or looks like it's starting to pull back. It's triggered right after the stock pulled back to the VWAP or 15m EMA 8 and is about to continue.
All these criteria need to be met for the alert to be triggered on a VWAP pullback:
Crossed up VWAP or VWAP + half ATR recently (so it's also triggered even if it doesn't cross below VWAP on a pullback)
Above 5m EMA 8 (since this indicates it will likely continue higher up)
Closed above highest High of last 3 candles (to prevent premature alerts while the price started pulling back into the range of VWAP + half ATR)
Candle is confirmed (5m ended)
For the 15m EMA 8 pullback it's the same, except for that the 15m EMA 8 also still needs to be above VWAP (otherwise you wouldn't want to enter yet anyways).
"2 Enter SHORT":
Similar, but for shorts...
"3 High Volume Candle":
Detects High Volume Candles on the 5m chart. Can be helpful to get informed that a resistance / support finally broke on high volume, or to be notified about a potential reversal. Can therefore also be useful if applied on SPY.
Criteria:
Candle's volume > 1.2 * avg volume (of last 30 candles)
"X Candle Close":
This one I use quite often as well: it's really helpful to wait for a 5m candle to be confirmed, to see f. e. whether a candle really broke a support / resistance or not - and to prevent making bad decisions.
Criteria:
5m candle closed
More infos: www.reddit.com

Algo + Trendlines :: Medium PeriodThis indicator helps me to avoid overlooking Trendlines / Algolines. So far it doesn't search explicitly for Algolines (I don't consider volume at all), but it's definitely now already not horribly bad.
These are meant to be used on logarithmic charts btw! The lines would be displayed wrong on linear charts.
The biggest challenge is that there are some technical restrictions in TradingView, f. e. a script stops executing if a for-loop would take longer than 0.5 sec.
So in order to circumvent this and still be able to consider as many candles from the past as possible, I've created multiple versions for different purposes that I use like this:
Algo + Trendlines :: Medium Period : This script looks for "temporary highs / lows" (meaning the bar before and after has lower highs / lows) on the daily chart, connects them and shows the 5 ones that are the closest to the current price (=most relevant). This one is good to find trendlines more thoroughly, but only up to 4 years ago.
Algo + Trendlines :: Long Period : This version looks instead at the weekly charts for "temporary highs / lows" and finds out which days caused these highs / lows and connects them, Taking data from the weekly chart means fewer data points to check whether a trendline is broken, which allows to detect trendlines from up to 12 years ago! Therefore it misses some trendlines. Personally I prefer this one with "Only Confirmed" set to true to really show only the most relevant lines. This means at least 3 candle highs / lows touched the line. These are more likely stronger resistance / support lines compared to those that have been touched only twice.
Very important: sometimes you might see dotted lines that suddenly stop after a few months (after 100 bars to be precise). This indicates you need to zoom further out for TradingView to be able to load the full line. Unfortunately TradingView doesn't render lines if the starting point was too long ago, so this is my workaround. This is also the script's biggest advantage: showing you lines that you might have missed otherwise since the starting bars were outside of the screen, and required you to scroll f. e back to 2015..
One more thing to know:
Weak colored line = only 2 "collision" points with candle highs/lows (= not confirmed)
Usual colored line = 3+ "collision" points (= confirmed)
Make sure to move this indicator above the ticker in the Object Tree, so that it is drawn on top of the ticker's candles!
More infos: www.reddit.com

Algo + Trendlines :: Long PeriodThis indicator helps me to avoid overlooking Trendlines / Algolines. So far it doesn't search explicitly for Algolines (I don't consider volume at all), but it's definitely now already not horribly bad.
These are meant to be used on logarithmic charts btw! The lines would be displayed wrong on linear charts.
The biggest challenge is that there are some technical restrictions in TradingView, f. e. a script stops executing if a for-loop would take longer than 0.5 sec.
So in order to circumvent this and still be able to consider as many candles from the past as possible, I've created multiple versions for different purposes that I use like this:
Algo + Trendlines :: Medium Period : This script looks for "temporary highs / lows" (meaning the bar before and after has lower highs / lows) on the daily chart, connects them and shows the 5 ones that are the closest to the current price (=most relevant). This one is good to find trendlines more thoroughly, but only up to 4 years ago.
Algo + Trendlines :: Long Period : This version looks instead at the weekly charts for "temporary highs / lows" and finds out which days caused these highs / lows and connects them, Taking data from the weekly chart means fewer data points to check whether a trendline is broken, which allows to detect trendlines from up to 12 years ago! Therefore it misses some trendlines. Personally I prefer this one with "Only Confirmed" set to true to really show only the most relevant lines. This means at least 3 candle highs / lows touched the line. These are more likely stronger resistance / support lines compared to those that have been touched only twice.
Very important: sometimes you might see dotted lines that suddenly stop after a few months (after 100 bars to be precise). This indicates you need to zoom further out for TradingView to be able to load the full line. Unfortunately TradingView doesn't render lines if the starting point was too long ago, so this is my workaround. This is also the script's biggest advantage: showing you lines that you might have missed otherwise since the starting bars were outside of the screen, and required you to scroll f. e back to 2015..
One more thing to know:
Weak colored line = only 2 "collision" points with candle highs/lows (= not confirmed)
Usual colored line = 3+ "collision" points (= confirmed)
Make sure to move this indicator above the ticker in the Object Tree, so that it is drawn on top of the ticker's candles!
More infos: www.reddit.com

Volume Auto FitThis does nothing more than decreasing the size of (absolute) volume candles a bit, in order to allow showing candles with "Absolute" volume and Relative volume inside of the same panel - to save space.
I want to see both because:
Relative volume indicates higher activity than usual
Absolute volume helps with "Volume Price Analysis"
On the 5m you don't need "Volume Auto fit", but can just use usual "Volume" and it will look fine.
For the 1D I've created this one though, since RVol can be gigantic there sometimes.

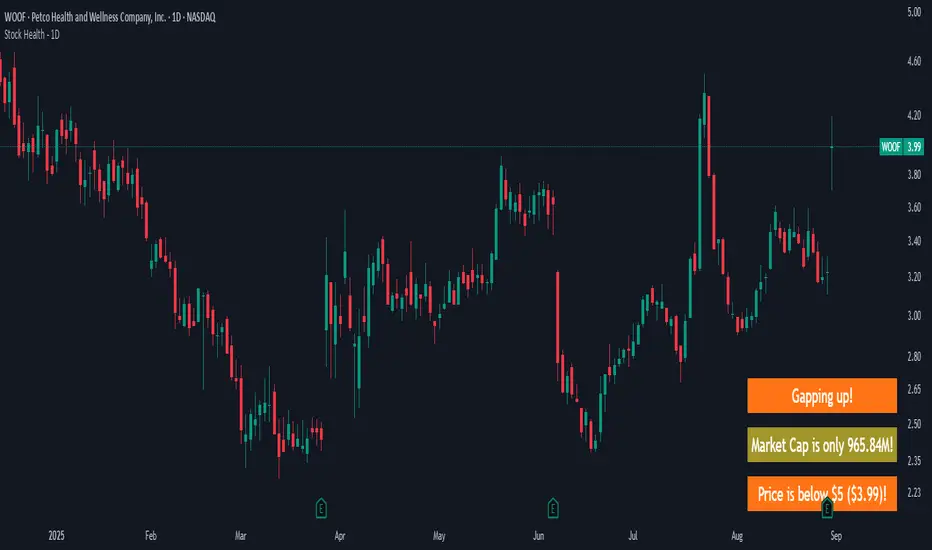
Stock Health - 1DWarns you if you look at a "bad" stock, meaning:
Market cap is < 1B (and more intrusive warning if < 500M)
Price is < 10$ (more intrusive if < 5$)
Yesterday's Daily Volume was < 1M (more instrusive if < 500K)
There are earnings end of the day / tomorrow morning
There's a Gap up/down - because I likely shouldn't jump in already but see how it develops
Meant to be used on a 1D chart.
More infos: www.reddit.com
Stock Health - 5mWarns if you are about to trade before 45 min passed since market open.
Good reminder if you are impatient / have ADHD...
Meant to be used on a 5m chart.
More infos: www.reddit.com

PT FinderThis is mostly helpful to find potential price targets for Daytrades on the daily chart (if stronger resistances / supports are too far away).
Shows highs / lows of nearby "pivot" candles (higher high / lower low than both candles around) - depending on expected trade direction. Based on my experience these can be potential (albeit weak) resistance / support.
If it shows values only in the wrong trade direction: set a checkmark at "Invert bullish / bearish price targets" in the indicator settings
Also shows the ADR (blue line = yesterday's close MINUS Average Day Range) - which is helpful for Daytrades to see what price movement you could potentially expect for the day!
As a nice bonus it also shows gaps as yellow areas - in case you maybe missed them because you zoomed in / out too much on your daily chart.
More infos: www.reddit.com

High Volume Candles - RVolInspired by Key bars from Option Stalker Pro.
This one is meant to be used on charts where the interval is >=1D.
Highlights candles where RVol is > 1.2.
Helps to not accidentally miss that a candle move happened on high volume (or that it did not happen on high volume...), like potential reversals or resistance/support breaks.
Make sure to move this indicator above the ticker in the Object Tree, so that it is drawn on top of the ticker's candles.
More infos: www.reddit.com

High Volume CandlesInspired by Key bars from Option Stalker Pro.
This one is meant to be used on charts where the interval is <1D.
Highlights candles in chart with Volume > 1.4 * last 30 candles average volume.
Helps to not accidentally miss that a candle move happened on high volume (or that it did not happen on high volume...), like potential reversals or resistance/support breaks.
Make sure to move this indicator above the ticker in the Object Tree, so that it is drawn on top of the ticker's candles.
More infos: www.reddit.com

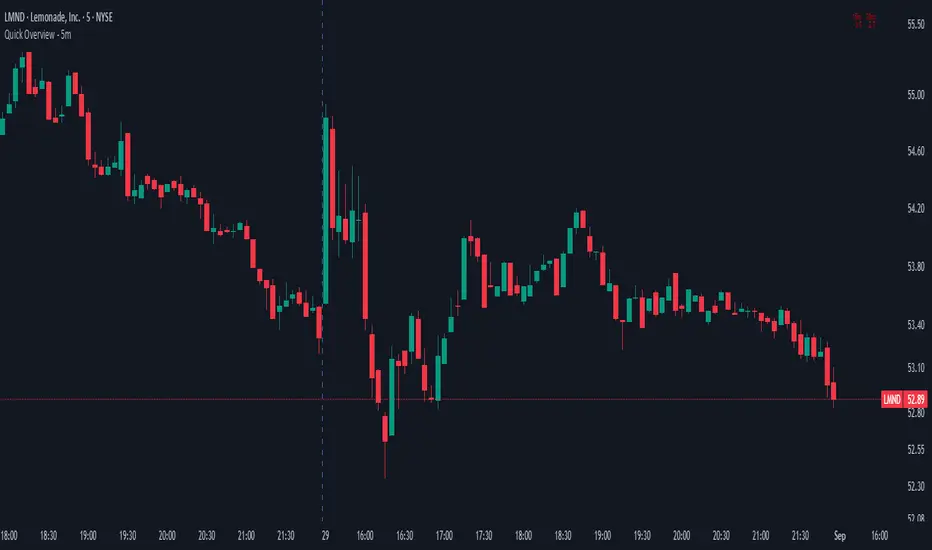
Quick Overview - 1DInspired by Option Stalker Pro, it shows RS/RW on 1W.
Meant to be used on the 1D chart.
Also shows ATH / ATL - depending on what is closer. Which is great to be aware that you should zoom out more to make sure you don't miss out algolines or support / resistance lines!
Also if the stock is currently at ATH / ATL, this means it might be a low-risk stock pick.
More infos: www.reddit.com

Quick Overview - 5mInspired by Option Stalker Pro, it shows RS/RW on 15m and 30m.
Meant to be used on the 5m chart.
Ideally you want to have RS/RW on as many time scales as possible!
More infos: www.reddit.com
RVol - Time-based relative volumeImportant to see whether the stock has significantly more activity than usual.
Alternatively you can use TradingView's built-in "Relative Volume At Time" indicator (anchor timeframe: 1 day, length: 10, calculation mode: cumulative, adjust unconfirmed: true), which is essentially the same - without the colorizing of the bars.
More infos: www.reddit.com

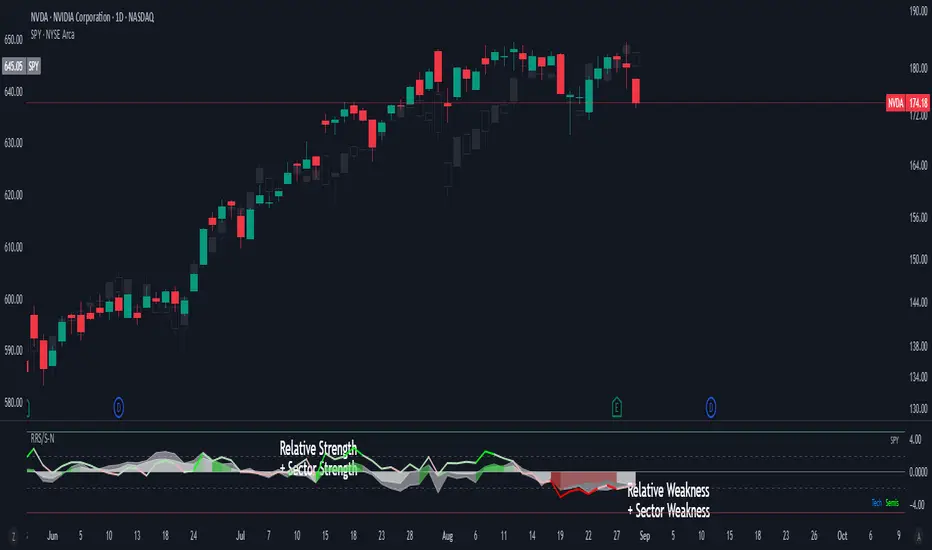
Real Relative Sector Strength - NormalizedShows RS/RW, which is esp. helpful if it's not fully clear based on the stock's chart movement compared to SPY's movement.
"Glowing green" = safely strong
"Glowing red" = safely weak
More infos: www.reddit.com
All-In-One LinesIt's like a "torch in the darkness" that shows the "terrain" in which you are trading, and in which the candle movement unfolds.
It is meant to be used on 5m + 1D intervals. Additionally useful on 15m, 30m, and 1W if you use these.
Shows:
VWAP (on < 1D interval)
EMA 8 from 5m/15m/30m/1D/1W
Yesterday's High (on < 1D interval)
Yesterday's Low (on < 1D interval)
SMA 50/100/200
AVWAPE / AVWAPQ (if SPY) incl. +1/-1 Stdev for each
More infos: www.reddit.com
