Ichimoku Crosses_RSI_AITIchimoku Crosser_RSI_AIT
Overview
The "Ichimoku Cloud Crosses_AIT" strategy is a technical trading strategy that combines the Ichimoku Cloud components with the Relative Strength Index (RSI) to generate trade signals. This strategy leverages the crossovers of the Tenkan-sen and Kijun-sen lines of the Ichimoku Cloud, along with RSI levels, to identify potential entry and exit points for long and short trades. This guide explains the strategy components, conditions, and how to use it effectively in your trading.
1. Strategy Parameters
User Inputs
Tenkan-sen Period (tenkanLength): Default value is 21. This is the period used to calculate the Tenkan-sen line (conversion line) of the Ichimoku Cloud.
Kijun-sen Period (kijunLength): Default value is 120. This is the period used to calculate the Kijun-sen line (base line) of the Ichimoku Cloud.
Senkou Span B Period (senkouBLength): Default value is 52. This is the period used to calculate the Senkou Span B line (leading span B) of the Ichimoku Cloud.
RSI Period (rsiLength): Default value is 14. This period is used to calculate the Relative Strength Index (RSI).
RSI Long Entry Level (rsiLongLevel): Default value is 60. This level indicates the minimum RSI value for a long entry signal.
RSI Short Entry Level (rsiShortLevel): Default value is 40. This level indicates the maximum RSI value for a short entry signal.
2. Strategy Components
Ichimoku Cloud
Tenkan-sen: A short-term trend indicator calculated as the simple moving average (SMA) of the highest high and the lowest low over the Tenkan-sen period.
Kijun-sen: A medium-term trend indicator calculated as the SMA of the highest high and the lowest low over the Kijun-sen period.
Senkou Span A: Calculated as the average of the Tenkan-sen and Kijun-sen, plotted 26 periods ahead.
Senkou Span B: Calculated as the SMA of the highest high and lowest low over the Senkou Span B period, plotted 26 periods ahead.
Chikou Span: The closing price plotted 26 periods behind.
Relative Strength Index (RSI)
RSI: A momentum oscillator that measures the speed and change of price movements. It ranges from 0 to 100 and is used to identify overbought or oversold conditions.
3. Entry and Exit Conditions
Entry Conditions
Long Entry:
The Tenkan-sen crosses above the Kijun-sen (bullish crossover).
The RSI value is greater than or equal to the rsiLongLevel.
Short Entry:
The Tenkan-sen crosses below the Kijun-sen (bearish crossover).
The RSI value is less than or equal to the rsiShortLevel.
Exit Conditions
Exit Long Position: The Tenkan-sen crosses below the Kijun-sen.
Exit Short Position: The Tenkan-sen crosses above the Kijun-sen.
4. Visual Representation
Tenkan-sen Line: Plotted on the chart. The color changes based on its relation to the Kijun-sen (green if above, red if below) and is displayed with a line width of 2.
Kijun-sen Line: Plotted as a white line with a line width of 1.
Entry Arrows:
Long Entry: Displayed as a yellow triangle below the bar.
Short Entry: Displayed as a fuchsia triangle above the bar.
5. How to Use
Apply the Strategy: Apply the "Ichimoku Cloud Crosses_AIT" strategy to your chart in TradingView.
Configure Parameters: Adjust the strategy parameters (Tenkan-sen, Kijun-sen, Senkou Span B, and RSI settings) according to your trading preferences.
Interpret the Signals:
Long Entry: A yellow triangle appears below the bar when a long entry signal is generated.
Short Entry: A fuchsia triangle appears above the bar when a short entry signal is generated.
Monitor Open Positions: The strategy automatically exits positions based on the defined conditions.
Backtesting and Live Trading: Use the strategy for backtesting and live trading. Adjust risk management settings in the strategy properties as needed.
Conclusion
The "Ichimoku Cloud Crosses_AIT" strategy uses Ichimoku Cloud crossovers and RSI to generate trading signals. This strategy aims to capture market trends and potential reversals, providing a structured way to enter and exit trades. Make sure to backtest and optimize the strategy parameters to suit your trading style and market conditions before using it in a live trading environment.
Comparaison de force relative

Minervini Pullback Strategy_Trend-Template QualifierGeneral Description and Unique Features of this Script
Introducing the ultimate trend-following (long-only) strategy that offers a unique feature you won't find anywhere else!
1. Our script/strategy utilizes Mark Minervini's Trend-Template as a qualifier for identifying stocks and other financial securities in confirmed uptrends. Mark Minervini, a 3x US Investment Champion, developed the Trend-Template, which covers eight different and independent characteristics that can be adjusted and optimized in this trend-following strategy to ensure the best results. The strategy will only trigger buy-signals in case the optimized qualifiers are being met.
2. Our strategy is based on supply/demand balance in the market, making it timeless and effective across all timeframes. Whether you're day trading using 1- or 5-min charts or swing-trading using daily charts, this strategy can be applied and works very well.
3. We also incorporate technical indicators such as RSI and MACD to identify low-risk pullback entries in the context of confirmed uptrends. By doing so, the risk profile of this strategy and drawdowns are being reduced to an absolute minimum, giving you peace of mind while trading.
Minervini’s Trend-Template and the ‘Stage-Analysis’ of the Markets
This strategy is a so-called 'long-only' strategy. This means that we only take long positions, short positions are not considered.
The best market environment for such strategies are periods of stable upward trends in the so-called stage 2 - uptrend.
In stable upward trends, we increase our market exposure and risk.
In sideways markets and downward trends or bear markets, we reduce our exposure very quickly or go 100% to cash and wait for the markets to recover and improve. This allows us to avoid major losses and drawdowns.
This simple rule gives us a significant advantage over most undisciplined traders and amateurs!
'The Trend is your Friend'. This is a very old but true quote.
What's behind it???
• 98% of stocks made their biggest gains in a Phase 2 upward trend.
• If a stock is in a stable uptrend, this is evidence that larger institutions are buying the stock sustainably.
• By focusing on stocks that are in a stable uptrend, the chances of profit are significantly increased.
• In a stable uptrend, investors know exactly what to expect from further price developments. This makes it possible to locate low-risk entry points.
The goal is not to buy at the lowest price – the goal is to buy at the right price!
Each stock goes through the same maturity cycle – it starts at stage 1 and ends at stage 4
Stage 1 – Neglect Phase – Consolidation
Stage 2 – Progressive Phase – Accumulation
Stage 3 – Topping Phase – Distribution
Stage 4 – Downtrend – Capitulation
This strategy focuses on identifying stocks in confirmed stage 2 uptrends. This in itself gives us an advantage over long-term investors and less professional traders.
By focusing on stocks in a stage 2 uptrend, we avoid losses in downtrends (stage 4) or less profitable consolidation phases (stages 1 and 3). We are fully invested and put our money to work for us, and we are fully invested when stocks are in their stage 2 uptrends.
But how can we use technical chart analysis to find stocks that are in a stable stage 2 uptrend?
Mark Minervini has developed the so-called 'trend template' for this purpose. This is an essential part of our JS-TechTrading pullback strategy. For our watchlists, only those individual values that meet the tough requirements of Minervini's trend template are eligible.
The Trend Template
• 200d MA increasing over a period of at least 1 month, better 4-5 months or longer
• 150d MA above 200d MA
• 50d MA above 150d MA and 200d MA
• Course above 50d MA, 150d MA and 200d MA
• Ideally, the 50d MA is increasing over at least 1 month
• Price at least 25% above the 52w low
• Price within 25% of 52w high
• High relative strength according to IBD.
We have developed an algorythm (for TradingView) that uses Minervini’s trend template as a qualifier. This means that the strategy only generates trading signals in case the selected elements of the trend template are being met. The user is fully flexible to adjust the requirements of this Trend-Template qualifier:
This strategy is normally applied to the daily chart ideal for selecting individual stocks for trend-following strategies. Nevertheless, Minervini’s principles are timeless and this alogrithmic strategy with the Trend-Template qualifier can also be applied to any other timframe.
The qualifier #9 (RS-Ratings) can be modified and optimized in the strategy’s settings to fit your individual needs.
In general, it should be noted that ideally all 8/8 trend template criteria are met. Stocks or other securities that meet only some of these 8 criteria can also be very promising candidates for this strategy, provided that backtesting yields good results.
The Pullback Strategy
For the JS-TechTrading pullback strategy, only stocks and other financial instruments that meet the selected criteria of Mark Minervini's trend template are considered. If not, the strategy will not generate any signals.
Further prerequisites for generating a buy signal is that the individual value is in a short-term oversold state (RSI).
When the selling pressure is over and the continuation of the uptrend can be confirmed by the MACD after reaching a price low, a buy signal is issued by the pullback strategy.
Stop-loss limits and profit targets can be set variably.
Relative Strength Index (RSI)
The Relative Strength Index (RSI) is a technical indicator developed by Welles Wilder in 1978. The RSI is used to perform a market value analysis and identify the strength of a trend as well as overbought and oversold conditions. The indicator is calculated on a scale from 0 to 100 and shows how much an asset has risen or fallen relative to its own price in recent periods.
The RSI is calculated as the ratio of average profits to average losses over a certain period of time. A high value of the RSI indicates an overbought situation, while a low value indicates an oversold situation. Typically, a value > 70 is considered an overbought threshold and a value < 30 is considered an oversold threshold. A value above 70 signals that a single value may be overvalued and a decrease in price is likely , while a value below 30 signals that a single value may be undervalued and an increase in price is likely.
For example, let's say you're watching a stock XYZ. After a prolonged falling movement, the RSI value of this stock has fallen to 26. This means that the stock is oversold and that it is time for a potential recovery. Therefore, a trader might decide to buy this stock in the hope that it will rise again soon.
Moving Average Convergence Divergence (MACD)
The MACD (Moving Average Convergence Divergence) is a technical indicator used in both short-term and long-term trading strategies. The indicator was developed by Gerald Appel and is one of the most well-known indicators for the stock market.
The MACD consists of two lines calculated by the difference between two moving averages. The first line is a fast moving average that targets a short period of time. The second line is a slow moving average that targets a longer period of time. In addition, a trigger line is calculated, which consists of another moving average of the MACD line.
The MACD line is the difference between the fast and slow moving average.
The greater the difference between the two lines, the more likely a subsequent price increase. The lower the difference, the more likely a subsequent price drop is.
If the MACD line crosses upwards over the trigger line, this is a buy signal that signals a potential price increase. If the MACD line crosses down below the trigger line, this is a sell signal that signals a potential price weakening.
This strategy is applicable to all timeframes and the relevant parameters for the underlying indicators (RSI and MACD) can be adjusted and optimized as needed.
Backtesting
Backtesting give outstanding results on all timeframes and drawdowns can be reduced to a minimum level. Swing-Traders (daily charts) will see that the strategy does not give any buy signals during market corrections and bear markets.
Settings for backtesting are:
- Period from Jan 2000 until now
- Starting capital 100k USD
- Position size = 25% of equity
- 0.01% commission = USD 2.50.- per Trade
Other comments
• This strategy has been designed to identify the most promising, highest probability entries and trades for each stock or other financial security.
• The trend-template qualifier is highly selective and filters out the most promising swing-trading entries. As a result, you will normally only find a single-digit number of trades for each stock or other financial security per year in case you apply this strategy for the daily charts. Shorter timeframes will result in a higher number of trades / year.
• As a result, traders need to apply this strategy for a full watchlist rather than just one financial security.

Market First - Relative Strength/Weakness (the ZenBot strategy)This market-first trading strategy gives BUY, SHORT, and CLOSE signals based on volume, trend, and relative strength or weakness to the market (SPY by default, can be customized). This indicator is useful for signaling day-trade entries and exits for tickers that are strong (or weak) against the market.
Stocks that are showing relative strength (or weakness) to the market, are trending, and have decent movement generate a buy (or short) signal. When the trend runs out, a CLOSE signal is fired.
Potential profit (based on ATR) and actual profit is calculated, predicting the type of move expected
Unique 'stay in trade' logic helps prevent unnecessary CLOSE signals if a trend is likely to continue
A colored plot indicates the strength of the current trend and turns orange/red when the strength is weakened.
Crypto traders can uncheck 'Trade during market hours' for 24-hour trading, and should change the comparison ticker from SPY to BTCUSD or something similar for their market.
Enjoy!
KEY CONCEPTS
The three- and five-minute timeframes are used to establish and verify trend ( ADX /DI with custom logic)
Entries and exits are based on Parabolic SAR and confirmed on multiple timeframes, trend, and relative volume
Relative strength /weakness to the market compares ticker to SPY
Chop is avoided at all costs. I've experimented with choppiness indicator below 38, but found that the ADX DI+/- readings work even better.
Trend is established using ADX DI+/- readings over 20, confirmed by EMA 5/13 crossover and EMA5 slope
Signals will fire only if the average volume for the current 5-min bar is above normal
Only tickers with a five-bar / 13 period ATR of 1% the ticker's price generate signal.
Only longs above daily-anchored VWAP , shorts below daily-anchored VWAP
Signals fire on bar close to prevent repainting / look-ahead bias
Indicator labels and alerts generated
SIGNALS
BUY: up-trending tickers showing relative strength are bought on the three-minute PSAR
SELL: when the close price falls below the 1, 3, and 5-minute PSAR, or the ADX DI- falls below 20
SHORT: down-trending tickers with relative weakness are shorted on the three-minute PSAR
COVER: when the close price moves above the 1, 3, and 5-minute PSAR, or the ADX DI- falls below 20
ALERTS
Alerts are generated on BUY, SELL, SHORT, and COVER signals, as well as optional LOST RELATIVE STRENGTH and LOST RELATIVE WEAKNESS
INPUTS
Use relative strength /weakness comparison with the market : trigger trades based on the ticker's strength or weakness to the selected comparison ticker (usually SPY for equities or BTCUSD for crypto)
[* ]Comparison Ticker for relative strength /weakness : Ticker to compare against for relative strength /weakness
Trade during market hours only : Take buy/sells during specified hours. Disable this for crypto trading.
[* ]Market hours (market time) : Customize market hours - defaults to 9:30 to 16:00 EST
[* ]"Only trade very strong trends" : take trades only if an established trend is very strong ( ADX over 40 ) (DEFAULT = ON)
"Limit trade direction to VWAP" : Long trades only above VWAP , shorts below (DEFAULT = ON)
"Limit trade direction to Market direction" : Long trades only if SPY (or selected comparison ticker) is up, shorts if the market is down. (DEFAULT= ON)
"Limit trades based on a ticker's green/red status for the day" : Long trades if the ticker is green for the day, shorts if red. (DEFAULT = ON)

CCI + EMA with RSI Cross StrategyThis strategy uses the CCI + 2 RSIs + 2 EMAs to generate trade signals. Trades are only taken during the normal trading session and all open trades are closed 15 min before the close of the current session. A trailing stop loss is used and is customizable.
Not trading advice, use at your own risk.

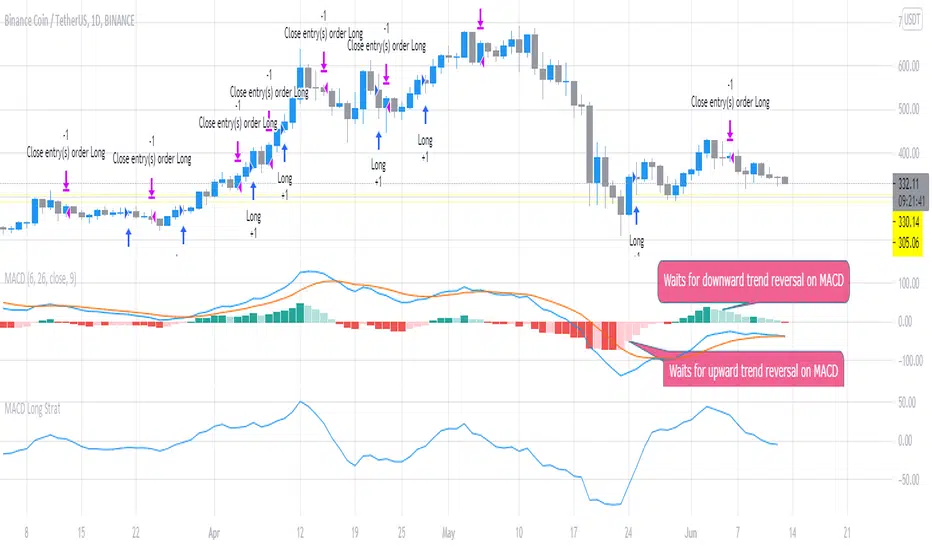
MACD Long StratFirst script I've written, but the concept is pretty simple. This uses the MACD with settings fast_SMA = 6 and slow SMA=16 and uses the distance between the 2 (histogram) to look for potential trend reversals to flag potential entries for Long trades. It waits for the confirmation looking backward 2 x timeframes (to reduce false calls slightly). You can adjust it to open / close quicker (1 timeframe instread of 2) but backtesting shows 2 timeframe delay is best to avoid false signals.
The script suggests Long entry points based on this criteria and uses the converse (reducing histogram / SMA difference delayed by 2 timeframes) to suggest exit or trade close points for downward reversal. It was originally written looking at 1m scalps but backtesting shows this is even more effective on higher timeframes (1D).
Bollinger DCA v1Simple "benchmark" strategy for ETFs, Stocks and Crypto! Super-easy to implement for beginners, a BTD (buy-the-dip) strategy means that you buy a fixed amount of an ETF / Stock / Crypto every time it falls. For instance, to BTD the S&P 500 ( SPY ), you could purchase $500 USD each time the price falls. Assuming the macro-economic conditions of the underlying country remain favourable, BTD strategies will result in capital gains over a period of many years, e.g. 10 years.
Recommended Chart Settings:
Asset Class: ETF / Stocks / Crypto
Time Frame: H1 (Hourly) / D1 (Daily) / W1 (Weekly) / M1 (Monthly)
Necessary ETF Macro Conditions:
1. Country must have healthy demographics, good ratio of young > old
2. Country population must be increasing
3. Country must be experiencing price-inflation
Necessary Stock Conditions:
1. Growing revenue
2. Growing net income
3. Consistent net margins
4. Higher gross/net profit margin compared to its peers in the industry
5. Growing share holders equity
6. Current ratios > 1
7. Debt to equity ratio (compare to peers )
8. Debt servicing ratio < 30%
9. Wide economic moat
10. Products and services used daily, and will stay relevant for at least 1 decade
Necessary Crypto Conditions:
1. Honest founders
2. Competent technical co-founders
3. Fair or non-existent pre-mine
4. Solid marketing and PR
5. Legitimate use-cases / adoption
Default Robot Settings:
Contribution (USD): $500
When: Dips below lower Bollinger Band
*Robot buys $500 worth of ETF , Stock, Crypto, every time price falls below the lower Bollinger Band
*Equity curve can be seen from the bottom panel*
Risk Warning:
This strategy is low-risk, however it assumes you have a long time horizon of at least 5 to 10 years. The longer your holding-period, the better your returns. The only thing the user has to keep-in-mind are the macro-economic conditions as stated above. If unsure, please stick to ETFs rather than buying individual stocks or cryptocurrencies.

Pump is Coming (TEST)Making forecast with RSI for the PUMP.
It is just testing , do not trade with real acount, just observe...
Top 4 coins for the success
THETA/BTC
LEND/BTC
GXS/BTC
LRC/BTC
But you can analize for the all cryptos

Strategy Smart Forex Buy Sell Signal by LukasHi, I just convert my Smart Forex Buy Sell Signal into strategy.
BUY and SELL signal base on Price action, RSI , and Correlation between Forex Major Pairs.
It's only work for Forex Major Pairs because I only took their data.
Included alert : Spec, Buy, Strong
Recommended to wait for double signal :
Spec Buy > Buy or Spec Sell > Sell
Buy > Strong Buy or Sell > Strong Sell
So execute after the second signal triggered.
On this strategy I exclude Spec Sell/Buy on strategy test.
I use simple Profit/Loss 200/100 and 5 pyramid, you can play around with the setting.
And to improve the odds, simply use my Currency Strength Indicator to pick what pairs to trade. Choose Strong Vs. Weakness to get maximal profit. It help me to stay away from ranging pairs.
Any feedback are welcome :)

MavXtrenderConverted the B-Xtrender script from Puppytherapy into a strategy script.
B-Xtrender was created by Bharat Jhunjhunwal and published in this IFTA Journal .
I've added the following features:
Ability to use factors instead of individual values for each parameter. This will allow you to quickly check different averages (5 vs 7 for example).
Defaults adjusted for crypto trading (7 days/week).
Switches to use either the short or long term indicator, or both.
Time window
Renko Magic - StrategyThis strategy uses the Renko Candle's trend change and follows it with a trend.
Applied 10 ticks of slippage and Bitmex's market order commission.
Last Updated June 7th 2019.

RSI_Strategy_TradersVenueGo long if RSI crosses over 30 or 60. Go Short when RSI falls below 60. Back testing gives good amount of success and can be used in 3/5/15/30/60 minutes time frame with HeikinAshi charts. Don't use normal candles to reduce noise.

Contender 4Directional movement indicator for assessing price direction and strength. DMI tells you when to be long or short, differentiating between strong &weak trends. DMI works on all time frames and applicable to any asset.
DMI is a moving average of range expansion over an input period. The positive directional movement indicator ( +DMI ) measures how strongly price moves upward; the negative directional movement indicator ( -DMI ) measures how strongly price moves downward. The two lines reflect the respective strength of the bulls versus the bears. Which DMI lines is on top is the dominant DMI. The dominant DMI is stronger and more likely to predict the direction of price. For the buyers and sellers to change dominance, the lines must cross over.

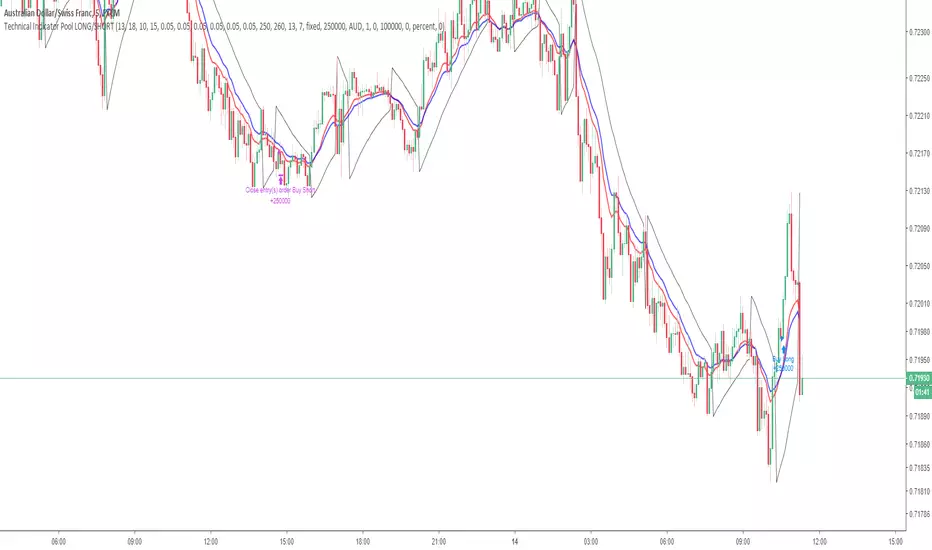
Technical Indicator PoolThis is for Bundle holders who want to use the Technical Indicator Pool for scalping binary options.
Understanding the Technical Indicator Pool
The Technical Indicator Pool is a strategy that operates on the premise that when many technical indicators project the same sentiment, they are concurrently more precise. The technical indicator pool contains five indicators
1. Small MACD Moving Average (SFMA) (10,15)
2. Large MACD Moving Average (LFMA) (13,18)
3. Parabolic Stop and Reverse (PSAR) (0.05, 0.05, 0.05)
4. Relative Strength Index (RSI) (14, 70, 30)
5. H/L Pivot (13)
When all five indicators project the same sentiment within a defined period (known as BarPeriod), an order is placed in the direction of sentiment.
Note:
Due to the nature of the indicator pool, such as the moving averages within the MACD and RSI as well as the High/Low Pivot, false positives may occur before the bar has closed within the time stamp.
This point of reference is to be used in combination with an arsenal of trading tools and should not be used as direct investment advice.
Option strategies should always include stop losses.
This strategy operates using a lot size of 2.5.