Enhanced Multi-Indicator StrategyEnhanced Multi-Indicator Strategy v7 is a trend-following confirmation tool that combines several classic indicators into one clear “voting system.”
Instead of relying on a single signal, this script counts how many indicators agree on a bullish or bearish bias and only fires when the majority lines up and the trend is strong.
It’s designed to help you:
Filter out low-quality signals
Avoid trading against the dominant trend
Get clean, one-time BUY/SELL markers instead of noisy spam signals
How it Works
The indicator evaluates up to 10 components on each bar:
Trend & Structure
Moving Average (MA 50)
EMA Fast (20) vs EMA Slow (50)
Momentum
RSI (14)
MACD (12/26/9)
KDJ
Volatility & Price Location
Bollinger Bands (20, 2)
VWAP
Volume
Volume vs Volume MA (20)
Trend Strength & Direction
ADX + DMI (trend strength and up/down direction)
Optional
Ichimoku Cloud (price vs Senkou A/B)
Each indicator votes bullish or bearish.
The script then:
Counts how many are bullish → bullish_count
Counts how many are bearish → bearish_count
Requires at least Min Indicators for Entry (user-defined) to agree in one direction
Requires ADX above a threshold (default 20) to confirm trend strength
(Optionally) forces entries to follow the DMI trend:
Longs only in uptrends
Shorts only in downtrends
Only when these conditions are met does the script consider a valid long zone or short zone.
Signals: 1x Fire + Cooldown
To keep the chart clean and prevent over-trading:
A BUY arrow is plotted only on the first bar when price enters a new bullish zone.
A SELL arrow is plotted only on the first bar when price enters a new bearish zone.
A cooldown (in bars) can be configured separately for BUY and SELL so the script will not fire again in the same direction too frequently.
Background colors (optional):
Green background = bullish zone (majority indicators bullish + strong trend)
Red background = bearish zone (majority indicators bearish + strong trend)
This makes it easy to see when the “environment” is favorable for longs or shorts, while the arrows highlight the first opportunity in each zone.
Inputs & Tuning
Key inputs:
Min Indicators for Entry – how many indicators must agree (e.g. 5–7 for stricter filtering)
Strict Trend Filter – if enabled, entries must follow DMI trend (recommended for trend-following)
Cooldown BUY / SELL – minimum number of bars before a new signal in the same direction
Toggles to enable/disable each component (MA, EMA, RSI, MACD, KDJ, BB, Volume, VWAP, ADX, Ichimoku)
General ideas:
Increase Min Indicators for Entry and/or cooldown to reduce the number of signals and focus on stronger trends.
Lower values will make the indicator more active, suitable for shorter-term trading or scalping.
Important Note
This is an indicator, not a full trading system:
It does not manage entries/exits, position sizing, or risk by itself.
Always combine it with your own risk management, stop-loss / take-profit rules, and higher-timeframe context.
Use it as a confirmation / regime tool:
Trade only in the direction of the active zone,
Take BUY signals during bullish regimes,
Take SELL signals during bearish regimes.
Indice de force relative (RSI)

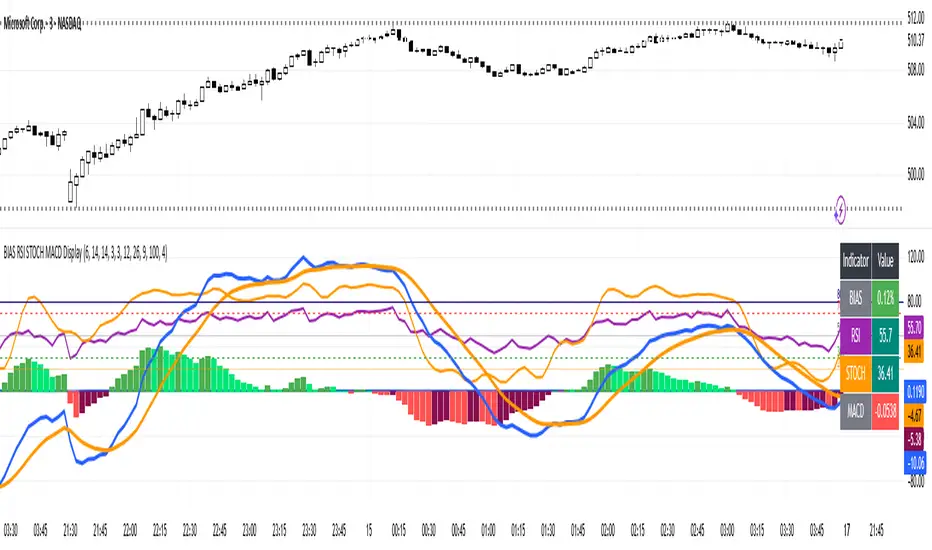
BIAS RSI STOCH MACD Displaysimple but effective to prevent chart clutter.
Hi Traders! Today I’m showing you a **custom indicator** that combines **BIAS, RSI, Stochastic, and MACD** in one easy-to-read panel. Let’s break it down:
1️⃣ **BIAS** – Shows how far the price is from its moving average.
* Positive BIAS → price is above the average.
* Negative BIAS → price is below the average.
2️⃣ **RSI (Relative Strength Index)** – Measures momentum.
* Above 70 → overbought
* Below 30 → oversold
* **50 line added** → midpoint for trend direction
3️⃣ **Stochastic (STOCH)** – Confirms momentum like RSI.
* Above 80 → overbought
* Below 20 → oversold
4️⃣ **MACD (Moving Average Convergence Divergence)** – Shows trend and momentum.
* Histogram colors indicate strength
* Lines show trend direction
5️⃣ **Visual Table** – On the top right, you can see all current indicator values at a glance, with color coding for easy interpretation.
6️⃣ **Plots & Levels** –
* BIAS, RSI, Stoch are plotted clearly
* RSI has **midline at 50** for trend reference
* Standard overbought/oversold levels highlighted
✅ **How to Use:**
* Look for RSI or Stoch crossing midline or extreme levels for potential entries.
* Check MACD histogram and lines for confirmation of trend strength.
* Use BIAS to see if price is stretched from the moving average.
This indicator is perfect for **momentum, trend, and mean-reversion traders**, giving multiple signals in one pane without clutter.
---
Smart TP Manager - FREE Edition📘 Smart TP Manager - User Guide
🎯 Parameter Adaptation by Timeframe
IMPORTANT: Default parameters are optimized for M5 (5 minutes). If you trade on other timeframes, you MUST adapt the parameters for better results.
📊 Recommended Settings Table
M1 (1 minute) - Ultra Scalping
ATR SL Multiplier: 1.5 - 1.8
Number of TPs: 3 - 4
Base RR: 0.4 - 0.5
Confirmation Bars: 2
Cooldown: 3 - 5 bars
Breakeven: Enable after TP1
Profile: Very fast trades, immediate exits, tight SL
M5 (5 minutes) - Scalping ✅ DEFAULT
ATR SL Multiplier: 1.8 - 2.0
Number of TPs: 4 - 5
Base RR: 0.5 - 0.6
Confirmation Bars: 2 - 3
Cooldown: 5 - 8 bars
Breakeven: Enable after TP1 or TP2
Profile: Standard scalping, balance between speed and security
M15 (15 minutes) - Intraday
ATR SL Multiplier: 2.0 - 2.2
Number of TPs: 5 - 6
Base RR: 0.6 - 0.8
Confirmation Bars: 3
Cooldown: 8 - 10 bars
Breakeven: Enable after TP2
Profile: Intraday trading, 3-8 trades per day
H1 (1 hour) - Swing
ATR SL Multiplier: 2.2 - 2.5
Number of TPs: 5 - 6
Base RR: 0.8 - 1.0
Confirmation Bars: 3 - 4
Cooldown: 10 - 15 bars
Breakeven: Enable after TP2 or TP3
Profile: Swing trading, 1-3 trades per day
H4 (4 hours) - Position
ATR SL Multiplier: 2.5 - 3.0
Number of TPs: 6
Base RR: 1.0 - 1.2
Confirmation Bars: 4 - 5
Cooldown: 15 - 20 bars
Breakeven: Enable after TP3
Profile: Position trading, multi-day trades
🔍 Adaptation Logic
General Rule:
LOWER Timeframe → TIGHTER Parameters
HIGHER Timeframe → WIDER Parameters
Why Adapt?
1. ATR SL Multiplier
M1: Very volatile market, fast moves → Tight SL (1.5-1.8)
H4: Slow moves, breathing room needed → Wide SL (2.5-3.0)
2. Number of TPs
M1: Quick exits before reversal → 3-4 TPs
H4: Let profits run → 6 TPs
3. Base RR
M1: Close targets, quick exits → 0.4-0.5
H4: Ambitious targets, patience → 1.0-1.2
4. Confirmation Bars
M1: Fast entry, 2 candles enough
H4: Strong confirmation needed, 4-5 candles
5. Cooldown
M1: Multiple trades per hour possible → 3-5 bars
H4: Important spacing between trades → 15-20 bars
6. Breakeven
M1: Immediate protection after TP1
H4: Let trade breathe, BE after TP3
💡 Real Examples
Example 1: Gold M1 Scalping
Goal: 10-20 trades/day, ultra-fast exits
Recommended Parameters:
- ATR SL: 1.6
- TPs: 4
- Base RR: 0.5
- Confirmation: 2
- Cooldown: 5
- BE: ON after TP1
Expected Results:
- Winrate: 40-50%
- Net P/L: +3 to +6R per day
- SL: 10-15 pips
- TP1: 5-8 pips (quick exit)
Example 2: Gold M15 Day Trading
Goal: 3-6 trades/day, let it breathe
Recommended Parameters:
- ATR SL: 2.1
- TPs: 5
- Base RR: 0.7
- Confirmation: 3
- Cooldown: 10
- BE: ON after TP2
Expected Results:
- Winrate: 50-60%
- Net P/L: +5 to +10R per day
- SL: 20-30 pips
- TP1: 14-21 pips
Example 3: Gold H1 Swing Trading
Goal: 1-2 trades/day, maximum patience
Recommended Parameters:
- ATR SL: 2.4
- TPs: 6
- Base RR: 0.9
- Confirmation: 4
- Cooldown: 12
- BE: ON after TP2
Expected Results:
- Winrate: 55-65%
- Net P/L: +8 to +15R per week
- SL: 40-60 pips
- TP1: 36-54 pips
⚠️ Common Mistakes to Avoid
❌ MISTAKE #1: Using same parameters on all timeframes
M1 with ATR SL 2.5 → SL too wide, huge losses
H4 with ATR SL 1.5 → SL too tight, constant stop outs
❌ MISTAKE #2: Too many TPs on low timeframe
M1 with 6 TPs → Impossible to reach all TPs
❌ MISTAKE #3: Too long confirmation on M1
M1 with 5 confirmation bars → Misses all fast moves
❌ MISTAKE #4: Too short cooldown on H4
H4 with 3 bars cooldown → Overtrading, too many poor-quality trades
🎯 Testing Methodology
Step 1: Start with recommended values
Use the table above according to your timeframe
Step 2: Backtest on minimum 100 trades
Observe:
Winrate
Net P/L in R
Number of BE hits
Trade frequency
Step 3: Adjust based on results
If too many SL hits:
↑ Increase ATR SL Multiplier by +0.2
↑ Increase Confirmation Bars by +1
If not enough trades:
↓ Reduce Cooldown by -2
↓ Reduce Confirmation Bars by -1
If TPs never reached:
↓ Reduce Number of TPs by -1
↓ Reduce Base RR by -0.1
If too many BE but no real wins:
↑ Increase Base RR by +0.1
Disable BE temporarily
📈 Performance Tracking
Key indicators by timeframe:
TFTrades/DayMin WinrateNet P/L/DayAvg SL (pips)M110-2040%+3R10-15M55-1245%+4R15-20M153-850%+5R20-30H11-455%+3R40-60H40.5-260%+2R80-120
🚀 Final Advice
DO NOT USE THE SAME PARAMETERS ON DIFFERENT TIMEFRAMES!
Each timeframe has its own dynamics. Adapting parameters is not optional, it's MANDATORY for optimal results.
Different timeframe = Different parameters = Different results
Quick Reference Chart
M1 → AGGRESSIVE (tight SL, few TPs, quick BE)
M5 → BALANCED (default settings)
M15 → MODERATE (wider SL, more TPs)
H1 → PATIENT (wide SL, max TPs, late BE)
H4 → CONSERVATIVE (very wide SL, all TPs, very late BE)
📝 Best Practices
Always backtest on your specific timeframe before live trading
Start conservative - use higher ATR multipliers first
Track your stats - Wins, Losses, BE, Net P/L
Adjust gradually - change one parameter at a time
Respect your timeframe - don't force H4 parameters on M1
Use breakeven wisely - protect profits but don't choke trades
Monitor cooldown - too many trades = lower quality
🎓 Understanding the Strategy
EMA 9/21 Crossover
BUY: EMA9 crosses above EMA21
SELL: EMA9 crosses below EMA21
RSI Filter
Avoids overbought (>70) for longs
Avoids oversold (<30) for shorts
Confirmation System
Requires X consecutive candles meeting conditions
Reduces false signals
Take Profit Structure
Non-linear TP levels
TP1: 0.5R (default)
TP2: 1.0R
TP3: 1.5R
TP4: 2.0R
TP5: 2.5R
Risk Management
ATR-based stop loss (adapts to volatility)
Optional breakeven after specified TP
Cooldown prevents overtrading
🌟 Pro Tips
Gold (XAUUSD) specific: Use tighter parameters than forex pairs
NY Session: More volatility, tighter SL recommended
Asian Session: Lower volatility, consider skipping or wider SL
News events: Increase cooldown before/after major news
Trending markets: Increase Number of TPs
Ranging markets: Decrease Number of TPs, faster exits
Happy Trading! 🎯
Remember: Past performance does not guarantee future results. Always use proper risk management and never risk more than you can afford to lose.

Multitimeframe Stochastic RSIIndicator is Combining 4 different timeframe Stochastic RSI and show buy signal when all of them are oversold and sell signal when all of them are overbought.
Default settings are set up for 15 minute timeframe:
K1 - 15M (period = 14)
K2 - 30M (period = 28)
K3 - 1H (period = 56)
K4 - 2H (period = 112)
It indicates top and bottoms of given period.
Its good to use as a confirmation indicator.
Feel free to comment and use it.
Greetings!

Market Extreme Zones IndexThe Market Extreme Zones Index is a new mean reversion (valuation) tool focused on catching long term oversold/overbought zones. Combining an enhanced RSI with a smoothed Z-score this indicator allows traders to find oppurtunities during highly oversold/overbought zones.
I will separate the explanation into the following parts:
1. How does it work?
2. Methodologies & Concepts
3. Use cases
How does it work?
The indicator attempts to catch highly unprobable events in either direction to capture reversal points over the long term. This is done by calculating the Z-Score of an enhanced RSI.
First we need to calculate the Enhanced RSI:
For this we need to calculate 2 additional lengths:
Length1 = user defined length
Length2 = Length1/2
Length3 = √Length
Now we need to calculate 3 different RSIs:
1st RSI => uses classic user defined source and classic user defined length.
2nd RSI => uses classic user defined source and Length 2.
3rd RSI => uses RSI 2 as source and Length 2
Now calculate the divergence:
RSI_base => 2nd RSI * 3 - 1st RSI - 3rd RSI
After this we need to calculate the median of the RSI_base over √Length and make a divergence of these 2:
RSI => RSI_base*2 - median
All that remains now is the Z-score calculations:
We need:
Average RSI value
Standard Deviation = a measure of how dispersed or spread out a set of data values are from their average
Z-score = (Current Value - Average Value) / Standard Deviation
After this we just smooth the Z-score with a Weighted Moving average with √Length
Methodology & Concepts
Mean Reversion Methodology:
The methodology behind mean reversion is the theory that asset prices will eventually return to their long-term average after deviating significantly, driven by the belief that extreme moves are temporary.
Z-Score Methodology:
A Z-score, or standard score, is a statistical measure that indicates how many standard deviations a data point is from the mean of a dataset. A positive z-score means the value is above the mean, a negative score means it's below, and a score of zero means the value is equal to the mean.
You might already be able to see where I am going with this:
Z-Score could be used for the extreme moves to capture reversal points.
By applying it to the RSI rather than the Price, we get a more accurate measurement that allow us to get a banger indicator.
Use Cases
Capturing reversal points
Trend Direction
- while the main use it for mean reversion, the values can indicate whether we are in an uptrend or a downtrend.
Advantages:
Visualization:
The indicator has many plots to ensure users can easily see what the indicator signals, such as highlighting extreme conditions with background colors.
Versatility:
This indicator works across multiple assets, including the S&P500 and more, so it is not only for crypto.
Final note:
No indicator alone is perfect.
Backtests are not indicative of future performance.
Hope you enjoy Gs!
Good luck!

Swing Trade BUY/SELL + SCORING +COLOUR FIXBUY/SELL labels now appear with a score (1–3) next to them.
Color coding visually distinguishes signal strength:
BUY → 1 yellow, 2 light green, 3 dark green
SELL → 1 orange, 2 red, 3 burgundy
This allows you to instantly see the signal strength both numerically and visually.

Swing Trade AL/SAT + Güç Derecesi_huğurlu
Weak signal → MACD crossover only.
Moderate signal → MACD crossover + RSI confirmation.
Strong signal → MACD crossover + RSI + Stoch RSI confirmation.
BUY/SELL labels appear on the chart in different colors and sizes.
This way, you can instantly see which signal is more reliable.
Zayıf sinyal → sadece MACD kesişim var
Orta sinyal → MACD kesişim + RSI teyidi.
Güçlü sinyal → MACD kesişim + RSI + Stoch RSI teyidi.

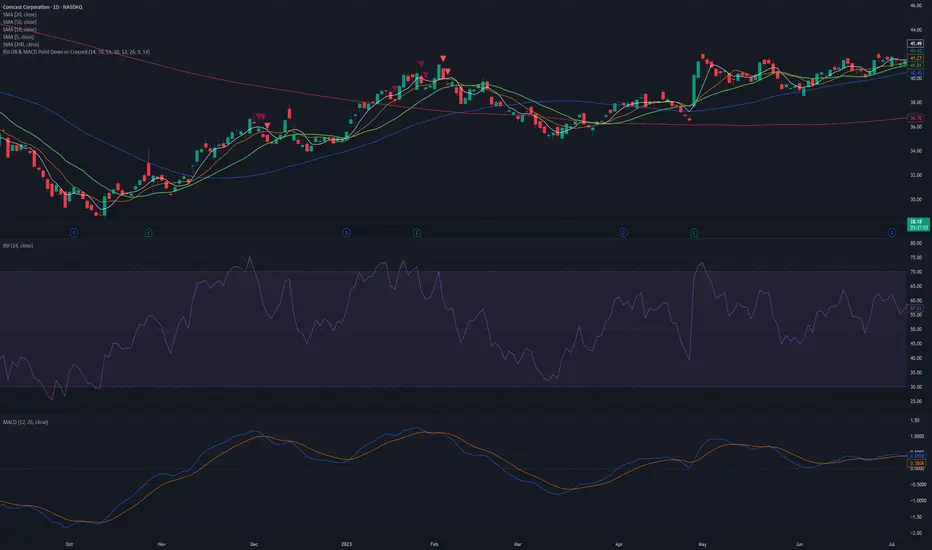
RSI OB & MACD Point Down or Crossed - PSPine script screener indicator for RSI OB and MACD point down or cross.

Hidden Bullish Divergence - B166erThis script will paint a line on the chart when hidden bullish divergence is occurring.
Relative Strength HSIWe add the relative strength indicator. We try to maximize the alpha,
when there is price divergence, we should notice.

Alpha-Weighted RSIDescription:
The Alpha-Weighted RSI is a next-generation momentum oscillator that redefines the classic RSI by incorporating the mathematical principles of Lévy Flight. This advanced adaptation applies non-linear weighting to price changes, making the indicator more sensitive to significant market moves and less reactive to minor noise. It is designed for traders seeking a clearer, more powerful view of momentum and potential reversal zones.
🔍 Key Features & Innovations:
Lévy Flight Alpha Weighting: At the core of this indicator is the Alpha parameter (1.0-2.0), which controls the sensitivity to price changes.
Lower Alpha (e.g., 1.2): Makes the indicator highly responsive to recent price movements, ideal for capturing early trend shifts.
Higher Alpha (e.g., 1.8): Creates a smoother, more conservative output that filters out noise, focusing on stronger momentum.
Customizable Smoothing: The raw Lévy-RSI is smoothed by a user-selectable moving average (8 MA types supported: SMA, EMA, SMMA, etc.), allowing for further customization of responsiveness.
Intuitive Centered Oscillator: The RSI is centered around a zero line, providing a clean visual separation between bullish and bearish territory.
Dynamic Gradient Zones: Subtle, colour coded gradient fills in the overbought (>+25) and oversold (<-25) regions enhance visual clarity without cluttering the chart.
Modern Histogram Display: Momentum is plotted as a sleek histogram that changes color between bright cyan (bullish) and magenta (bearish) based on its position relative to the zero line.
🎯 How to Use & Interpret:
Zero-Line Crossovers: The most basic signals. A crossover above the zero line indicates building bullish momentum, while a crossover below suggests growing bearish momentum.
Overbought/Oversold Levels: Use the +25/-25 and +35/-35 levels as dynamic zones. A reading above +25 suggests strong bullish momentum (overbought), while a reading below -25 indicates strong bearish momentum (oversold).
Divergence Detection: Look for divergences between the Alpha-Weighted RSI and price action. For example, if price makes a new low but the RSI forms a higher low, it can signal a potential bullish reversal.
Alpha Tuning: Adjust the Alpha parameter to match market volatility. In choppy markets, increase alpha to reduce noise. In trending markets, decrease alpha to become more responsive.
⚙️ Input Parameters:
RSI Settings: Standard RSI inputs for Length and Calculation Source.
Lévy Flight Settings: The crucial Alpha factor for response control.
MA Settings: MA Type and MA Length for smoothing the final output.
By applying Lévy Flight dynamics, this indicator offers a nuanced perspective on momentum, helping you stay ahead of the curve. Feedback is always welcome!

Zone Tap Counter: Support & Resistance StrengthWhat is this indicator?
This script is designed to help traders objectively monitor the strength and significance of price zones by counting and visualizing how many times price “taps” confirmed support and resistance levels. The indicator leverages swing high/low detection to automatically plot relevant zones and uses price tap frequency as an objective strength metric.
How does it work?
Zone Identification:
The script uses the Pine Script functions ta.pivothigh and ta.pivotlow to detect confirmed swing highs and lows on your chart. Each swing high establishes a resistance zone, and each swing low establishes a support zone.
Only confirmed pivots are used, ensuring all signals are strictly non-repainting.
Tap Counting Logic:
For every candle, the indicator checks whether price touches (comes within a small, user-set tolerance) of any currently tracked support or resistance zone. To avoid counting repeated taps in the same move, the script ensures only unique bar taps are registered.
Each time price taps a zone, a counter for that zone is incremented.
Both the tolerance for taps (percentage-based), and the depth/history of zones tracked are fully adjustable in settings.
Visual Feedback:
Zones with more taps are drawn darker (lower transparency), making it easy to spot the strongest/hardest-tested levels on the chart.
A label on each zone displays the current tap count (e.g., "3x"), giving direct feedback about which support/resistance are most significant in the current view.
Only recent zones (user-configurable) are shown to keep charts clear and useful.
How to use it:
Add the indicator to your TradingView chart.
Set the swing length and tap tolerance in settings to match your market or timeframe (short swing length for scalping, longer swings for bigger structure).
Watch for zones with high tap counts and darker lines: These zones represent areas where price has repeatedly reacted, suggesting they may be important for your trading decisions.
You can adjust the minimum number of taps needed for a zone to be highlighted and the number of zones to display for your preferred visual clarity.
Combine this tool with other analysis for confirmation—tap counts should not be seen as trading signals, but as supporting information.
Originality & Calculation Details:
This script does NOT simply merge or overlay existing indicators. The calculation method is original: it uses swing-based support/resistance and applies unique tap-count logic, designed for objective zone strength visualization.
No repainting logic is present.
All code and visualization methods are documented and transparent.
Disclaimer:
This indicator is for educational and analytical purposes only. It does not predict future price movement, guarantee profits, or recommend specific trades. Always use your own analysis and risk management. See TradingView’s House Rules for more details.

Multi-Timeframe RSI + MA - Santosh - BangaloreThis script has a combined 5 and 15 min RSI's together in one indicator. Created using AI.

EMA + RSI Autotrade Webhook - VarunOverview
The EMA + RSI Autotrade Webhook is a powerful trend-following indicator designed for automated crypto futures trading. This indicator combines the reliability of Exponential Moving Average (EMA) crossovers with RSI momentum filtering to generate high-probability buy and sell signals optimized for webhook integration with crypto exchanges like Delta Exchange, Binance Futures, and Bybit.Key Features
Simple & Effective: Uses proven EMA 9/21 crossover strategy
RSI Momentum Filter: Eliminates low-probability trades in ranging markets
Webhook Ready: Two clean alerts (LONG Entry, SHORT Entry) for seamless automation
Exchange Compatible: Works with Delta Exchange, 3Commas, Alertatron, and other webhook platforms
Zero Lag Signals: Real-time alerts on crossover confirmation
Visual Clarity: Clean chart markers for easy signal identification
How It Works
Entry Signals:
LONG Entry: Triggers when EMA 9 crosses above EMA 21 AND RSI is above 52 (bullish momentum confirmed)
SHORT Entry: Triggers when EMA 9 crosses under EMA 21 AND RSI is below 48 (bearish momentum confirmed)
Technical Components:
Fast EMA: 9-period (tracks short-term price action)
Slow EMA: 21-period (identifies primary trend)
RSI: 14-period (confirms momentum strength)
RSI Long Threshold: 52 (filters weak bullish signals)
RSI Short Threshold: 48 (filters weak bearish signals)
Best Use Cases
Crypto Futures Trading: Bitcoin, Ethereum, Altcoin perpetual contracts
Automated Trading Bots: Integration with Delta Exchange webhooks, TradingView alerts
Timeframes: Optimized for 15-minute charts (works on 5min-1H)
Markets: Trending crypto markets with clear directional moves
Risk Management: Best used with 1-2% stop loss per trade (managed externally)
Webhook Automation Setup
Add indicator to your TradingView chart
Create alerts for "LONG Entry" and "SHORT Entry"
Configure webhook URL from your exchange (Delta Exchange, Binance, etc.)
Use alert message: Entry LONG {{ticker}} @ {{close}} or Entry SHORT {{ticker}} @ {{close}}
Exchange automatically reverses positions on opposite signals
Advantages
✅ No manual trading required - fully automated
✅ Eliminates emotional trading decisions
✅ Catches trending moves early with EMA crossovers
✅ RSI filter reduces whipsaws in choppy markets
✅ Works 24/7 without monitoring
✅ Simple two-alert system (easy to manage)
✅ Compatible with multiple exchanges via webhooksStrategy Philosophy
This indicator follows a trend-following with momentum confirmation approach. By waiting for both EMA crossover AND RSI confirmation, it ensures you're entering trades with genuine momentum behind them, not just random price noise. The tight RSI thresholds (52/48) keep you aligned with the prevailing trend.Recommended Settings
Timeframe: 15-minute (primary), 5-minute (scalping), 1-hour (swing)
Markets: BTC/USDT, ETH/USDT, high-liquidity altcoin perpetuals
Position Sizing: 100% capital per signal (exchange manages reversals)
Stop Loss: 2% (managed via exchange or external bot)
Leverage: 1-2x for conservative approach, up to 5x for aggressive
Important Notes
⚠️ This indicator generates entry signals only - position reversals are handled automatically by your exchange
⚠️ Always backtest on historical data before live trading
⚠️ Use proper risk management and position sizing
⚠️ Best performance in trending markets; may generate false signals in tight ranges
⚠️ Requires TradingView Premium or higher for webhook functionalityTags
cryptocurrency futures automated-trading ema-crossover rsi webhook delta-exchange tradingview-alerts trend-following momentum bitcoin ethereum crypto-bot algo-trading 15-minute-strategy

Ichimoku_RSI_MACD_CleanIchimoku + RSI + MACD. A combination of three indicators. The important thing is that they have a BUY or SELL alert, so it makes it easy to understand the numbers.


Ichimoku_RSI_MACD_CleanIchimoku + RSI + MACD indicator. It combines these three indicators. It tells whether the trend is bullish or bearish. Multi-timeframe.

Pulse RSI | Lyro RSPulse RSI | Lyro RS
The Pulse RSI is a momentum oscillator that enhances the traditional RSI by incorporating volume-weighted price and linear regression. It generates multiple trading signals, including trend shifts, overbought/oversold conditions, and custom threshold levels.
By integrating both price and volume into its calculation, Pulse RSI is more robust and responsive than the standard RSI. This helps you identify trends faster, spot potential reversals sooner, and set up custom alerts based on your own strategy.
Key Features
Four Signal Types:
Type 1 (Trend): Triggers when the indicator's current value crosses its previous value, highlighting short-term momentum shifts.
Type 2 (Midline Trend): The classic midline cross. A bullish bias is indicated above 50, while a bearish bias is indicated below 50.
Type 3 (Overbought/Oversold): Flags potential reversal zones, suggesting where buying or selling opportunities may emerge.
Type 4 (Custom Thresholds): This type lets you define your own threshold levels. Instead of following a trend, use it to mark your specific conditions for a reversal. For example, set a long reversal at a low level (e.g., 5) for an early buy signal, or a short reversal at a high level (e.g., 80) for an early sell signal.
Calculation Method:
The indicator uses a volume-weighted price (Close * High * Low) and applies linear regression to smooth the data. This creates a unique and more stable oscillator, avoiding the chaotic movement seen in others.
Color System:
Choose from multiple color themes like Classic, Mystic, Accented, and Royal, or create your own custom colors for bullish and bearish signals.
Visual Plotting:
Features a clear plot with a glow effect, a midline, adjustable threshold lines, and shapes/labels to mark long/short and overbought/oversold signals.
Alerts:
Instant alerts are available for every signal type, which you can quickly enable based on your trading conditions.
How It Works:
Core Calculation
The indicator calculates a volume-weighted price using (Close * High * Low) multiplied by the absolute volume. This value is then smoothed with linear regression and converted into an oscillator, normalized to a 0-100 scale.
Trading Logic:
Bullish Signals: Trigger when the main plot line crosses above a key level—be it the previous value, the 50 midline, or a custom threshold.
Bearish Signals: Trigger when the main plot line crosses below a key level.
Visual Logic:
The system displays a main plot line, colors candles, and plots signal shapes, all customizable through a variety of color schemes.
Practical Use
Trend Confirmation (Types 1 & 2): Use Type 1 for early momentum shifts and Type 2 to confirm the overall trend direction.
Reversals (Type 3): Consider long entries when oversold signals fire, suggesting an asset is undervalued. Look for exits at overbought signals, which suggest a potential downward reversal.
Custom Thresholds (Type 4): Set tight thresholds to catch early trends and reversals. Be aware that more sensitive settings may also increase false positives.
Customization:
Adjust the Length: A higher setting makes the indicator more suited for long-term trends, while a lower setting makes it more sensitive for short-term moves.
Enable/Disable Signals: Turn the four signal types on or off to match your trading style.
Set Your Levels: Fully adjustable thresholds for Type 4 long/short conditions.
Choose Your Colors: Select from a variety of color schemes for all bullish and bearish elements.
⚠️ Disclaimer
This indicator is a tool for technical analysis and does not guarantee results. It should be used alongside other analysis methods and solid risk management practices. The creators are not responsible for any financial decisions made based on its signals.

RSI(Min-Max)RSI (Min-Max) is an enhanced version of Welles Wilder's Relative Strength Index, designed to offer greater analytical precision and dynamic insight into the behavior of the RSI within each candlestick.In addition to displaying the traditional RSI value, this script calculates the possible extreme values — the minimum and maximum RSI — based on the low and high prices of the current candle. This allows you to estimate how the RSI would react if the price moved to the extremes of the bar, providing a predictive and refined reading of momentum.

ADX Trend Strength Filter + TRAMA [DotGain]Summary
Are you tired of trading trend signals, only to get stopped out in volatile, sideways chop?
The ADX Trend Strength Filter (ADX TSF) is designed to solve this exact problem. It is a comprehensive trend-following system that only generates signals when a trend not only has the right direction and momentum, but also sufficient strength.
This indicator filters out weak or indecisive market phases (the "chop") and will only color the bars Green or Red when all conditions for a strong, confirmed trend are met.
⚙️ Core Components and Logic
The ADX TSF relies on a triple-filter logic to generate a clear trade signal:
Trend Filter (TRAMA): A TRAMA (Trending Adaptive Moving Average) is used as the main trendline. This adaptive average automatically adjusts to market volatility, acting as a dynamic support/resistance level.
Price > TRAMA = Bullish
Price < TRAMA = Bearish
Momentum Filter (RSI Crossover): Momentum is measured by a crossover of two moving averages of the RSI (a fast EMA and a slow SMA). This confirms whether the momentum is pointing in the same direction as the trend.
Strength Filter (ADX): This is the most important filter. A signal is only considered valid if the ADX (Average Directional Index) is above a defined threshold (Default: 30). This ensures the trend has sufficient strength.
🚦 How to Read the Indicator
The indicator has three states, displayed directly as bar colors on your chart:
🟩 GREEN BARS (Strong Uptrend) All three conditions are met:
Price is above the TRAMA.
RSI momentum is bullish (Fast MA > Slow MA).
ADX is above 30 (Strong trend is present).
🟥 RED BARS (Strong Downtrend) All three conditions are met:
Price is below the TRAMA.
RSI momentum is bearish (Fast MA < Slow MA).
ADX is above 30 (Strong trend is present).
🟧 ORANGE BARS (Neutral / Caution) This state appears if any of the following conditions are true:
Weak Trend: The ADX is below 30. The market is in consolidation or a sideways phase. (This is the primary filter!)
Indecision: The price is caught in the "Neutral Zone" between the TRAMA and the 200 SMA.
Visual Elements
Bar Colors: (Green/Red/Orange) Show the current trend status.
TRAMA (Orange Line): Your primary adaptive trendline.
200 SMA (White Line): Serves as a reference for the long-term trend.
Orange Background (Fill): Fills the area between the TRAMA and SMA to visually highlight the "Neutral Zone."
Key Benefit
The goal of the ADX TSF is to keep traders out of weak, unpredictable markets and help them participate only in strong, momentum-confirmed trends.
Have fun :)
Disclaimer
This "Buy The F*cking Dip" (BTFD) indicator is provided for informational and educational purposes only. It does not, and should not be construed as, financial, investment, or trading advice.
The signals generated by this tool (both "Buy" and "Sell") are the result of a specific set of algorithmic conditions. They are not a direct recommendation to buy or sell any asset. All trading and investing in financial markets involves substantial risk of loss. You can lose all of your invested capital.
Past performance is not indicative of future results. The signals generated may produce false or losing trades. The creator (© DotGain) assumes no liability for any financial losses or damages you may incur as a result of using this indicator.
You are solely responsible for your own trading and investment decisions. Always conduct your own research (DYOR) and consider your personal risk tolerance before making any trades.

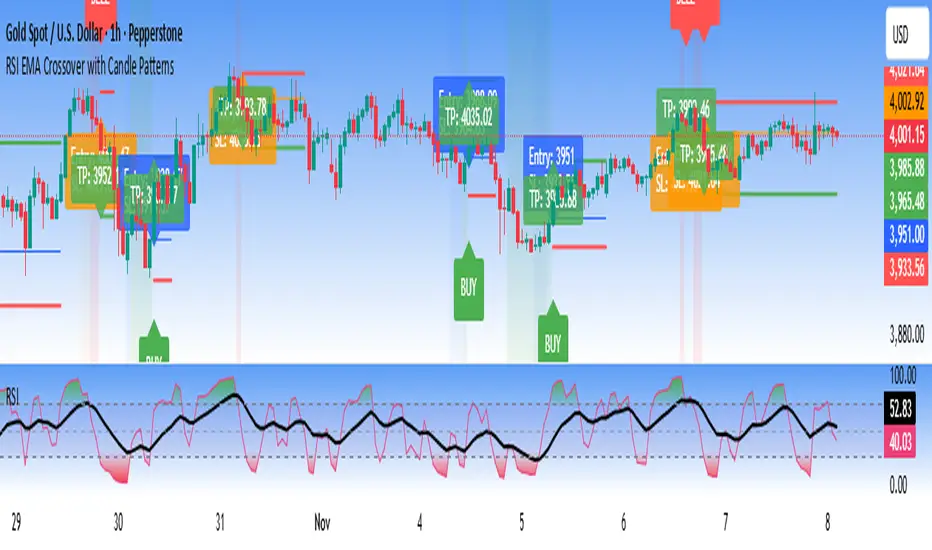
RSI EMA Crossover with Price ActionThe RSI and RSI's EMA Crossover with Price Action (1:2 Risk-Reward) strategy combines Momentum, Trend confirmation, and Basic price-action logic to generate high-probability trade setups with Proper Risk Management.
This script identifies entries when the RSI crosses a key threshold and aligns with an RSI - EMA crossover, confirming Exhaustion of a current trend and Price action confirms the Change in Trend direction. It integrates price action filters to avoid false signals during low-volatility or choppy conditions.
The strategy also includes a risk-management module, setting a fixed 1:2 risk-to-reward ratio — automatically placing a take-profit target twice the size of the stop loss. Also the Stop loss can be adjusted to nearest swing low or last 3 candles Low. to avoid Stoploss hunt.
Features
✅ RSI and EMA crossover confirmation for directional bias
✅ Basic price-action validation (optional filters)
✅ Configurable stop-loss and take-profit levels (default 1:2)
✅ Visual trade markers for entries and exits
Disclaimer: This script is intended for educational and research purposes only. It should not be considered financial advice or a guaranteed trading system. Users are encouraged to test and optimize parameters before using in live markets.