Cosmic Crypto Golden ZoneCosmic Crypto Golden Zone
## Overview
**Cosmic Crypto Golden Zone** is an all-in-one swing trading indicator designed to identify high-probability retracement entries using Fibonacci levels, multi-timeframe confluence, and a simple Buy/Sell scoring system. The indicator removes the guesswork from trading pullbacks by combining structure analysis, momentum indicators, and volume confirmation into a single, easy-to-read signal.
**Best Used For:** Swing trading on 15m, 1H, and 4H timeframes in crypto, forex, and stocks.
---
## Key Features
### 🎯 Golden Zone Detection
Automatically identifies the optimal entry zone (0.5 - 0.786 Fibonacci retracement) where price is most likely to reverse and continue the trend.
### 📊 Buy/Sell Scoring (1-10)
A simplified signal table that scores setups from 1-10, telling you exactly when to buy or sell without needing to interpret multiple indicators.
### 📈 Multi-Timeframe Confluence
Filters trades to align with the higher timeframe trend (default: 4H), ensuring you only trade in the dominant direction.
### 🔍 Structure Detection (HH/HL/LH/LL)
Tracks market structure with Higher Highs, Higher Lows, Lower Highs, and Lower Lows to determine trend direction.
### 💧 Liquidity Sweep Detection
Identifies when price sweeps beyond the 0.886 level (stop-hunting zone) and reclaims the entry zone—a premium reversal signal.
### 📉 RSI Divergence Detection
Spots bullish and bearish divergences within the golden zone for additional confirmation.
### 🛡️ Dynamic Stop Loss
ATR-based stop loss that adjusts to current volatility, protecting you in both calm and volatile markets.
### 🎯 Smart Take Profit
Calculates TP based on your chosen entry point (FOMO, ENTRY, or Average) with customizable Risk:Reward targeting.
---
## How to Read the Signal Table
The table in the bottom-right corner gives you everything you need at a glance:
| Row | What It Shows |
|-----|---------------|
| **BUY/SELL + Score** | Direction and strength (1-10) |
| **Action** | 🚀 NOW (8+), ✓ READY (6-7), 👀 WATCH (4-5), ⏳ WAIT (<4) |
| **Zone** | Whether price is IN the golden zone or waiting |
| **Entry / TP / SL** | Your exact trade levels |
| **R:R** | Risk-to-Reward ratio with quality indicator |
### Score Breakdown
| Score | Meaning | Action |
|-------|---------|--------|
| **8-10** | High conviction setup | Enter on next candle close |
| **6-7** | Good setup | Enter with confirmation candle |
| **4-5** | Possible setup | Wait for more confluence |
| **1-3** | Weak/No setup | Skip this trade |
---
## How to Use: Step-by-Step
### Step 1: Check the Trend Direction
Look at the **Structure** in the info display:
- **BULLISH** (HH + HL pattern) → Only look for BUY signals
- **BEARISH** (LL + LH pattern) → Only look for SELL signals
### Step 2: Wait for Price to Enter the Golden Zone
The golden zone is highlighted between the **FOMO (0.618)** and **ENTRY (0.786)** levels. The table will show "✓ IN ZONE" when price reaches this area.
### Step 3: Check Your Score
Wait for the Buy/Sell score to reach **6 or higher** before considering an entry. Higher scores = higher probability.
### Step 4: Look for Confirmation
The best entries have multiple confirmations:
- ✅ Score 6+
- ✅ In Golden Zone
- ✅ Stochastic oversold/overbought
- ✅ RSI Divergence (DIV label)
- ✅ Liquidity Sweep (LIQ label) — *Premium signal*
- ✅ Bullish/Bearish candle pattern
### Step 5: Execute the Trade
Use the levels shown on the chart and in the table:
- **Entry:** FOMO (aggressive) or ENTRY (conservative)
- **Stop Loss:** Below/above the SL line (red)
- **Take Profit:** At the TP line (green)
---
## Chart Labels Explained
| Label | Color | Meaning |
|-------|-------|---------|
| **FOMO: ** | Green | 0.618 Fib - Aggressive entry level |
| **ENTRY: ** | Yellow (Bold) | 0.786 Fib - Conservative entry level |
| **LIQ: ** | Red | 0.886 Fib - Liquidity/stop-hunt zone |
| **TP: ** | Green | Take Profit target |
| **SL: ** | Red (Bold) | Stop Loss level |
| **R:R ** | Green/Orange | Risk-to-Reward ratio |
| **HH/HL/LH/LL** | Various | Structure swing labels |
| **DIV** | Lime/Pink | RSI Divergence detected |
| **LIQ** (arrow) | Lime/Red | Liquidity sweep signal |
| **AE** | Green/Red | Williams Vix Fix Aggressive Entry |
| **B/S** | Green/Red | Buy/Sell signal with score |
---
## Recommended Settings
### For Crypto (BTC, ETH, Altcoins)
- **Timeframe:** 1H or 4H
- **HTF:** 4H or Daily
- **Use Logarithmic Fibs:** ✅ ON
- **TP R:R Target:** 2.0 - 3.0
### For Forex
- **Timeframe:** 15m or 1H
- **HTF:** 4H
- **Use Logarithmic Fibs:** ❌ OFF
- **TP R:R Target:** 1.5 - 2.0
### For Stocks
- **Timeframe:** 1H or Daily
- **HTF:** Daily or Weekly
- **Use Logarithmic Fibs:** ✅ ON
- **TP R:R Target:** 2.0
---
## Settings Reference
### Structure (ZigZag)
- **Left Bars:** Lookback period for pivot detection (default: 10)
- **Right Bars:** Confirmation bars (default: 2)
- **Show Swing Labels:** Display HH/HL/LH/LL markers
### Multi-Timeframe Confluence
- **Enable MTF Filter:** Only trade when aligned with HTF trend
- **Higher Timeframe:** The timeframe to check trend (default: 4H)
### ADX Trend Strength
- **Enable ADX Filter:** Filter out choppy/ranging markets
- **ADX Threshold:** Minimum ADX value for trend confirmation (default: 20)
### Auto Fib Settings
- **Use Logarithmic Fibs:** Better for large % moves (crypto/stocks)
- **Fib Length:** How far the fib lines extend
### Split-Entry Trade Planner
- **Entry 1 Ratio:** FOMO level (default: 0.618)
- **Entry 2 Ratio:** ENTRY level (default: 0.786)
- **TP Calculation Mode:** Base TP on ENTRY, FOMO, or Average
- **TP R:R Target:** Your desired risk-to-reward ratio
- **Use ATR-Based Dynamic SL:** Volatility-adjusted stop loss
- **SL ATR Multiplier:** How many ATRs below entry for SL
### Williams Vix Fix
- **Show Bullish/Bearish AE:** Aggressive entry signals based on volatility extremes
- **Only Show in Golden Zone:** Filter VixFix signals to golden zone only
---
## Pro Tips
### 1. The Liquidity Sweep is Gold
When you see the **LIQ** arrow after price wicks below 0.886 and reclaims 0.786, this is often the best entry. Stops have been hunted, weak hands are out, and smart money is entering.
### 2. Don't Fight the HTF Trend
If the 4H is bearish, don't take long signals on the 15m just because the score is high. Always align with the bigger picture.
### 3. Wait for "IN ZONE"
Patience pays. The best setups come when price actually pulls back to the golden zone. Chasing breakouts leads to poor R:R.
### 4. Score 6+ is the Minimum
Scores of 4-5 can work, but your win rate will be significantly higher waiting for 6+. Scores of 8+ are rare but highly reliable.
### 5. Use Multiple Timeframes
Check the setup on your trading timeframe AND one timeframe higher. If both show bullish structure with good scores, confidence is higher.
### 6. Respect the Stop Loss
The SL is placed below the liquidity zone for a reason. If price closes below it, the setup is invalidated. Don't move your stop.
---
## Alerts Available
- **High Confluence Long/Short** — When score reaches your threshold
- **Bullish/Bearish Liquidity Sweep** — Premium reversal signal
- **RSI Divergence Detected** — Divergence in golden zone
- **Williams Vix Fix AE** — Aggressive entry signal
---
## Credits
Created by **Cosmic Crypto**
Combines concepts from:
- Fibonacci Retracement Trading
- Smart Money Concepts (Liquidity Sweeps)
- Williams Vix Fix
- Multi-Timeframe Analysis
- Stochastic RSI
- ADX Trend Strength
---
*Trade responsibly. Past performance does not guarantee future results. Always use proper risk management.*
Retracementlevels

Fibonacci Range Detector ║ BullVision🔬 Overview
The Fibonacci Range Mapper is a dynamic technical tool designed to identify, track, and visualize price ranges using Fibonacci levels. Whether you're trading manually or prefer automated structure recognition, this indicator helps you contextualize market moves and locate key price zones with precision.
⚙️ Core Logic
🔍 Range Detection (Auto & Manual Modes)
In Auto mode, the indicator uses an advanced ZigZag system based on ATR or percentage thresholds to confirm market swings and construct Fibonacci-based ranges.
In Manual mode, traders can define their own swing low and high to generate precise custom ranges.
📐 Fibonacci Mapping
Each detected range is automatically plotted with key Fibonacci retracement levels — 0%, 25%, 50%, 75%, 100% — along with optional extensions (127.2% and 161.8%) to anticipate price continuations or reversals.
📋 Live Data Table
An integrated info panel dynamically displays crucial metrics:
• Range size
• Current price zone (Discount / Mid / Premium)
• Position within range (%)
• Distance to range extremes
• Range status (Pending or Confirmed)
🕰️ Historical Memory
Up to 20 past ranges can be stored and visualized simultaneously, helping traders recognize repeated price behaviors and contextual support/resistance levels.
🎨 Visual Highlights
Zones of interest (0–25% = Discount, 75–100% = Premium) are color-coded with custom transparency, and labels can be toggled for clarity. The current active range updates in real time as structure evolves.
🔧 User Customization
• Detection Method: Choose between ATR or % ZigZag for automated swing identification
• Confirmation Delay: Set how many bars to wait before confirming a new high
• Manual Overrides: Select exact price levels when you want full control
• Extensions & Labels: Toggle additional lines and info to suit your charting style
• Visual Table Position: Customize where the data table appears on screen
• Color Scheme: Define your own zone gradients for better visual interpretation
📈 Use Cases
This indicator is ideal for traders who want to:
• Identify value zones within local or macro price structures
• Plan trades around Fibonacci retracement and extension levels
• Detect shifts in market structure using an adaptive ZigZag logic
• Track recurring price ranges and historical reaction points
• Enhance technical confluence with clean, visual price mapping
⚠️ Important Notes
This tool is not a buy/sell signal generator — it is a visual framework for structure-based analysis.
Use it in conjunction with your existing strategy and risk management process.
Always confirm with broader context and multi-timeframe alignment.

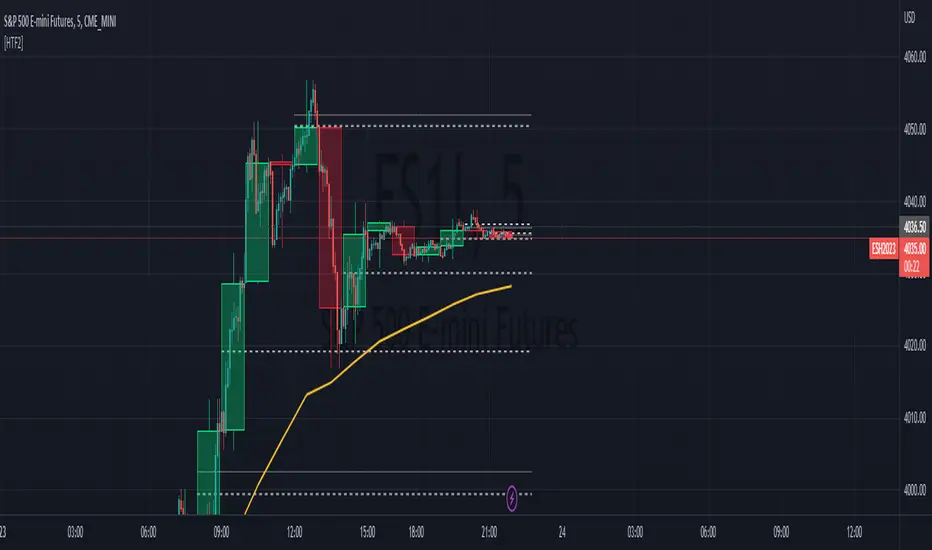
HTF Tool 2HTF Tool 2: Because the previous version was removed for being too powerful.
HTF Tool allows Users to display Higher Timeframe(HTF) Candles on their Chart with retracement lines drawn from the (High/Low) range of the HTF candle, as well as a live HTF MA.
This indicator perfectly handles Requested data to display a non-lagging HTF Moving Average(MA) by bridging a solid historical data stream with the live data stream.
This is done by offsetting plot data backwards to the middle of the last HTF candle, and then drawing a line from the last candle middle, to the live candle middle.
I have manipulated the data display to give the appearance that it consists of only 1 plot line, Whereas in reality, The HTF MA consists of 3 different processes:
- 1 historical plot value, to display the (correct) historical EMA with the same plot points you would see on the HTF chart from the same ema.
- 1 live line, re-drawn at every tick to mimic the way plot values move around while the bar is live.
- 1 live plot value, that is only displayed as a number on the status line and price scale to make it look like these are the outputs from the constantly redrawing line.
Because of this, This indicator displays the exact same way you would see this data on the requested timeframe's chart .
Note: You will see 2 values on the status line, these are the Historic MA, and Live MA values (Left, Right).
When hovering over historic values, a Historic MA value will only display in the middle of the HTF bars (same bar as the HTF wick)
This indicator include:
- HTF Candles, Drawn in the Traditional Candlestick Fashion.
- A User Adjustable HTF EMA / SMA , This Moving Average is accurate the the display you would see on a HTF chart.
- User Adjustable Retracement lines, up to 3 levels. These levels dynamically delete when price crosses them.
- Adjustable Display Range to display more or less HTF candles.
- Toggleable "Safe Mode" to keep the indicator display looking clean at all times.*
All Colors are Customizable to fit your layout style (Candle, Levels, HTF MA)
*Safe mode checks that your current chart's timeframe cleanly multiplies into your requested timeframe an odd number of times. This keeps the HTF candle wicks perfectly centered, and keeps the candle body width perfectly consistent.
If you choose to turn safe mode off here are some things to consider:
All Vertical data is consistent with the HTF requested , ONLY the horizontal alignment of the indicator will be thrown off.
When on low timeframes requesting other relatively low timeframes these issues are extremely more apparent than when requesting substantially larger timeframes.
Example: Safe Mode will likely need to be turned off for any 4h chart request, but as seen in the following image, the bars still look very normal.
Note: If you ONLY want to see the Levels and Moving Average... You ARE capable of requesting the current chart's timeframe. If you do this, the indicator will stop drawing the HTF candles, since your chart already shows that timeframe's candles.
Enjoy!
Martyv Auto Fib Retracement with Logarithmic SupportSimple & easy auto-fib levels. Took the out-of-the-box version provided by TradingView and added Logarithmic support and a nicer palette, and made the controls a bit nicer to use (in my opinion lol). Enjoy.

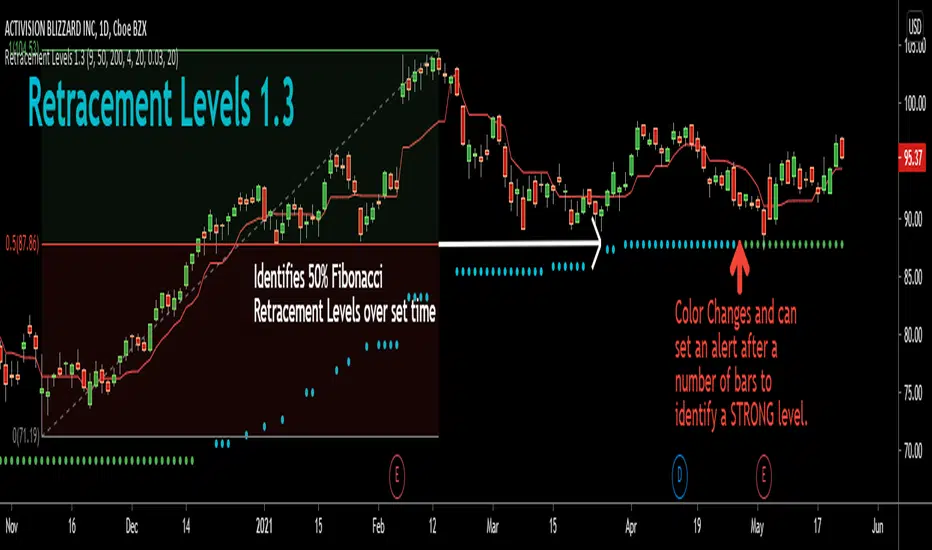
Retracement Levels 1.1This indicator automatically draws the 50% retracement of large moves on a chart. The default setting is 200 bars.
Out of all the Fibonacci levels the simplest and the one I find most profitable is the 50% level. Very often price will respect this level and when combined with key Support/Resistance levels, other indicators, and/or price action study it can be a powerful tool for high probability trades.
The default blue dots follow price with a rolling median based on the major high and major low of the bar setting. The multiplier extends this evaluation even higher with grey and red levels that form on much higher timeframe 50% levels.
Look back on a chart to see how often price respects this key level! You'll never trade without knowledge of it once you've seen it!
Fast ROI checker 50% Gann RetracementThis script is based on the Gann's 50% Retracement rule.
First, the ATH (All Time High) and ATL (All Time Low) are calculated; then, the 50% retracement level is found.
With this 50% level, we'll calculate the maximum price entry to keep a ROI which is set in the parameters.
For exemple, I only want to buy assets which can make a x16 before the 50% retracement , the script will calculate the maximum entry to respect this ROI .
If the Max entry price is above the ATL , the line will be green; if not, the line will be red.
To faster the search in the watchlist, when the price is between the Max Entry line and the ATL line, the background is painted in green.
It's not an investment strategy, you have to find your proper indicators to make purchases.
Enjoy !

Automatic Fibonacci Retracements [MS]Automatic Fibonacci Retracement Level indicator for any time frame, any asset.
Simple to use, just add to your chart and set the size of retracements you want to see.
Fib levels keep drawing in real time until the next low or high is found to start drawing the next fib.
Settings Include
• Fib size
• Show prices
• Draw low-to-high or high-to-low
• Toggle fib levels
Use the link below or PM us to obtain access to this indicator.

Magick CloudA leading indicator that predicts future price action and shows support and resistance.
Magick Cloud projects 21 bars into the future and uses Fibonacci to predict the targets.
A refreshed version of sKrypt Cloud made by @writner.
Created after testing ~8693 script versions in total and a month of hard work.
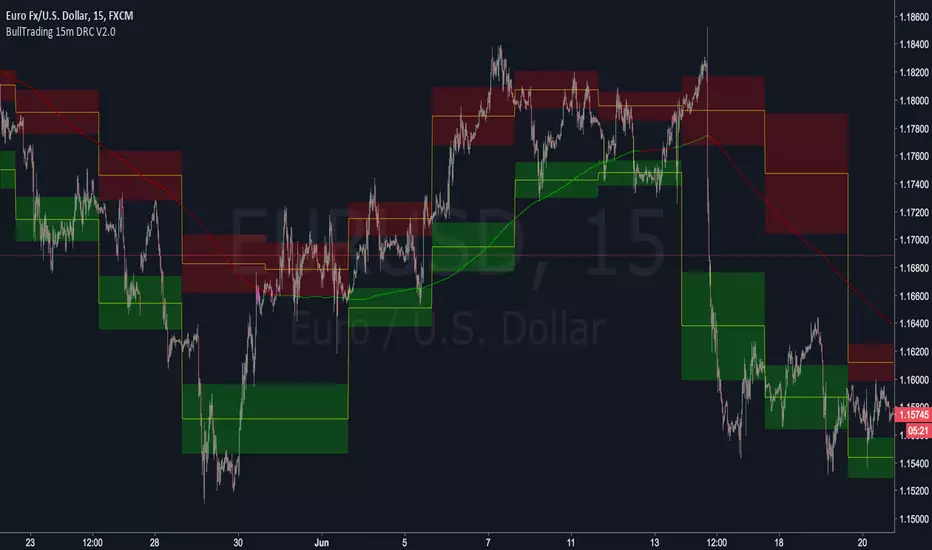
BullTrading 15 Min Daily Retracement Channel V2.0Hi Traders, I have been received tons of private messages asking me access to my previous scripts. Please let me apologize for not being able to answer all messages. Once you publish a script in Tradingview you can manage individual access to the script but there is no option to open the script after being published.
For that reason I decided to open this script for you, this indicator implements many of the best features contained in previous "invite only scripts". It is designed to display alerts for day trading and short term swings using the 15m Timeframe.
How to use "BullTrading 15 Min Daily Retracement Channel V2.0" indicator?
This indicator is experimental but works if the trader applies good judgment and risk management. Neither myself or BullTrading Asset Management is or will be responsible for any live trading loss using this script, so please use it on Demo.
ALWAYS USE PENDING ORDERS!! It is always much better to wait price using your Fibonacci Retracement tool or the indicator reference lines.
Set Buy signals AT THE CLOSE of yellow candlesticks.
Set Sell signals AT THE CLOSE of fuchsia candlesticks.
Most of the time Buy/Sell signals will react with too much anticipation so you can wait for the price to form enough fractals in order to analyze your entry levels, risk management, SL's and TP's.
AVOID AT ALL COSTS to enter the market immediately after a signal. WAIT for fractal formations to confirm reversals. I will say it AGAIN: Use only pending orders and AVOID market execution orders!
If your order is already filled and the moving average changes color or the price consolidates in your entry level it is better to trail tight your SL, exit the trade with small loss or Break Even instead of waiting for a full Stop Loss exit (this conditions usually indicate trend continuations against the indicator signals).
If the market goes against the signal, THINK and use the indicator lines and channels to match a level using your Fib retracement tool. Applying this criteria will lead for better entry levels in the opposite direction.
Feel free to comment suggestions.
Best Regards
GustavoRubi
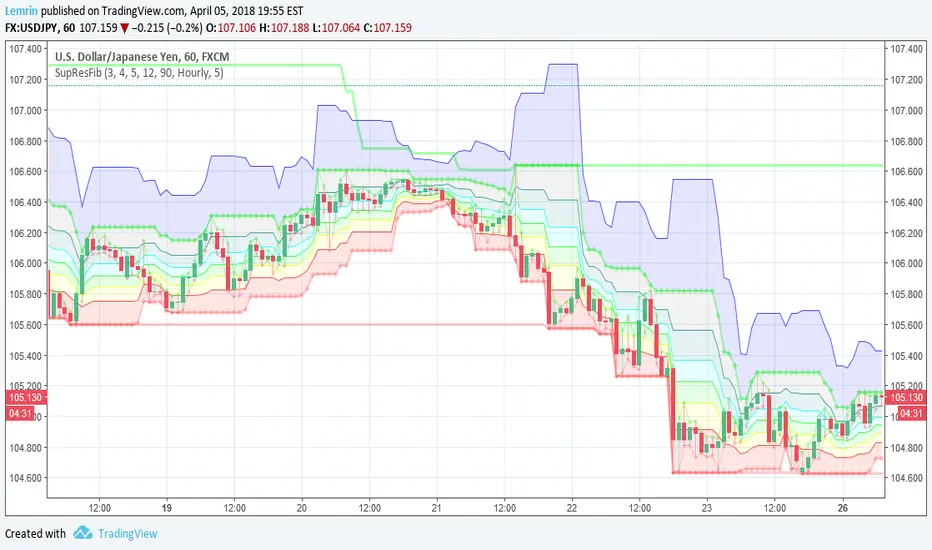
Automatic Support, Resistance, Fibonacci LevelsThis indicator plots absolute high and low values for up to five completely adjustable time periods (in months, weeks, days, hours, minutes) and optionally calculates the Fibonacci levels on the pair of absolutes of your choice, ascending or descending, and mimics the shading available in the built-in Fib charting tools (e.g. retracement).
Here are a few screenshots of the same chart with various options selected.
3-Month, 4-Week, and 5-Day absolutes with 3-Monthly Fib plotted:
The same chart with 4-Weekly Fib:
The same chart with 5-Daily Fib:
5-Day, 12-Hour, 90-Minute absolutes with 12-Hourly Fib:
Zoomed in, on a 30-minute interval, with 90-minute Fib:
With descending ("inverted") 90-minute Fib:
I started putting this together for Vazzyb, who was looking for a way to automate plotting horizontal support and resistance levels for monthly, weekly, and daily extremes, and then I added additional features as they occurred to me. Special thanks to Paaax, who suggested I add Fib levels.
I am leaving the code open, so you may feel free to grab snippets you like and use them for your own purposes. Of particular interest may be my custom "calc_fib()" function, which accepts any series pair, as well as a Boolean indicating whether to invert, and returns an array with each of the major Fibonacci levels: .
If anyone likes this enough to feel generous, please feel free:
BTC
3KmFchJ18QvMzAJKDcFQXvyK9p1EHWQdhP
BCH
qqtrw64ptuwprk5vtj3z8qwkvh3v0jawxq7khqng7x
ETH
0x9b51361A278910Ba3945C7519C9f0FA8a77df18d
LTC
MDeWWsP7XCG2zQuZ2dYALZXQ52u2qkc8fh
P.S. If you want the time lengths to be as close to accurate as possible, don't forget to change the number of days per week when using for cryptocurrency!