Combo Strategy 123 Reversal & Donchian Channel WidthThis is combo strategies for get a cumulative signal.
First strategy
This System was created from the Book "How I Tripled My Money In The
Futures Market" by Ulf Jensen, Page 183. This is reverse type of strategies.
The strategy buys at market, if close price is higher than the previous close
during 2 days and the meaning of 9-days Stochastic Slow Oscillator is lower than 50.
The strategy sells at market, if close price is lower than the previous close price
during 2 days and the meaning of 9-days Stochastic Fast Oscillator is higher than 50.
Second strategy
The Donchian Channel was developed by Richard Donchian and it could be compared
to the Bollinger Bands. When it comes to volatility analysis, the Donchian Channel
Width was created in the same way as the Bollinger Bandwidth technical indicator was.
As was mentioned above the Donchian Channel Width is used in technical analysis to measure
volatility. Volatility is one of the most important parameters in technical analysis.
A price trend is not just about a price change. It is also about volume traded during this
price change and volatility of a this price change. When a technical analyst focuses his/her
attention solely on price analysis by ignoring volume and volatility, he/she only sees a part
of a complete picture only. This could lead to a situation when a trader may miss something and
lose money. Lets take a look at a simple example how volatility may help a trader:
Most of the price based technical indicators are lagging indicators.
When price moves on low volatility, it takes time for a price trend to change its direction and
it could be ok to have some lag in an indicator.
When price moves on high volatility, a price trend changes its direction faster and stronger.
An indicator's lag acceptable under low volatility could be financially suicidal now - Buy/Sell signals could be generated when it is already too late.
Another use of volatility - very popular one - it is to adapt a stop loss strategy to it:
Smaller stop-loss recommended in low volatility periods. If it is not done, a stop-loss could
be generated when it is too late.
Bigger stop-loss recommended in high volatility periods. If it is not done, a stop-loss could
be triggered too often and you may miss good trades.
WARNING:
- For purpose educate only
- This script to change bars colors.
Reversal

Volatitity Bands (STARC) on RSI for reversal warning [beta]Origin : The Indicator uses STARC volatilty bands created by Manning Stoller, based on ATR.
He perfered them to Bollinger because extreme price action never exceeds them.
Her former scholar and now TA Superstar Constance Brown applied them on RSI for getting
very relavant trend reversals. (She only used them in times when "overbought or not" becomes a severe question.
What it does: It delivers a reversal signal after rsi exceeded the bands and - as the bands resume the trend - the rsi fails to test the band once more. This is the moment of a reversal warning.
How to work wit h:
- Take the index of your interest and choose a time horizon one or two scales higher than your usual working horizon .(i.e if you work on Daily choose weekly).
-Scale the upper and the lower band via settings, so that the rsi only in rare cases exceeds or touches the bands. This is to tweak the reversal threshold. (For weekly SPX i am fine with 2.2 and 2.1)
- Find the arrows that mark possible reversals.
- Ready
Note: I called this a beta because i publish it with nearly no practical experience with it , just checked the formal correctness of the code. (Published so fast because it was written during the coronavirus days, for which to handle it might be helpful. )So feedback very welcome.
I took the formula in slight modification from the book "Technical Analysis for the Trading Professional", 2nd edition, by Constance Brown.
"Fun" Note: As you see the script would have warned before the corona selling - if you had used it.
I didn't because bull flags and all predicted nice weather...
Greets and again feedback welcome
yoxxx

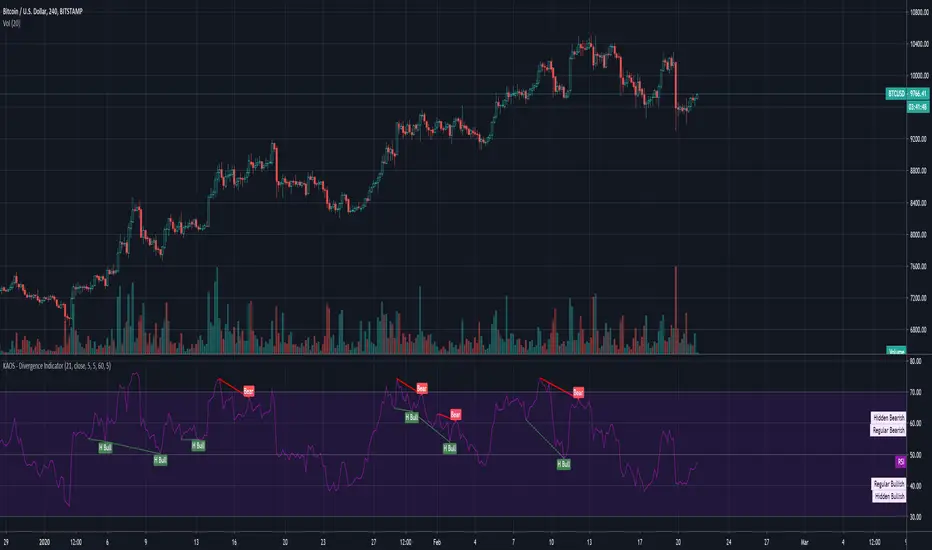
KAOS - Divergence IndicatorDivergence Indicator... Works pretty well, Use with caution as it does amend itself depending on market whale activity.
1hr, 4hr and Daily good for macro movements.
Should be used a supplemental indicator to your over all strategy NOT as a entry exit.
Have fun :)
Made by someone else, but has been tweaked with better settings
Combo Strategy 123 Reversal & CMOaDisparity Index This is combo strategies for get a cumulative signal.
First strategy
This System was created from the Book "How I Tripled My Money In The
Futures Market" by Ulf Jensen, Page 183. This is reverse type of strategies.
The strategy buys at market, if close price is higher than the previous close
during 2 days and the meaning of 9-days Stochastic Slow Oscillator is lower than 50.
The strategy sells at market, if close price is lower than the previous close price
during 2 days and the meaning of 9-days Stochastic Fast Oscillator is higher than 50.
Second strategy
The related CMO Disparity Index article is copyrighted material from Stocks & Commodities Dec 2009
My strategy modification.
WARNING:
- For purpose educate only
- This script to change bars colors.
Combo Strategy 123 Reversal & Directional Trend Index (DTI) This is combo strategies for get a cumulative signal.
First strategy
This System was created from the Book "How I Tripled My Money In The
Futures Market" by Ulf Jensen, Page 183. This is reverse type of strategies.
The strategy buys at market, if close price is higher than the previous close
during 2 days and the meaning of 9-days Stochastic Slow Oscillator is lower than 50.
The strategy sells at market, if close price is lower than the previous close price
during 2 days and the meaning of 9-days Stochastic Fast Oscillator is higher than 50.
Second strategy
This technique was described by William Blau in his book "Momentum,
Direction and Divergence" (1995). His book focuses on three key aspects
of trading: momentum, direction and divergence. Blau, who was an electrical
engineer before becoming a trader, thoroughly examines the relationship between
price and momentum in step-by-step examples. From this grounding, he then looks
at the deficiencies in other oscillators and introduces some innovative techniques,
including a fresh twist on Stochastics. On directional issues, he analyzes the
intricacies of ADX and offers a unique approach to help define trending and
non-trending periods.
Directional Trend Index is an indicator similar to DM+ developed by Welles Wilder.
The DM+ (a part of Directional Movement System which includes both DM+ and
DM- indicators) indicator helps determine if a security is "trending." William
Blau added to it a zeroline, relative to which the indicator is deemed positive or
negative. A stable uptrend is a period when the DTI value is positive and rising, a
downtrend when it is negative and falling.
WARNING:
- For purpose educate only
- This script to change bars colors.

Combo Strategy 123 Reversal & DiNapoli Detrended Oscillator This is combo strategies for get a cumulative signal.
First strategy
This System was created from the Book "How I Tripled My Money In The
Futures Market" by Ulf Jensen, Page 183. This is reverse type of strategies.
The strategy buys at market, if close price is higher than the previous close
during 2 days and the meaning of 9-days Stochastic Slow Oscillator is lower than 50.
The strategy sells at market, if close price is lower than the previous close price
during 2 days and the meaning of 9-days Stochastic Fast Oscillator is higher than 50.
Second strategy
DiNapoli Detrended Oscillator Strategy
WARNING:
- For purpose educate only
- This script to change bars colors.

Trend strenght by GrumlopThis indicator helps u to determine the strength and possible reversal of a trend. I prefer to use this indicator together with a mwvap indicator and standalone for possible divergence.

[KICK] Smart OBVCD DivergencesThis indicator is part of a pair of indicators that make it easier to spot divergences in On Balance Volume , but make the calculations using a unique method. THIS ONE IS IN THE UPPER (PRICE ACTION) PANE OF THE SAMPLE CHART.
Volume is segmented into buy or sell volume by analyzing smaller timeframes (down to 1 minute)
The sell vs. buy volume is calculated as a running total (as per normal OBV calculations)
The Convergence/Divergence of the OBV Buy and Sell volumes are calculated and smoothed with 3rd generation averaging methods
The Smart OBVCD indicator (THE RELATED INDICATOR) visualizes the above calculation on a histogram to make it easier to see the values and how they relate to the price action.
The Smart OBVCD Divergence indicator (THIS ONE) plots Regular and Hidden Bullish and Bearish divergence on higher timeframes based on the calculations and also provides early “warnings” for unconfirmed divergences forming (note: these are unconfirmed because the higher high or lower low have now yet been confirmed on the higher timeframe).
Use the link below to watch a tutorial video, request a trial, or purchase for access.

Expansion Top/Bottom (Expo) Expansion Top/Bottom (Expo)
DESCRIPTION
Expansion Top/Bottom (Expo) indicator is a powerful oscillator that visualizes temporary Top/Bottom as well as trend shifts. When the market moves boldly a histogram will be formed in the indicator which indicates that the movement might be at its end. It's always a great idea to lock in some profit when we get these histograms. These ‘Lock-in’ profits points are visualized by a cross.
The professional trader has the ability to adjust the length of the calculation. A longer length means that the indicator spots broader market shifts. A short length means that the indicator spots temporary tops/bottoms.
Use the indicator in combination with other signals and analysis techniques.
HOW TO USE
1. Use the indicator to identify temporary tops/bottoms.
2. Use the indicator to identify broader tops/bottoms.
3. Use the indicator to visualize the trend.
4. Use the indicator to visualize ‘Lock-In’ profit points.
INDICATOR IN ACTION
Short length (Length = 14)
BTCUSD
EURUSD
BRENT
BRENT
BTCUSD
Long length (Length = 50)
BRENT
EURUSD
BTCUSD
The indicator works with RENKO, HEIKIN ASHI and with KAGI charts as well.
I hope you find this indicator useful, and please comment or contact me if you like the script or have any questions/suggestions for future improvements. Thanks!
I will continue to work on this indicator, so please share your experience and feedback with me so that I can continuously improve it. Thanks to everyone that have contacted me regarding my scripts. Your feedback is valuable for future developments!
ACCESS THE INDICATOR
• Contact me on TradingView or use the links below.
• I have started to publish private scripts which are not visible on my profile. However, if you're interested to know more about these scripts, drop me a message at my webpage and I will show you these scripts as well. The rationale behind publishing these scrips as private is that I don't want them to be indexed in search engines.
-----------------
Disclaimer
Copyright by Zeiierman.
The information contained in my scripts/indicators/ideas does not constitute financial advice or a solicitation to buy or sell any securities of any type. I will not accept liability for any loss or damage, including without limitation any loss of profit, which may arise directly or indirectly from use of or reliance on such information.
All investments involve risk, and the past performance of a security, industry, sector, market, financial product, trading strategy, or individual’s trading does not guarantee future results or returns. Investors are fully responsible for any investment decisions they make. Such decisions should be based solely on an evaluation of their financial circumstances, investment objectives, risk tolerance, and liquidity needs.
My scripts/indicators/ideas are only for educational purposes!

Uber REX Oscillator [UTS]The Rex Oscillator measures market behavior based on the relationship of the close to the open, high and low values of the same bar. A big difference between the high and close on a bar indicates weakness, and wide disparity between the low and close indicates strength. The difference between open and close also indicates market performance.
When the Rex Oscillator turns positive in a bearish trend, a reversal is indicated. Likewise, Rex turning negative in a bull market indicates a reversal to the downside.
General Usage
The Rex Oscillator is mostly used as a Reversal and Exit indicator.
Signals are created when Rex is crossing the Signal line. They that can be used to EXIT or LONG/SHORT a trade.
It is worth investing the time and fine-tune the settings: e.g. SuperSmoothed 16 and HMA 40 provides decent results.
Moving Averages
16 different Moving Averages are available:
ALMA (Arnaud Legoux Moving Average)
DEMA (Double Exponential Moving Average)
EMA (Exponential Moving Average)
FRAMA (Fractal Adaptive Moving Average)
HMA (Hull Moving Average)
JURIK (Jurik Moving Average)
KAMA (Kaufman Adaptive Moving Average)
Kijun (Kijun-sen / Tenkan-sen of Ichimoku)
LSMA (Least Square Moving Average)
RMA (Running Moving Average)
SMA (Simple Moving Average)
SuperSmoothed (Super Smoothed Moving Average)
TEMA (Triple Exponential Moving Average)
VWMA (Volume Weighted Moving Average)
WMA (Weighted Moving Average)
ZLEMA (Zero Lag Moving Average)
A freely determinable length allows for sensitivity adjustments that fits your own requirements.
Alerts
Traders can easily use the reversal signal to trigger alerts from:
Cross Up
Cross Down
Those values are > zero if a condition is triggered.
Alert condition example: "Cross Up" - "Greater Than" - "0"
Trend Visualization
Optional: If the signal line trend direction is DOWN it is painted red. If the trend direction is UP the signal line is painted in green.

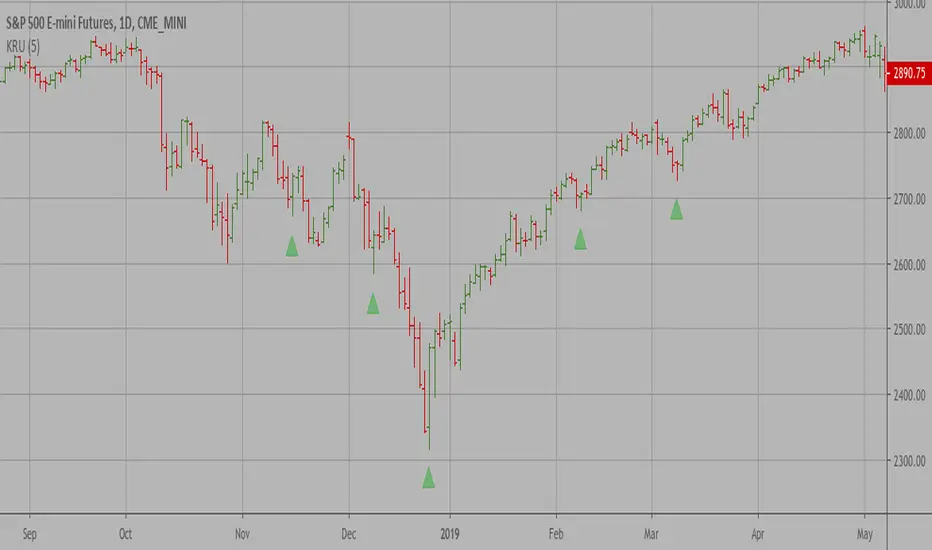
Key Reversal Up A key reversal is a one-day trading pattern that may signal the reversal of a trend.
Other frequently-used names for key reversal include "one-day reversal" and "reversal day."
How Does a Key Reversal Work?
Depending on which way the stock is trending, a key reversal day occurs when:
In an uptrend -- prices hit a new high and then close near the previous day's lows.
In a downtrend -- prices hit a new low, but close near the previous day's highs
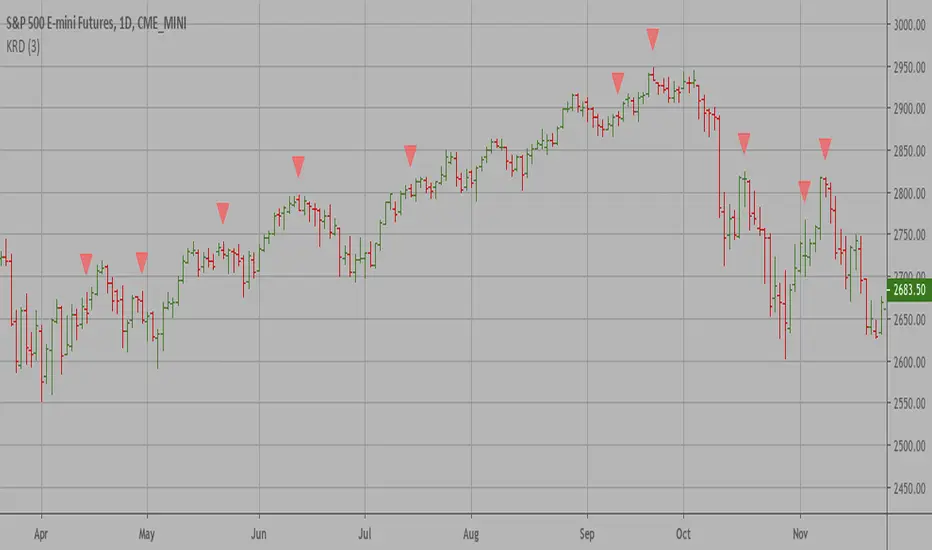
Key Reversal Down A key reversal is a one-day trading pattern that may signal the reversal of a trend.
Other frequently-used names for key reversal include "one-day reversal" and "reversal day."
How Does a Key Reversal Work?
Depending on which way the stock is trending, a key reversal day occurs when:
In an uptrend -- prices hit a new high and then close near the previous day's lows.
In a downtrend -- prices hit a new low, but close near the previous day's highs
Reflex Oscillator - Dr. John EhlersHot off the press, I present this NEW "Reflex Oscillator" employing PSv4.0, originally formulated by Dr. John Ehlers for TASC - February 2020 Traders Tips. John Ehlers might describe it's novel characteristics as being a reversal sensitive near zero-lag averaging indicator retaining the CYCLE component. Also, I would add that irregardless of the sampling interval, this indicator has a bound range between +/-2.0 on "1 second" candles all the way up to "1 month" candle durations. This indicator also has a companion indicator entitled "TrendFlex Oscillator". I have published it in tandem with this one in my scripts profile.
One notable difference between this and the original formulation is that I have added an independent control for the Super Smoother. This "tweak" is enabled by applying the override and adjusting it's period. There is a "Post Smooth" input() that "tweaks" the internal Reflex EMA too. Keep in mind that my intention of adding tweaks is solely for experimentation with the original formulation.
I also added adjustable levels for those of you that may wish to employ alertcondition()s to this indicator somehow. Providing a more utilitarian approach, I created this with an easy to use reusable function named reflex(). As always, I have included advanced Pine programming techniques that conform to proper "Pine Etiquette". Being this is one of John Ehlers' first two simultaneously released indicators for 2020, I felt a few more bells and whistles were appropriate as a proper contribution to the Tradingview community.
Features List Includes:
Dark Background - Easily disabled in indicator Settings->Style for "Light" charts or with Pine commenting
AND much, much more... You have the source!
The comments section below is solely just for commenting and other remarks, ideas, compliments, etc... regarding only this indicator, not others. When available time provides itself, I will consider your inquiries, thoughts, and concepts presented below in the comments section, should you have any questions or comments regarding this indicator. When my indicators achieve more prevalent use by TV members, I may implement more ideas when they present themselves as worthy additions. As always, "Like" it if you simply just like it with a proper thumbs up, and also return to my scripts list occasionally for additional postings. Have a profitable future everyone!

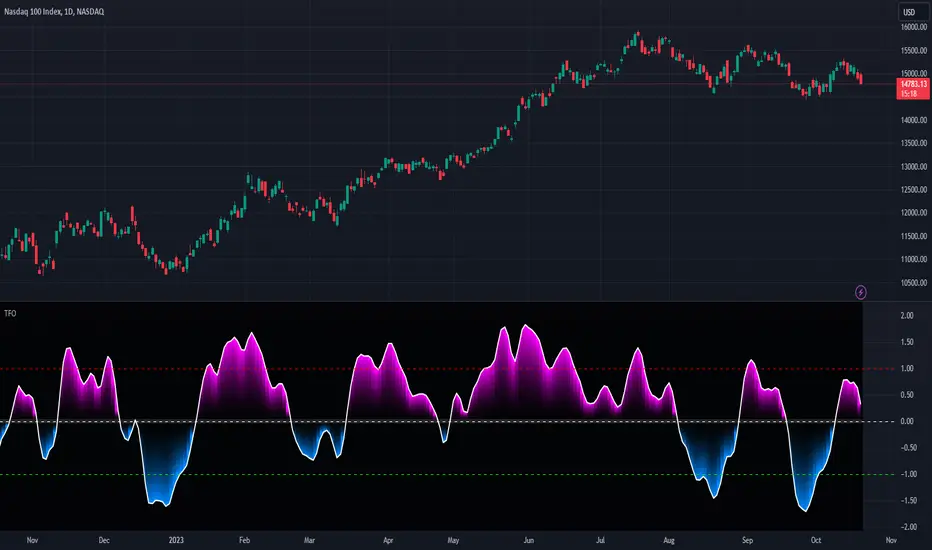
TrendFlex Oscillator - Dr. John EhlersHot off the press, I present this NEW "TrendFlex Oscillator" employing PSv4.0, originally formulated by Dr. John Ehlers for TASC - February 2020 Traders Tips. John Ehlers might describe it's novel characteristics as being a reversal sensitive near zero-lag averaging indicator retaining the TREND component. Also, I would add that irregardless of the sampling interval, this indicator has a bound range between +/-2.0 on "1 second" candles all the way up to "1 month" candle durations. This indicator also has a companion indicator entitled "Reflex Oscillator". I have published it in tandem with this one in my scripts profile.
One notable difference between this and the original formulation is that I have added an independent control for the Super Smoother. This "tweak" is enabled by applying the override and adjusting it's period. There is a "Post Smooth" input() that "tweaks" the internal TrendFlex EMA too. Keep in mind that my intention of adding tweaks is solely for experimentation with the original formulation.
I also added adjustable levels for those of you that may wish to employ alertcondition()s to this indicator somehow. Providing a more utilitarian approach, I created this with an easy to use reusable function named trendflex(). As always, I have included advanced Pine programming techniques that conform to proper "Pine Ettiquette". Being this is one of John Ehlers' first two simultaneously released indicators for 2020, I felt a few more bells and whistles were appropriate as a proper contribution to the Tradingview community.
Features List Includes:
Dark Background - Easily disabled in indicator Settings->Style for "Light" charts or with Pine commenting
AND much, much more... You have the source!
The comments section below is solely just for commenting and other remarks, ideas, compliments, etc... regarding only this indicator, not others. When available time provides itself, I will consider your inquiries, thoughts, and concepts presented below in the comments section, should you have any questions or comments regarding this indicator. When my indicators achieve more prevalent use by TV members, I may implement more ideas when they present themselves as worthy additions. As always, "Like" it if you simply just like it with a proper thumbs up, and also return to my scripts list occasionally for additional postings. Have a profitable future everyone!
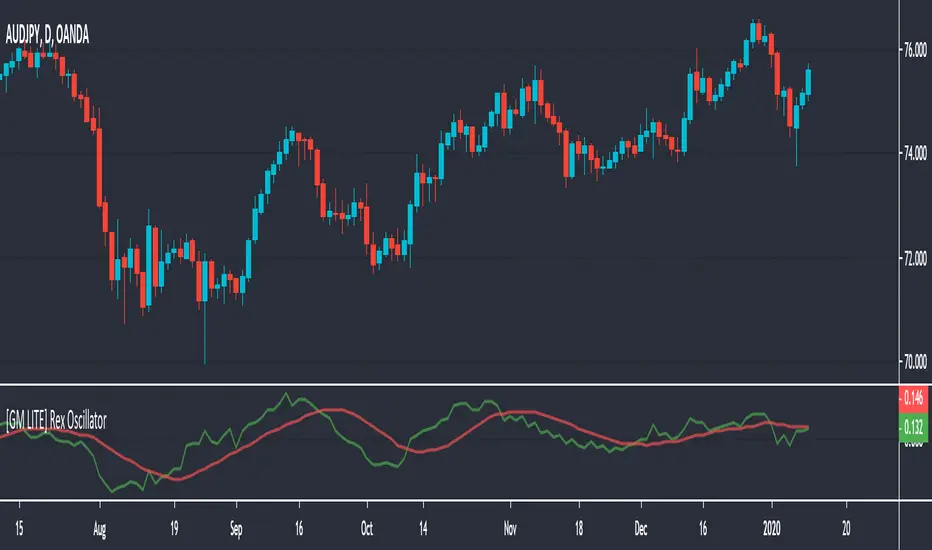
[GM LITE] Rex OscillatorThe Rex oscillator measures market behavior based on the relationship of the close to the open, high and low values of the same bar. A big difference between the high and close on a bar indicates weakness, and wide disparity between the low and close indicates strength. The difference between open and close also indicates market performance.
The True Value of a Bar (TVB) gives an indication of how healthy the market is. A negative close and a positive TVB (or vice versa) is an indication of the market building strength on the opposing side of the trend. The Rex oscillator is a moving average (SMA, EMA, WMA or SMMA) of the TVB value with the specified period.
This is a direct conversion of the MT4 MQL script.
The MA Settings are as follows
0 - SMA
1 - EMA
2 - SMMA
3 - LWMA
Usage - two lines cross = entry or exit signal.
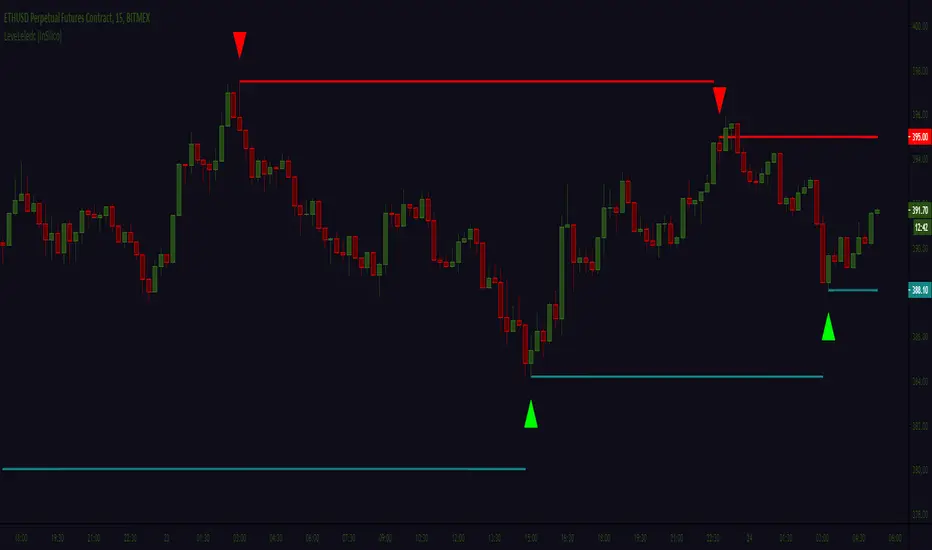
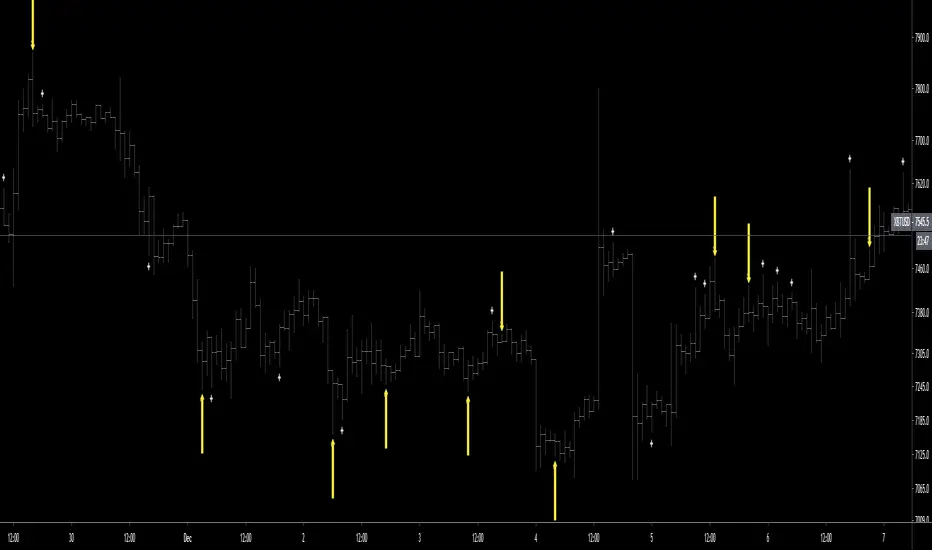
Leledc levels (IS) LeveLeledc - Exhaustion levels (InSilico)
Method for zero confirmation support/resistance level detection using Leledc Exhaustion Bars
Study is extension/mod of glaz script ,its implementing simple but unorthodox use-case for "Leledc Exhaustion Bars"
More information on core function in source scripts page ->
P.s Written quickly and spontaneously
Combo Strategy 123 Detrended Price Oscillator This is combo strategies for get a cumulative signal.
First strategy
This System was created from the Book "How I Tripled My Money In The
Futures Market" by Ulf Jensen, Page 183. This is reverse type of strategies.
The strategy buys at market, if close price is higher than the previous close
during 2 days and the meaning of 9-days Stochastic Slow Oscillator is lower than 50.
The strategy sells at market, if close price is lower than the previous close price
during 2 days and the meaning of 9-days Stochastic Fast Oscillator is higher than 50.
Second strategy
The Detrend Price Osc indicator is similar to a moving average,
in that it filters out trends in prices to more easily identify
cycles. The indicator is an attempt to define cycles in a trend
by drawing a moving average as a horizontal straight line and
placing prices along the line according to their relation to a
moving average. It provides a means of identifying underlying
cycles not apparent when the moving average is viewed within a
price chart. Cycles of a longer duration than the Length (number
of bars used to calculate the Detrend Price Osc) are effectively
filtered or removed by the oscillator.
WARNING:
- For purpose educate only
- This script to change bars colors.
Mk 47 (Width)This is a good divergence indicator, in very short timeframes for the intraday trader who wants to get that bounty.
Ladies and Gentlemen, This is Mark 47.

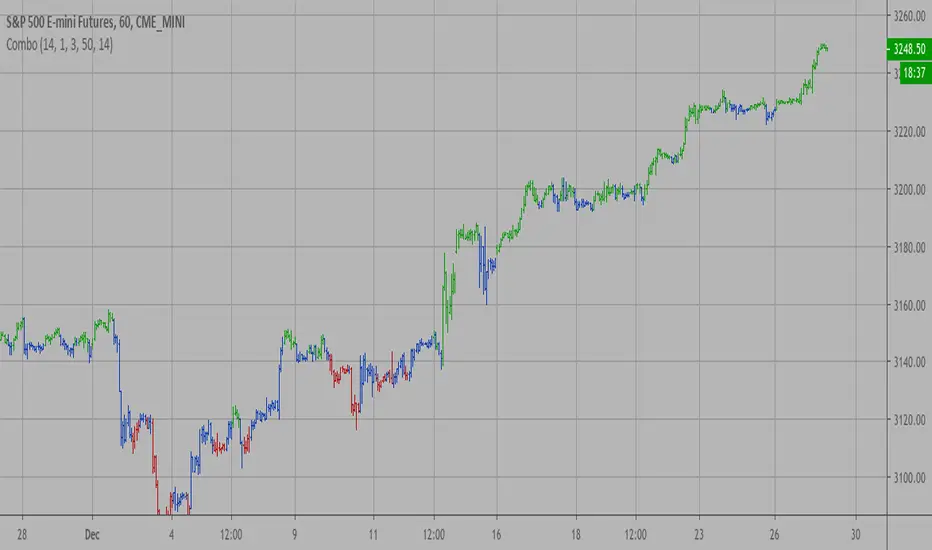
ChaosSN Reversal Signal v2I calculated various metrics to measure exhaustion and mean diversion to plot arrows for a likely reversal point.
Use the input window to tailor the sensitivity of the arrows based on the amount of volatility your chart is experiencing (lower = more sensistive). The most common inputs for me are 8, 13, 21.
v2 Update:
Tweaked under the hood and added some bar colors.
Purple Bar = a secondary reversal indicator. Alignment with an arrow makes it a very strong signal.
Yellow Bar = pause in the action and a large move may occur soon
Combo Strategy 123 Reversal & DAPD This is combo strategies for get a cumulative signal.
First strategy
This System was created from the Book "How I Tripled My Money In The
Futures Market" by Ulf Jensen, Page 183. This is reverse type of strategies.
The strategy buys at market, if close price is higher than the previous close
during 2 days and the meaning of 9-days Stochastic Slow Oscillator is lower than 50.
The strategy sells at market, if close price is lower than the previous close price
during 2 days and the meaning of 9-days Stochastic Fast Oscillator is higher than 50.
Second strategy
This indicator is similar to Bollinger Bands. It based on DAPD - Daily
Average Price Delta. DAPD is based upon a summation for each of the
highs (hod) for the 21 days prior to today minus the summation for
each of the lows (lod) for the last 21 days prior to today. The result
of this calculation would then be divided by 21.
It will be buy when high above previos DAPD high and sell if low below previos DAPD low
WARNING:
- For purpose educate only
- This script to change bars colors.

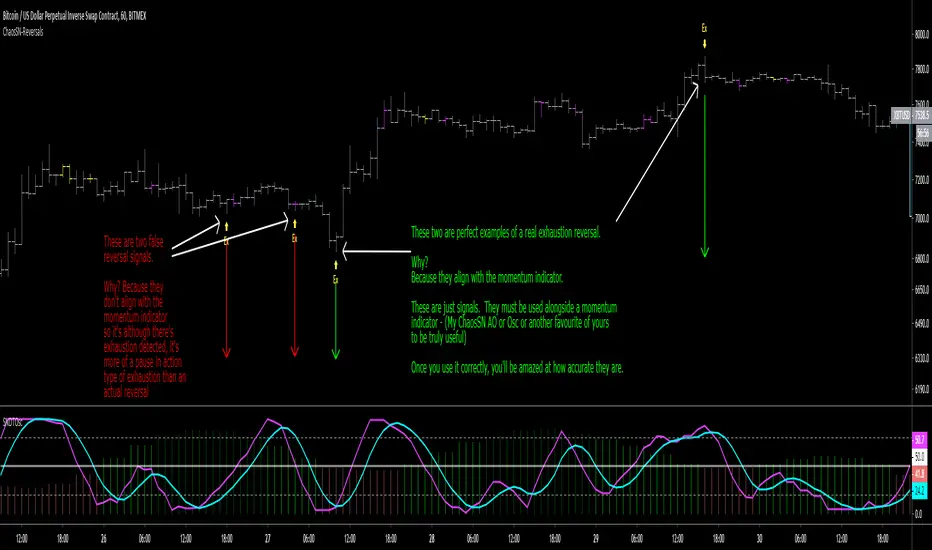
ChaosSN Reversal SignalsI calculated various metrics to measure exhaustion and mean diversion to plot arrows for a likely reversal point.
Use the input window to tailor the sensitivity of the arrows based on the amount of volatility your chart is experiencing (lower = more sensistive). The most common inputs for me are 8, 13, 21.
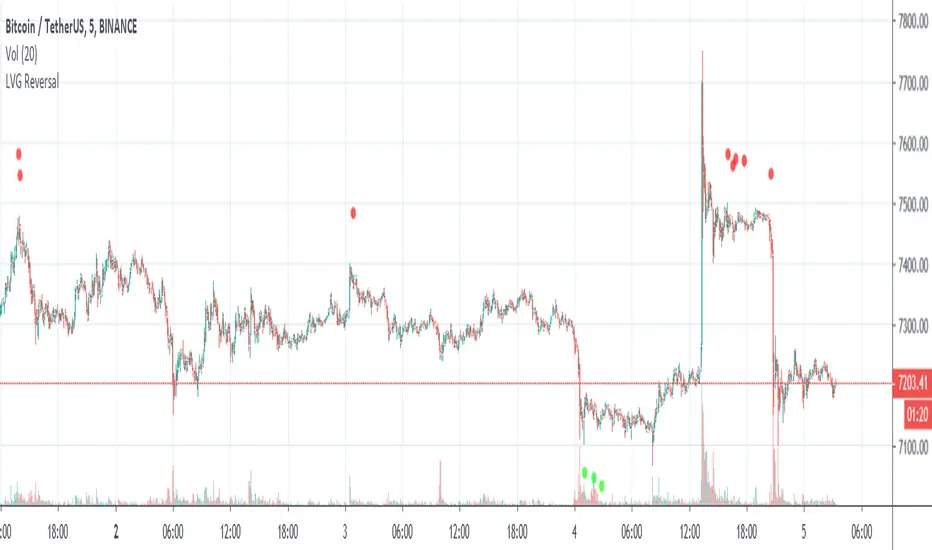
LVG Reversal IndicatorLVG Reversal Indicator:
-----------------------------------------
Shows potential reversal spots.
How to use:
-----------------------------------------
Works best on low time frames and markets that are trading sideways.
If a potential reversal has been reached it plots a green or a red dot under or above the candlestick .
Green dot = potential buy opportunity
Red dot = potential sell opportunity
If the signals get ignored the market is trending and a big reversal can be expected at the end.
The scripts plots the signals at the opening of the candle.
Does not repaint.
------------------------------------------
Please leave some feedback in the comments.
Use this indicator at your own risk.
Price reversal intraday IndicatorIndicator “Price reversal intraday”
Class : oscillator
Trading type : scalping+intraday trading
Time frame : 15-30 min
Purpose : trading on rebounds and reversals
Level of aggressiveness : aggressive
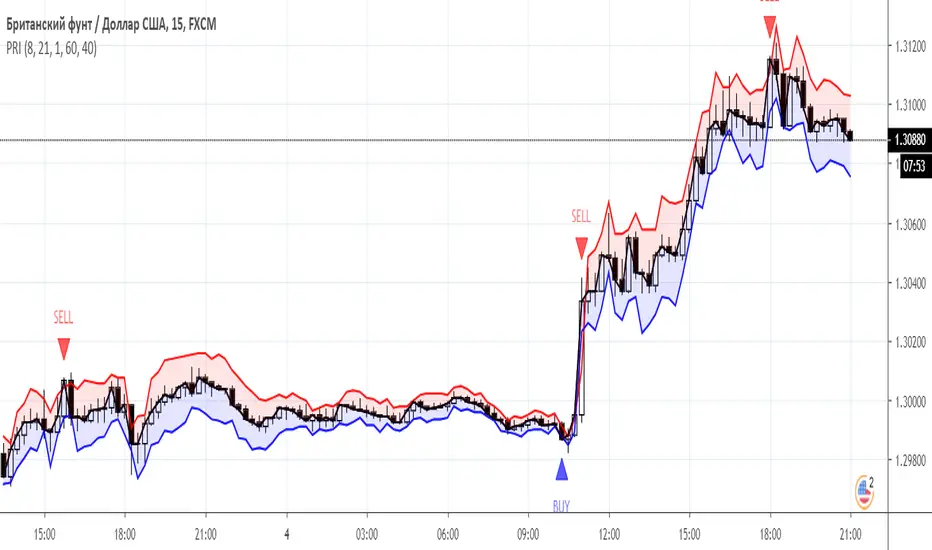
“Price reversal intraday (PRI)” indicator is designed for aggressive intraday trading on rebounds and reversals. It belongs to oscillators. The idea that formed the basis for the creation of “Price reversal intraday (PRI)” is to obtain a synergistic effect from the use of the best oscillatory techniques: modified Bollinger bands and the classic RSI oscillator.
The indicator, using advanced Bollinger technique, monitors the deviation of the current price from the equilibrium value, and then with the help of the RSI oscillator it determines the moment when this deviation reaches a critical point. As a result, a buy or sell signal is generated, which is displayed on the chart in order to facilitate the trading process as much as possible.
Structure of the indicator
Indicator consists of the following elements:
- red zone – indication of a sell zone. Entry into this zone is a signal to close long positions and search for entry points to sell asset;
- red line – extremely high positive deviation of current price from its equilibrium value;
- blue zone - indication of a buy zone. Entry into this zone is a signal to close short positions and search for entry points to buy asset;
- blue line – extremely high negative deviation of current price from its equilibrium value.
Parameters of the indicator
To configure the indicator, the following parameters are provided:
- RSI_period (default value is 8) - period for calculating the RSI oscillator.
- Ranger_period (default value - 21) - period for calculating the modified Bollinger bands.
- Ranger_width (default value - 1) - the parameter used to control the level of aggressiveness of the indicator and frequency of signals. The lower it is, the more signals the indicator will generate. Possible values from 0 to 3.
- ob (the default value is 60) - this parameter defines the overbought zone for the RSI indicator.
- os (the default value is 40) - this parameter defines the oversold zone for the RSI indicator.
Rules of trading
The main task of the trader using indicator is to monitor the location of the current market price relative to the extreme zones (blue/red). Entering the red zone is a signal for closing long positions and searching for sell entry points. Entering the blue zone is a signal for closing short positions and searching for buy entry points.
The appearance of a blue triangle with the inscription “BUY” on the chart is a signal to open buy positions, and a red triangle with the inscription “SELL” is a signal for sale.