Heiken Ashi Break of Structure with Market Structure [by Hampeh]Description
This indicator is designed to identify high-probability trading entries by combining the trend-smoothing capabilities of Heiken Ashi candles with the powerful concept of a Break of Structure (BOS).
To enhance signal quality and reduce false signals, it incorporates a mandatory market structure confirmation filter, requiring a Higher Low (HL) to be established before a buy signal and a Lower High (LH) before a sell signal. The indicator automatically provides dynamic Stop Loss levels and generates real-time alerts to streamline the trading process.
How It Works
The indicator's logic is built upon several key components that work together to filter for high-quality setups.
1. Heiken Ashi Foundation The script uses Heiken Ashi candles as its foundation to reduce market noise and provide a clearer visualization of the underlying trend. This smoothing effect makes it easier to identify sustained directional moves.
2. Break of Structure (BOS) Identification The core entry trigger is a Break of Structure, defined as:
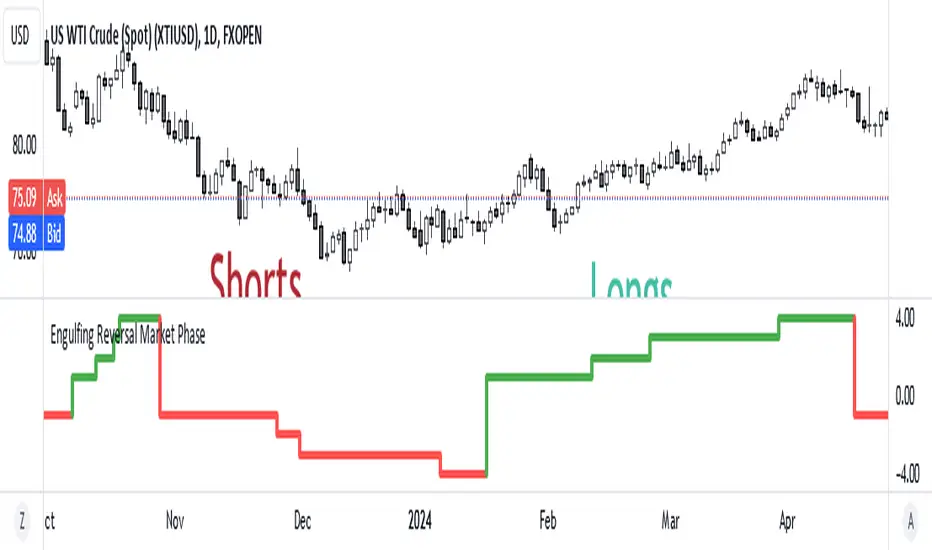
Bullish BOS (Buy Signal): The indicator first identifies a downtrend phase (red Heiken Ashi candles). It marks the opening price of this phase (redOpen). A buy signal is triggered when the trend reverses (turns green) and the Heiken Ashi close price breaks above this redOpen level.
Bearish BOS (Sell Signal): Conversely, it identifies an uptrend phase (green Heiken Ashi candles) and marks its opening price (greenOpen). A sell signal is triggered when the trend reverses (turns red) and the Heiken Ashi close price breaks below this greenOpen level.
3. Market Structure Confirmation (HL/LH Filter) This is the key filter that validates the strength of a potential new trend:
Higher Low (HL) for Buys: A buy signal is only considered valid if the low point of the most recent downtrend phase is higher than the low point of the previous downtrend phase. This confirms a classic "Higher Low" market structure, indicating that buying pressure is increasing.
Lower High (LH) for Sells: A sell signal is only considered valid if the high point of the most recent uptrend phase is lower than the high point of the previous uptrend phase. This confirms a "Lower High" structure, suggesting that selling pressure is building.
4. Dynamic Stop Loss Calculation The indicator provides a logical and dynamic Stop Loss for every signal:
For Buy Signals: The Stop Loss is automatically placed just below the lowest low (lowestLow) recorded during the entire preceding downtrend (red candle) phase.
For Sell Signals: The Stop Loss is placed just above the highest high (highestHigh) recorded during the entire preceding uptrend (green candle) phase.
5. Signal Generation and Visualization
A final BUY signal is generated only when all conditions are met: a bullish BOS occurs and it is preceded by a confirmed Higher Low.
A final SELL signal is generated only when all conditions are met: a bearish BOS occurs and it is preceded by a confirmed Lower High.
When a valid signal is triggered, a label appears on the chart displaying the entry price and the calculated Stop Loss. A corresponding alert is also fired with detailed trade information.
Summary of Strategy
In essence, this indicator waits for a pullback (a Heiken Ashi color change), confirms that the pullback respects bullish or bearish market structure (HL or LH), and then triggers an entry upon a Break of Structure in the intended direction.
Disclaimer : This indicator is a tool for technical analysis and does not guarantee profits. Trading financial markets involves significant risk. Always conduct your own research and practice proper risk management.
Indicateur Pine Script®