Adiyogi Trend🟢🔴 “Adiyogi” Trend — Market Alignment Visualizer
“Adiyogi” Trend is a powerful, non-intrusive trend detection system built for traders who seek clarity, discipline, and alignment with true market flow. Inspired by the meditative stillness of Adiyogi and the need for mindful, high-probability decisions, this tool offers a clean and intuitive visual guide to trending environments — without cluttering the chart or pushing forced trades.
This is not a buy/sell signal generator. Instead, it is designed as a background confirmation engine that helps you stay on the right side of the market by identifying moments of true directional strength.
🧠 Core Logic
The “Adiyogi” Trend indicator highlights the background of your chart in green or red when multiple layers of strength and structure align — including momentum, market positioning, and relative force. Only when these internal components agree does the system activate a directional state.
It’s built on three foundational energies of trend confirmation:
Strength of movement
Structure in price action
Conviction in momentum
By combining these into one visual background, the indicator filters out indecision and helps you stay focused during real trend phases — whether you're day trading, swing trading, or holding longer-term positions.
📌 Core Concepts Behind the Tool
The indicator integrates three essential market filters—each confirming a different dimension of trend strength:
ADX (Average Directional Index) – Measures trend momentum.
You’ve chosen a very responsive setting (ADX Length = 2), which helps catch the earliest possible signs of momentum emergence.
The threshold is ADX ≥ 22, ensuring that weak or sideways markets are filtered out.
SuperTrend (10,1) – Captures short-term trend direction.
This setup follows price closely and reacts quickly to reversals, making it ideal for fast-moving assets or intraday strategies.
SuperTrend acts as the structural confirmation of directional bias.
RSI (Relative Strength Index) – Measures strength based on recent price closes.
You’ve configured RSI > 50 for bullish zones and < 50 for bearish—a neutral midpoint standard often used by professional traders.
This ensures that only trades in sync with momentum and recent strength are highlighted.
🌈 How It Visually Works
Background turns GREEN when:
ADX ≥ 22, indicating strong momentum
Price is above the 20 EMA and above SuperTrend (10,1)
RSI > 50, confirming recent strength
Background turns RED when:
ADX ≥ 22, indicating strong momentum
Price is below the 20 EMA and below SuperTrend (10,1)
RSI < 50, confirming recent weakness
The background remains neutral (transparent) when trend conditions are not clearly aligned—this is the tool's way of keeping you out of indecisive markets.
A label (BULL / BEAR) appears only when the bias flips from the previous one. This helps avoid repeated or redundant alerts, focusing your attention only when something changes.
📊 Practical Uses & Benefits
✅ Stay with the trend: Perfectly filters out choppy or sideways markets by only activating when conditions align across momentum, structure, and strength.
✅ Pre-trade confirmation: Use this tool to confirm trade setups from other indicators or price action patterns.
✅ Avoid noise: Prevent overtrading by focusing only on high-quality trend conditions.
✅ Visual clarity: Unlike arrows or plots that clutter the chart, this tool subtly highlights trend conditions in the background, preserving your price action view.
📍 Important Notes
This is not a buy/sell signal generator. It is a trend-confirmation system.
Use it in conjunction with your existing entry setups—such as breakouts, order blocks, retests, or candlestick patterns.
The tool helps you stay in sync with the dominant direction, especially when combining multiple timeframes.
Can be used on any market (stocks, forex, crypto, indices) and on any timeframe.
Recherche dans les scripts pour "北证50+指数成分股"

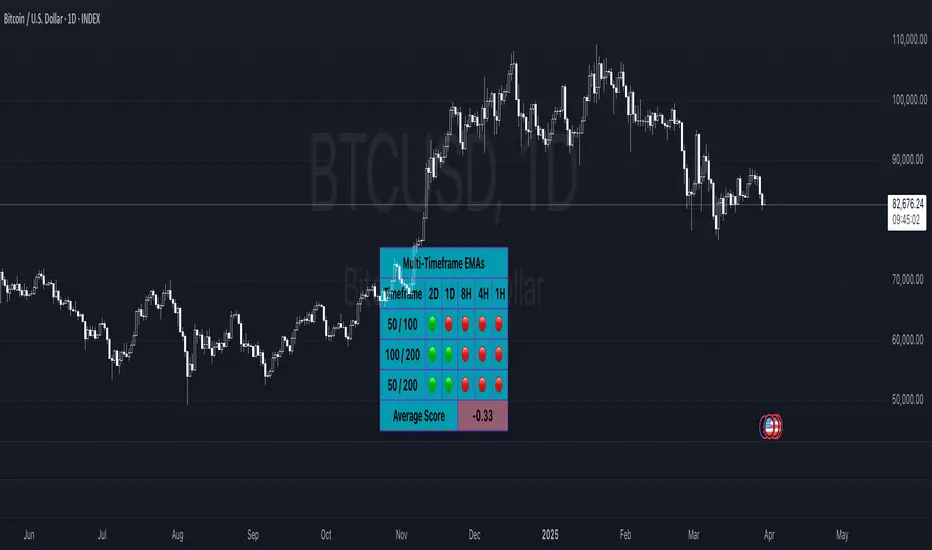
All SMAs Bullish/Bearish Screener (Enhanced)All SMAs Bullish/Bearish Screener Enhanced: Uncover High-Conviction Trend Alignments with Confidence
Description:
Are you ready to elevate your trading from mere guesswork to precise, data-driven decisions? The "All SMAs Bullish/Bearish Screener Enhanced" is not just another indicator; it's a sophisticated, yet user-friendly, trend-following powerhouse designed to cut through market noise and pinpoint high-probability trading opportunities. Built on the foundational strength of comprehensive Moving Average confluence and fortified with critical confirmation signals from Momentum, Volume, and Relative Strength, this script empowers you to identify truly robust trends and manage your trades with unparalleled clarity.
The Power of Multi-Factor Confluence: Beyond Simple Averages
In the unpredictable world of financial markets, true strength or weakness is rarely an isolated event. It's the harmonious alignment of multiple technical factors that signals a high-conviction move. While our original "All SMAs Bullish/Bearish Screener" intelligently identified stocks where price was consistently above or below a full spectrum of Simple Moving Averages (5, 10, 20, 50, 100, 200), this Enhanced version takes it a crucial step further.
We've integrated a powerful three-pronged confirmation system to filter out weaker signals and highlight only the most compelling setups:
Momentum (Rate of Change - ROC): A strong trend isn't just about price direction; it's about the speed and intensity of that movement. Positive momentum confirms that buyers are still aggressively pushing price higher (for bullish signals), while negative momentum validates selling pressure (for bearish signals).
Volume: No trend is truly trustworthy without the backing of smart money. Above-average volume accompanying an "All SMAs" alignment signifies strong institutional participation and conviction behind the move. It separates genuine trend starts from speculative whims.
Relative Strength Index (RSI): This versatile oscillator ensures the trend isn't just "there," but that it's developing healthily. We use RSI to confirm a bullish bias (above 50) or a bearish bias (below 50), adding another layer of confidence to the direction.
When the price aligns above ALL six critical SMAs, and is simultaneously confirmed by robust positive momentum, healthy volume, and a bullish RSI bias, you have an exceptionally strong "STRONGLY BULLISH" signal. This confluence often precedes sustained upward moves, signaling prime accumulation phases. Conversely, a "STRONGLY BEARISH" signal, where price is below ALL SMAs with negative momentum, confirming volume, and a bearish RSI bias, indicates powerful distribution and potential for significant downside.
How to Use This Enhanced Screener:
Add to Chart: Go to TradingView's Pine Editor, paste the script, and click "Add to Chart."
Customize Parameters: Fine-tune the lengths of your SMAs, RSI, Momentum, and Volume averages via the indicator's settings. Experiment to find what best suits your trading style and the assets you trade.
Choose Your Timeframe Wisely:
Daily (1D) and 4-Hour (240 min) are highly recommended. These timeframes cut through intraday noise and provide more reliable, actionable signals for swing and position trading.
Shorter timeframes (e.g., 15min, 60min) can be used by advanced day traders for very short-term entries, but be aware of increased volatility and noise.
Visual Confirmation:
Green/Red Triangles: Appear on your chart, indicating confirmed bullish or bearish signals.
Background Color: The chart background will subtly turn lime green for "STRONGLY BULLISH" and red for "STRONGLY BEARISH" conditions.
On-Chart Status Table: A clear table displays the current signal status ("STRONGLY BULLISH/BEARISH," or "SMAs Mixed") for immediate feedback.
Set Up Alerts (Your Primary Screener Tool): This is the game-changer! Create custom alerts on TradingView based on the "Confirmed Bullish Trade" and "Confirmed Bearish Trade" conditions. Receive instant notifications (email, pop-up, mobile) for any stock in your watchlist that meets these stringent criteria. This allows you to scan the entire market effortlessly and act decisively.
Strategic Stop-Loss Placement: The Trader's Lifeline
Even the most robust signals can fail. Protecting your capital is paramount. For this trend-following strategy, your stop-loss should be placed where the underlying trend structure is broken.
For a "STRONGLY BULLISH" Trade: Place your stop-loss just below the most recent significant swing low (higher low). This is the last point where buyers stepped in to support the price. If price breaks below this, your bullish thesis is invalidated.
For a "STRONGLY BEARISH" Trade: Place your stop-loss just above the most recent significant swing high (lower high). If price breaks above this, your bearish thesis is invalidated.
Alternatively, consider placing your stop-loss just below the 20-period SMA (for bullish trades) or above the 20-period SMA (for bearish trades). A significant close beyond this intermediate-term average often indicates a critical shift in momentum. Always ensure your chosen stop-loss adheres to your pre-defined risk per trade (e.g., 1-2% of capital).
Disciplined Profit Booking: Maximizing Gains
Just as important as knowing when you're wrong is knowing when to take profits.
Trailing Stop-Loss: As your trade moves into profit, trail your stop-loss upwards (for longs) or downwards (for shorts). You can trail it using:
Previous Swing Lows/Highs: Move your stop to just below each new higher low (for longs) or just above each new lower high (for shorts).
A Moving Average (e.g., 10-period or 20-period SMA): If price closes below your chosen trailing SMA, exit. This allows you to ride the trend while protecting accumulated profits.
Target Levels: Identify potential resistance levels (for longs) or support levels (for shorts) using pivot points, previous highs/lows, or Fibonacci extensions. Consider taking partial profits at these levels and letting the rest run with a trailing stop.
Loss of Confluence: If the "STRONGLY BULLISH/BEARISH" condition ceases to be met (e.g., RSI crosses below 50, or volume drops significantly), this can be a signal to reduce or exit your position, even if your stop-loss hasn't been hit.
The "All SMAs Bullish/Bearish Screener Enhanced" is your comprehensive partner in navigating the markets. By combining robust trend identification with critical confirmation signals and disciplined risk management, you're equipped to make smarter, more confident trading decisions. Add it to your favorites and unlock a new level of precision in your trading journey!
#PineScript #TradingView #SMA #MovingAverage #TrendFollowing #StockScreener #TechnicalAnalysis #Bullish #Bearish #QQQ #Momentum #Volume #RSI #SPY #TradingStrategy #Enhanced #Signals #Analysis #DayTrading #SwingTrading

Omega Market Mood Meter [OmegaTools]The Omega Market Mood Meter is a precision-built sentiment oscillator that captures the market’s emotional intensity through a multi-layered RSI system. Designed for traders who seek to align with the market's true behavioral state, it blends momentum readings with a brand-new, rarely-seen innovation: the Sentiment-Weighted Moving Average (WMA-Ω)—a trend filter that dynamically adjusts to the market’s psychological tone.
🧠 Market Mood Oscillator
At its core, the Ω 3M oscillator aggregates three RSI-based components:
RSI(9) on close — captures short-term tension;
RSI(21) on HLC3 — balances medium-term positioning;
RSI(50) on HL2 — reflects long-term directional weight.
Each input is scaled and weighted to contribute to a final oscillator centered around zero, with ±50 and ±100 acting as key sentiment boundaries. When values exceed ±100, the market is likely reaching emotional extremes—zones that often precede reversals or require caution.
Visual features include:
Dynamic Background Highlighting: automatically emphasizes extreme sentiment zones.
Reference Lines: plotted at ±100, ±50, and 0 for fast sentiment interpretation.
🔥 WMA-Ω: Sentiment-Weighted Moving Average
The standout innovation of this tool is the Weighted Market Mood Moving Average, or WMA-Ω—a proprietary calculation that averages price using the absolute value of sentiment as its weighting force. This approach gives greater importance to price during periods of strong emotional conviction (either bullish or bearish), resulting in a context-aware trend filter that reacts only when sentiment truly matters.
This technique:
Filters noise during low-volatility or indecisive conditions;
Enhances reliability by reacting to meaningful sentiment surges;
Offers a more psychologically-adjusted trend baseline compared to traditional MAs.
Visually:
When price is above WMA-Ω, a semi-transparent bullish fill highlights underlying strength;
When below, a bearish fill reveals dominant downward sentiment.
This feature is unique among public TradingView tools and provides an edge in identifying trend quality with psychological context.
✅ How to Use
Extreme Sentiment Zones (±100): Use as contrarian warning zones or signal dampeners.
Crosses of WMA-Ω: Treat these as psychological trend confirmations; price above indicates structurally bullish sentiment and vice versa.
Range-bound Bias: Between ±50, sentiment may be indecisive; watch for breakout or alignment with WMA-Ω.
Advanced Confluence: Combine with other Omega tools (e.g., Ω Bias Forecaster, Ω IV Walls) for powerful regime-based strategies.
Omega Market Mood Meter is ideal for discretionary and systematic traders who want a clean, multi-timeframe sentiment readout and a cutting-edge weighted trend engine grounded in market psychology.

IDKFAIDKFA - Advanced Order Blocks & Volume Profile with Market Structure Analysis
Why IDKFA?
Named after the legendary DOOM cheat code that gives players "all weapons and full ammo," IDKFA provides traders with a comprehensive arsenal of market analysis tools. Just as the cheat code arms players with everything needed for combat, this indicator equips traders with essential market structure tools: Order Blocks, Volume Profile, LVN/HVN areas, Fibonacci retracements, and intelligent buy/sell signals - all in one unified system.
Core Features
Order Blocks Detection
Automatically identifies institutional order blocks using pivot high/low analysis
Extends blocks dynamically until price interaction occurs
Bullish blocks (demand zones) and bearish blocks (supply zones)
Customizable opacity and extend functionality
Advanced Volume Profile
Real-time volume profile calculation for multiple session types
Point of Control (POC), Value Area High (VAH), and Value Area Low (VAL)
Mode 1: Side-by-side bull/bear volume display
Mode 2: Overlapped volume display with percentage analysis
Shows buying vs selling pressure at each price level
LVN/HVN Area Detection
Low Volume Nodes (LVN): Areas below VAL where price moves quickly
High Volume Nodes (HVN): Areas above VAH with strong resistance
NPOC (Naked Point of Control): Single print areas within Value Area
Volume-based gradient coloring shows relative activity levels
Smart Fibonacci Retracements
Auto-detects trend direction for proper fibonacci orientation
Dynamic color coding: Red levels in uptrends, Gold in downtrends
Special 88.6% level turns lime green in downtrends
Key levels: 23.6%, 38.2%, 50%, 61.8%, 65%, 78.6%, 88.6%
Intelligent Signal System
Works best on higher timeframes
Identifies high-probability reversal setups at key levels
Buy signals: Large bearish rejection followed by bullish reclaim
Sell signals: Large bullish rejection followed by bearish breakdown
Signals only trigger near significant support/resistance areas
Signal Analysis & Usage Guidelines
Buy Signal Mechanics
The buy signal triggers when:
Previous candle shows significant bearish movement (minimum ATR multiplier)
Current candle reclaims a configurable percentage of the previous candle's range
Price is near a key support level (order blocks, fibonacci, volume levels)
Sell Signal Mechanics
The sell signal triggers when:
Previous candle shows significant bullish movement (minimum ATR multiplier)
Current candle rejects below a configurable percentage of the previous candle's range
Price is near a key resistance level (order blocks, fibonacci, volume levels)
When to TAKE Signals
High Probability Buy Signals:
Signal appears AT or BELOW the VAL (Value Area Low)
Signal occurs at bullish order block confluence
Price is in LVN area below VAL (momentum acceleration zone)
Signal aligns with fibonacci 61.8% or 78.6% support
Multiple session POC levels provide support confluence
Previous session's VAL acting as current support
High Probability Sell Signals:
Signal appears AT or ABOVE the VAH (Value Area High)
Signal occurs at bearish order block confluence
Price is in HVN area above VAH (heavy resistance zone)
Signal aligns with fibonacci 61.8% or 78.6% resistance
Multiple session POC levels provide resistance confluence
Previous session's VAH acting as current resistance
When to AVOID Signals
Avoid Buy Signals When:
Signal appears ABOVE the VAH (buying into resistance)
Price is in HVN red zones (high volume resistance areas)
No clear support structure below current price
Volume profile shows heavy selling pressure (high bear percentages)
Signal occurs during low-volume periods between major sessions
Multiple bearish order blocks exist below current price
Avoid Sell Signals When:
Signal appears BELOW the VAL (selling into support)
Price is in LVN green zones (momentum could continue)
No clear resistance structure above current price
Volume profile shows heavy buying pressure (high bull percentages)
Signal occurs during Asian session ranges without clear direction
Multiple bullish order blocks exist above current price
Volume Profile Context for Signals
Understanding Bull/Bear Percentages:
70%+ Bull dominance at a level = Strong support expected
70%+ Bear dominance at a level = Strong resistance expected
50/50 Split = Neutral zone, less predictable
Use percentages to gauge conviction behind moves
POC (Point of Control) Interactions:
Signals above POC in uptrend = Higher probability
Signals below POC in downtrend = Higher probability
Signals against POC bias require extra confirmation
POC often acts as magnetic level for price return
Trading Strategies
Strategy 1: VAL/VAH Bounce Strategy
Wait for price to approach VAL (support) or VAH (resistance)
Look for signal confirmation at these critical levels
Enter with tight stops beyond the Value Area
Target opposite boundary or next session's levels
Strategy 2: Order Block + Volume Confluence
Identify order block alignment with VAL/VAH
Wait for signal within the confluence zone
Enter on signal with stop beyond order block
Use LVN areas as acceleration zones for targets
Strategy 3: LVN/HVN Strategy
LVN (Green) Areas: "Go Zones" - expect quick price movement through low volume
HVN (Red) Areas: "Stop Zones" - expect resistance and potential reversals
NPOC Areas: "Fill Zones" - price often returns to fill single print gaps
Strategy 4: Multi-Session Analysis
Use Daily/Weekly for major structure context
Use 4H for intermediate levels
Use 1H for precise entry timing
Ensure all timeframes align before taking signals
Strategy 5: Fibonacci + Volume Profile
Buy signals at 61.8% or 78.6% fibonacci near VAL
Sell signals at 61.8% or 78.6% fibonacci near VAH
Use 88.6% level as final support/resistance before major moves
50% level often aligns with POC for confluence
Signal Quality Assessment
Grade A Signals (Highest Probability):
Signal at VAL/VAH with order block confluence
Fibonacci level alignment (61.8%, 78.6%)
Volume profile shows 70%+ dominance in signal direction
Multiple timeframe structure alignment
Signal occurs during high-volume sessions (London/NY)
Grade B Signals (Moderate Probability):
Signal near POC with some confluence
Fibonacci 50% or 38.2% alignment
Mixed volume profile readings (50-70% dominance)
Some timeframe alignment present
Signal during overlap sessions
Grade C Signals (Lower Probability):
Signal with minimal confluence
Weak fibonacci alignment or none
Volume profile neutral or against signal
Conflicting timeframe signals
Signal during low-volume periods
Risk Management Guidelines
Position Sizing Based on Signal Quality:
Grade A: Standard position size
Grade B: Reduced position size (50-75%)
Grade C: Minimal position size (25%) or skip entirely
Stop Loss Placement:
Beyond order block boundaries
Outside Value Area (VAL/VAH)
Below/above fibonacci confluence levels
Account for session volatility ranges
Profit Targets:
First target: Opposite VAL/VAH boundary
Second target: Next session's key levels
Final target: Major order blocks or fibonacci extensions
Credits & Attribution
Original components derived from:
Market Sessions & Volume Profile by © Leviathan (Mozilla Public License 2.0)
Volume Profile elements inspired by @LonesomeTheBlue's volume profile script
Pivot Order Blocks by TradingWolf / © MensaTrader (Mozilla Public License 2.0)
Auto Fibonacci Retracement code (public domain)
Significant enhancements and modifications include:
Advanced LVN/HVN detection and visualization
Bull/Bear percentage analysis for Mode 2/3
Comprehensive alert system with market context
Integrated buy/sell signals at key levels
Performance optimizations and extended session support
Enhanced Mode 2/3 with percentage pressure analysis
Important Disclaimers
This indicator is a technical analysis tool designed for educational purposes. It does not provide financial advice, investment recommendations, or trading signals that guarantee profits. All trading involves substantial risk of loss, and past performance does not guarantee future results. Users should conduct their own research, understand the risks involved, and consider consulting with qualified financial advisors before making trading decisions. The signals and analysis provided are based on historical price patterns and volume data, which may not predict future market movements accurately.
Best Practices
Never trade signals blindly - always consider volume profile context
Wait for confluence between multiple tools before entering
Respect the Value Area - avoid buying above VAH or selling below VAL
Use session context - Asian ranges vs London/NY breakouts
Practice proper risk management - position size based on signal quality
Understand the bigger picture - use multiple timeframes for context
Remember: Like the IDKFA cheat code, having all the tools doesn't guarantee success. The key is learning to use them together effectively and understanding when NOT to take a signal is often more important than knowing when to take one.

ATR-Multiple from 50SMAThis indicator provides a nuanced view of price extension by calculating the distance between the current price and its 50-period Simple Moving Average. This distance is not measured in simple percentage terms but is quantified in multiples of the Average True Range (ATR), offering a volatility-adjusted perspective on how far an asset has moved from its mean.
The primary goal is to help traders identify potentially overextended conditions, which can often precede price consolidation or reversals. As a general guideline, when an asset's price stretches to multiples of 7 ATRs or more above its 50-day SMA, it often enters a zone where significant profit-taking may occur. By visualizing this extension, the indicator can serve as a powerful tool for gauging when to consider taking profits on existing long positions. Furthermore, it can act as a cautionary signal, helping traders avoid initiating new long positions in assets that are already significantly stretched and may be poised for a pullback.
Features
Volatility-Adjusted Extension
Measures the distance from the 50 SMA in terms of ATR multiples, providing a more standardized way to compare extension across different assets and time periods.
Daily Timeframe Consistency
By default, the indicator uses the daily SMA and ATR for its calculations, regardless of the chart's current timeframe. This ensures a consistent and meaningful measure of extension rooted in the daily trend.
Histogram Visualization
Displays the result as a clear histogram in a separate pane, making it easy to track the extension level over time and identify historical extremes.
Dynamic Color-Coding
The histogram bars are color-coded to visually highlight different levels of extension. The colors shift as the price moves further from the mean, providing an intuitive at-a-glance reading.
Key Threshold Markers
Includes pre-set horizontal lines at the 7 and 10 ATR multiples to clearly mark the zones of potential profit-taking and extreme extension, respectively.
Built-in Alerts
Comes with configurable alert conditions that can notify you when the price reaches the "profit-taking" threshold (7 ATRs) or the "extreme extension" threshold (10 ATRs).
Customization Options
MA & ATR Periods
You can adjust the length for the Simple Moving Average (default 50) and the Average True Range (default 14) to suit your specific analytical needs.
Timeframe Source
A toggle allows you to switch between always calculating using daily data (the default and recommended setting) or using the data from the current chart's timeframe.
Color Display Style
You can choose between a smooth color gradient that transitions elegantly with the extension level or a distinct, step-based color display for a clearer visual separation of the defined zones.
Full Color Scheme Control
Every visual element is fully customizable. You can change the colors for the regular extension, the "get ready," "profit-taking," and "extreme" levels, as well as the horizontal reference lines.

Magnificent 7 OscillatorThe Magnificent 7 Oscillator is a sophisticated momentum-based technical indicator designed to analyze the collective performance of the seven largest technology companies in the U.S. stock market (Apple, Microsoft, Alphabet, Amazon, NVIDIA, Tesla, and Meta). This indicator incorporates established momentum factor research and provides three distinct analytical modes: absolute momentum tracking, equal-weighted market comparison, and relative performance analysis. The tool integrates five different oscillator methodologies and includes advanced breadth analysis capabilities.
Theoretical Foundation
Momentum Factor Research
The indicator's foundation rests on seminal momentum research in financial markets. Jegadeesh and Titman (1993) demonstrated that stocks with strong price performance over 3-12 month periods tend to continue outperforming in subsequent periods¹. This momentum effect was later incorporated into formal factor models by Carhart (1997), who extended the Fama-French three-factor model to include a momentum factor (UMD - Up Minus Down)².
The momentum calculation methodology follows the academic standard:
Momentum(t) = / P(t-n) × 100
Where P(t) is the current price and n is the lookback period.
The focus on the "Magnificent 7" stocks reflects the increasing market concentration observed in recent years. Fama and French (2015) noted that a small number of large-cap stocks can drive significant market movements due to their substantial index weights³. The combined market capitalization of these seven companies often exceeds 25% of the total S&P 500, making their collective momentum a critical market indicator.
Indicator Architecture
Core Components
1. Data Collection and Processing
The indicator employs robust data collection with error handling for missing or invalid security data. Each stock's momentum is calculated independently using the specified lookback period (default: 14 periods).
2. Composite Oscillator Calculation
Following Fama-French factor construction methodology, the indicator offers two weighting schemes:
- Equal Weight: Each active stock receives identical weighting (1/n)
- Market Cap Weight: Reserved for future enhancement
3. Oscillator Transformation Functions
The indicator provides five distinct oscillator types, each with established technical analysis foundations:
a) Momentum Oscillator (Default)
- Pure rate-of-change calculation
- Centered around zero
- Direct implementation of Jegadeesh & Titman methodology
b) RSI (Relative Strength Index)
- Wilder's (1978) relative strength methodology
- Transformed to center around zero for consistency
- Scale: -50 to +50
c) Stochastic Oscillator
- George Lane's %K methodology
- Measures current position within recent range
- Transformed to center around zero
d) Williams %R
- Larry Williams' range-based oscillator
- Inverse stochastic calculation
- Adjusted for zero-centered display
e) CCI (Commodity Channel Index)
- Donald Lambert's mean reversion indicator
- Measures deviation from moving average
- Scaled for optimal visualization
Operational Modes
Mode 1: Magnificent 7 Analysis
Tracks the collective momentum of the seven constituent stocks. This mode is optimal for:
- Technology sector analysis
- Growth stock momentum assessment
- Large-cap performance tracking
Mode 2: S&P 500 Equal Weight Comparison
Analyzes momentum using an equal-weighted S&P 500 reference (typically RSP ETF). This mode provides:
- Broader market momentum context
- Size-neutral market analysis
- Comparison baseline for relative performance
Mode 3: Relative Performance Analysis
Calculates the momentum differential between Magnificent 7 and S&P 500 Equal Weight. This mode enables:
- Sector rotation analysis
- Style factor assessment (Growth vs. Value)
- Relative strength identification
Formula: Relative Performance = MAG7_Momentum - SP500EW_Momentum
Signal Generation and Thresholds
Signal Classification
The indicator generates three signal states:
- Bullish: Oscillator > Upper Threshold (default: +2.0%)
- Bearish: Oscillator < Lower Threshold (default: -2.0%)
- Neutral: Oscillator between thresholds
Relative Performance Signals
In relative performance mode, specialized thresholds apply:
- Outperformance: Relative momentum > +1.0%
- Underperformance: Relative momentum < -1.0%
Alert System
Comprehensive alert conditions include:
- Threshold crossovers (bullish/bearish signals)
- Zero-line crosses (momentum direction changes)
- Relative performance shifts
- Breadth Analysis Component
The indicator incorporates market breadth analysis, calculating the percentage of constituent stocks with positive momentum. This feature provides insights into:
- Strong Breadth (>60%): Broad-based momentum
- Weak Breadth (<40%): Narrow momentum leadership
- Mixed Breadth (40-60%): Neutral momentum distribution
Visual Design and User Interface
Theme-Adaptive Display
The indicator automatically adjusts color schemes for dark and light chart themes, ensuring optimal visibility across different user preferences.
Professional Data Table
A comprehensive data table displays:
- Current oscillator value and percentage
- Active mode and oscillator type
- Signal status and strength
- Component breakdowns (in relative performance mode)
- Breadth percentage
- Active threshold levels
Custom Color Options
Users can override default colors with custom selections for:
- Neutral conditions (default: Material Blue)
- Bullish signals (default: Material Green)
- Bearish signals (default: Material Red)
Practical Applications
Portfolio Management
- Sector Allocation: Use relative performance mode to time technology sector exposure
- Risk Management: Monitor breadth deterioration as early warning signal
- Entry/Exit Timing: Utilize threshold crossovers for position sizing decisions
Market Analysis
- Trend Identification: Zero-line crosses indicate momentum regime changes
- Divergence Analysis: Compare MAG7 performance against broader market
- Volatility Assessment: Oscillator range and frequency provide volatility insights
Strategy Development
- Factor Timing: Implement growth factor timing strategies
- Momentum Strategies: Develop systematic momentum-based approaches
- Risk Parity: Use breadth metrics for risk-adjusted portfolio construction
Configuration Guidelines
Parameter Selection
- Momentum Period (5-100): Shorter periods (5-20) for tactical analysis, longer periods (50-100) for strategic assessment
- Smoothing Period (1-50): Higher values reduce noise but increase lag
- Thresholds: Adjust based on historical volatility and strategy requirements
Timeframe Considerations
- Daily Charts: Optimal for swing trading and medium-term analysis
- Weekly Charts: Suitable for long-term trend analysis
- Intraday Charts: Useful for short-term tactical decisions
Limitations and Considerations
Market Concentration Risk
The indicator's focus on seven stocks creates concentration risk. During periods of significant rotation away from large-cap technology stocks, the indicator may not represent broader market conditions.
Momentum Persistence
While momentum effects are well-documented, they are not permanent. Jegadeesh and Titman (1993) noted momentum reversal effects over longer time horizons (2-5 years).
Correlation Dynamics
During market stress, correlations among the constituent stocks may increase, reducing the diversification benefits and potentially amplifying signal intensity.
Performance Metrics and Backtesting
The indicator includes hidden plots for comprehensive backtesting:
- Individual stock momentum values
- Composite breadth percentage
- S&P 500 Equal Weight momentum
- Relative performance calculations
These metrics enable quantitative strategy development and historical performance analysis.
References
¹Jegadeesh, N., & Titman, S. (1993). Returns to buying winners and selling losers: Implications for stock market efficiency. Journal of Finance, 48(1), 65-91.
Carhart, M. M. (1997). On persistence in mutual fund performance. Journal of Finance, 52(1), 57-82.
Fama, E. F., & French, K. R. (2015). A five-factor asset pricing model. Journal of Financial Economics, 116(1), 1-22.
Wilder, J. W. (1978). New concepts in technical trading systems. Trend Research.

Langlands-Operadic Möbius Vortex (LOMV)Langlands-Operadic Möbius Vortex (LOMV)
Where Pure Mathematics Meets Market Reality
A Revolutionary Synthesis of Number Theory, Category Theory, and Market Dynamics
🎓 THEORETICAL FOUNDATION
The Langlands-Operadic Möbius Vortex represents a groundbreaking fusion of three profound mathematical frameworks that have never before been combined for market analysis:
The Langlands Program: Harmonic Analysis in Markets
Developed by Robert Langlands (Fields Medal recipient), the Langlands Program creates bridges between number theory, algebraic geometry, and harmonic analysis. In our indicator:
L-Function Implementation:
- Utilizes the Möbius function μ(n) for weighted price analysis
- Applies Riemann zeta function convergence principles
- Calculates quantum harmonic resonance between -2 and +2
- Measures deep mathematical patterns invisible to traditional analysis
The L-Function core calculation employs:
L_sum = Σ(return_val × μ(n) × n^(-s))
Where s is the critical strip parameter (0.5-2.5), controlling mathematical precision and signal smoothness.
Operadic Composition Theory: Multi-Strategy Democracy
Category theory and operads provide the mathematical framework for composing multiple trading strategies into a unified signal. This isn't simple averaging - it's mathematical composition using:
Strategy Composition Arity (2-5 strategies):
- Momentum analysis via RSI transformation
- Mean reversion through Bollinger Band mathematics
- Order Flow Polarity Index (revolutionary T3-smoothed volume analysis)
- Trend detection using Directional Movement
- Higher timeframe momentum confirmation
Agreement Threshold System: Democratic voting where strategies must reach consensus before signal generation. This prevents false signals during market uncertainty.
Möbius Function: Number Theory in Action
The Möbius function μ(n) forms the mathematical backbone:
- μ(n) = 1 if n is a square-free positive integer with even number of prime factors
- μ(n) = -1 if n is a square-free positive integer with odd number of prime factors
- μ(n) = 0 if n has a squared prime factor
This creates oscillating weights that reveal hidden market periodicities and harmonic structures.
🔧 COMPREHENSIVE INPUT SYSTEM
Langlands Program Parameters
Modular Level N (5-50, default 30):
Primary lookback for quantum harmonic analysis. Optimized by timeframe:
- Scalping (1-5min): 15-25
- Day Trading (15min-1H): 25-35
- Swing Trading (4H-1D): 35-50
- Asset-specific: Crypto 15-25, Stocks 30-40, Forex 35-45
L-Function Critical Strip (0.5-2.5, default 1.5):
Controls Riemann zeta convergence precision:
- Higher values: More stable, smoother signals
- Lower values: More reactive, catches quick moves
- High frequency: 0.8-1.2, Medium: 1.3-1.7, Low: 1.8-2.3
Frobenius Trace Period (5-50, default 21):
Galois representation lookback for price-volume correlation:
- Measures harmonic relationships in market flows
- Scalping: 8-15, Day Trading: 18-25, Swing: 25-40
HTF Multi-Scale Analysis:
Higher timeframe context prevents trading against major trends:
- Provides market bias and filters signals
- Improves win rates by 15-25% through trend alignment
Operadic Composition Parameters
Strategy Composition Arity (2-5, default 4):
Number of algorithms composed for final signal:
- Conservative: 4-5 strategies (higher confidence)
- Moderate: 3-4 strategies (balanced approach)
- Aggressive: 2-3 strategies (more frequent signals)
Category Agreement Threshold (2-5, default 3):
Democratic voting minimum for signal generation:
- Higher agreement: Fewer but higher quality signals
- Lower agreement: More signals, potential false positives
Swiss-Cheese Mixing (0.1-0.5, default 0.382):
Golden ratio φ⁻¹ based blending of trend factors:
- 0.382 is φ⁻¹, optimal for natural market fractals
- Higher values: Stronger trend following
- Lower values: More contrarian signals
OFPI Configuration:
- OFPI Length (5-30, default 14): Order Flow calculation period
- T3 Smoothing (3-10, default 5): Advanced exponential smoothing
- T3 Volume Factor (0.5-1.0, default 0.7): Smoothing aggressiveness control
Unified Scoring System
Component Weights (sum ≈ 1.0):
- L-Function Weight (0.1-0.5, default 0.3): Mathematical harmony emphasis
- Galois Rank Weight (0.1-0.5, default 0.2): Market structure complexity
- Operadic Weight (0.1-0.5, default 0.3): Multi-strategy consensus
- Correspondence Weight (0.1-0.5, default 0.2): Theory-practice alignment
Signal Threshold (0.5-10.0, default 5.0):
Quality filter producing:
- 8.0+: EXCEPTIONAL signals only
- 6.0-7.9: STRONG signals
- 4.0-5.9: MODERATE signals
- 2.0-3.9: WEAK signals
🎨 ADVANCED VISUAL SYSTEM
Multi-Dimensional Quantum Aura Bands
Five-layer resonance field showing market energy:
- Colors: Theme-matched gradients (Quantum purple, Holographic cyan, etc.)
- Expansion: Dynamic based on score intensity and volatility
- Function: Multi-timeframe support/resistance zones
Morphism Flow Portals
Category theory visualization showing market topology:
- Green/Cyan Portals: Bullish mathematical flow
- Red/Orange Portals: Bearish mathematical flow
- Size/Intensity: Proportional to signal strength
- Recursion Depth (1-8): Nested patterns for flow evolution
Fractal Grid System
Dynamic support/resistance with projected L-Scores:
- Multiple Timeframes: 10, 20, 30, 40, 50-period highs/lows
- Smart Spacing: Prevents level overlap using ATR-based minimum distance
- Projections: Estimated signal scores when price reaches levels
- Usage: Precise entry/exit timing with mathematical confirmation
Wick Pressure Analysis
Rejection level prediction using candle mathematics:
- Upper Wicks: Selling pressure zones (purple/red lines)
- Lower Wicks: Buying pressure zones (purple/green lines)
- Glow Intensity (1-8): Visual emphasis and line reach
- Application: Confluence with fractal grid creates high-probability zones
Regime Intensity Heatmap
Background coloring showing market energy:
- Black/Dark: Low activity, range-bound markets
- Purple Glow: Building momentum and trend development
- Bright Purple: High activity, strong directional moves
- Calculation: Combines trend, momentum, volatility, and score intensity
Six Professional Themes
- Quantum: Purple/violet for general trading and mathematical focus
- Holographic: Cyan/magenta optimized for cryptocurrency markets
- Crystalline: Blue/turquoise for conservative, stability-focused trading
- Plasma: Gold/magenta for high-energy volatility trading
- Cosmic Neon: Bright neon colors for maximum visibility and aggressive trading
📊 INSTITUTIONAL-GRADE DASHBOARD
Unified AI Score Section
- Total Score (-10 to +10): Primary decision metric
- >5: Strong bullish signals
- <-5: Strong bearish signals
- Quality ratings: EXCEPTIONAL > STRONG > MODERATE > WEAK
- Component Analysis: Individual L-Function, Galois, Operadic, and Correspondence contributions
Order Flow Analysis
Revolutionary OFPI integration:
- OFPI Value (-100% to +100%): Real buying vs selling pressure
- Visual Gauge: Horizontal bar chart showing flow intensity
- Momentum Status: SHIFTING, ACCELERATING, STRONG, MODERATE, or WEAK
- Trading Application: Flow shifts often precede major moves
Signal Performance Tracking
- Win Rate Monitoring: Real-time success percentage with emoji indicators
- Signal Count: Total signals generated for frequency analysis
- Current Position: LONG, SHORT, or NONE with P&L tracking
- Volatility Regime: HIGH, MEDIUM, or LOW classification
Market Structure Analysis
- Möbius Field Strength: Mathematical field oscillation intensity
- CHAOTIC: High complexity, use wider stops
- STRONG: Active field, normal position sizing
- MODERATE: Balanced conditions
- WEAK: Low activity, consider smaller positions
- HTF Trend: Higher timeframe bias (BULL/BEAR/NEUTRAL)
- Strategy Agreement: Multi-algorithm consensus level
Position Management
When in trades, displays:
- Entry Price: Original signal price
- Current P&L: Real-time percentage with risk level assessment
- Duration: Bars in trade for timing analysis
- Risk Level: HIGH/MEDIUM/LOW based on current exposure
🚀 SIGNAL GENERATION LOGIC
Balanced Long/Short Architecture
The indicator generates signals through multiple convergent pathways:
Long Entry Conditions:
- Score threshold breach with algorithmic agreement
- Strong bullish order flow (OFPI > 0.15) with positive composite signal
- Bullish pattern recognition with mathematical confirmation
- HTF trend alignment with momentum shifting
- Extreme bullish OFPI (>0.3) with any positive score
Short Entry Conditions:
- Score threshold breach with bearish agreement
- Strong bearish order flow (OFPI < -0.15) with negative composite signal
- Bearish pattern recognition with mathematical confirmation
- HTF trend alignment with momentum shifting
- Extreme bearish OFPI (<-0.3) with any negative score
Exit Logic:
- Score deterioration below continuation threshold
- Signal quality degradation
- Opposing order flow acceleration
- 10-bar minimum between signals prevents overtrading
⚙️ OPTIMIZATION GUIDELINES
Asset-Specific Settings
Cryptocurrency Trading:
- Modular Level: 15-25 (capture volatility)
- L-Function Precision: 0.8-1.3 (reactive to price swings)
- OFPI Length: 10-20 (fast correlation shifts)
- Cascade Levels: 5-7, Theme: Holographic
Stock Index Trading:
- Modular Level: 25-35 (balanced trending)
- L-Function Precision: 1.5-1.8 (stable patterns)
- OFPI Length: 14-20 (standard correlation)
- Cascade Levels: 4-5, Theme: Quantum
Forex Trading:
- Modular Level: 35-45 (smooth trends)
- L-Function Precision: 1.6-2.1 (high smoothing)
- OFPI Length: 18-25 (disable volume amplification)
- Cascade Levels: 3-4, Theme: Crystalline
Timeframe Optimization
Scalping (1-5 minute charts):
- Reduce all lookback parameters by 30-40%
- Increase L-Function precision for noise reduction
- Enable all visual elements for maximum information
- Use Small dashboard to save screen space
Day Trading (15 minute - 1 hour):
- Use default parameters as starting point
- Adjust based on market volatility
- Normal dashboard provides optimal information density
- Focus on OFPI momentum shifts for entries
Swing Trading (4 hour - Daily):
- Increase lookback parameters by 30-50%
- Higher L-Function precision for stability
- Large dashboard for comprehensive analysis
- Emphasize HTF trend alignment
🏆 ADVANCED TRADING STRATEGIES
The Mathematical Confluence Method
1. Wait for Fractal Grid level approach
2. Confirm with projected L-Score > threshold
3. Verify OFPI alignment with direction
4. Enter on portal signal with quality ≥ STRONG
5. Exit on score deterioration or opposing flow
The Regime Trading System
1. Monitor Aether Flow background intensity
2. Trade aggressively during bright purple periods
3. Reduce position size during dark periods
4. Use Möbius Field strength for stop placement
5. Align with HTF trend for maximum probability
The OFPI Momentum Strategy
1. Watch for momentum shifting detection
2. Confirm with accelerating flow in direction
3. Enter on immediate portal signal
4. Scale out at Fibonacci levels
5. Exit on flow deceleration or reversal
⚠️ RISK MANAGEMENT INTEGRATION
Mathematical Position Sizing
- Use Galois Rank for volatility-adjusted sizing
- Möbius Field strength determines stop width
- Fractal Dimension guides maximum exposure
- OFPI momentum affects entry timing
Signal Quality Filtering
- Trade only STRONG or EXCEPTIONAL quality signals
- Increase position size with higher agreement levels
- Reduce risk during CHAOTIC Möbius field periods
- Respect HTF trend alignment for directional bias
🔬 DEVELOPMENT JOURNEY
Creating the LOMV was an extraordinary mathematical undertaking that pushed the boundaries of what's possible in technical analysis. This indicator almost didn't happen. The theoretical complexity nearly proved insurmountable.
The Mathematical Challenge
Implementing the Langlands Program required deep research into:
- Number theory and the Möbius function
- Riemann zeta function convergence properties
- L-function analytical continuation
- Galois representations in finite fields
The mathematical literature spans decades of pure mathematics research, requiring translation from abstract theory to practical market application.
The Computational Complexity
Operadic composition theory demanded:
- Category theory implementation in Pine Script
- Multi-dimensional array management for strategy composition
- Real-time democratic voting algorithms
- Performance optimization for complex calculations
The Integration Breakthrough
Bringing together three disparate mathematical frameworks required:
- Novel approaches to signal weighting and combination
- Revolutionary Order Flow Polarity Index development
- Advanced T3 smoothing implementation
- Balanced signal generation preventing directional bias
Months of intensive research culminated in breakthrough moments when the mathematics finally aligned with market reality. The result is an indicator that reveals market structure invisible to conventional analysis while maintaining practical trading utility.
🎯 PRACTICAL IMPLEMENTATION
Getting Started
1. Apply indicator with default settings
2. Select appropriate theme for your markets
3. Observe dashboard metrics during different market conditions
4. Practice signal identification without trading
5. Gradually adjust parameters based on observations
Signal Confirmation Process
- Never trade on score alone - verify quality rating
- Confirm OFPI alignment with intended direction
- Check fractal grid level proximity for timing
- Ensure Möbius field strength supports position size
- Validate against HTF trend for bias confirmation
Performance Monitoring
- Track win rate in dashboard for strategy assessment
- Monitor component contributions for optimization
- Adjust threshold based on desired signal frequency
- Document performance across different market regimes
🌟 UNIQUE INNOVATIONS
1. First Integration of Langlands Program mathematics with practical trading
2. Revolutionary OFPI with T3 smoothing and momentum detection
3. Operadic Composition using category theory for signal democracy
4. Dynamic Fractal Grid with projected L-Score calculations
5. Multi-Dimensional Visualization through morphism flow portals
6. Regime-Adaptive Background showing market energy intensity
7. Balanced Signal Generation preventing directional bias
8. Professional Dashboard with institutional-grade metrics
📚 EDUCATIONAL VALUE
The LOMV serves as both a practical trading tool and an educational gateway to advanced mathematics. Traders gain exposure to:
- Pure mathematics applications in markets
- Category theory and operadic composition
- Number theory through Möbius function implementation
- Harmonic analysis via L-function calculations
- Advanced signal processing through T3 smoothing
⚖️ RESPONSIBLE USAGE
This indicator represents advanced mathematical research applied to market analysis. While the underlying mathematics are rigorously implemented, markets remain inherently unpredictable.
Key Principles:
- Use as part of comprehensive trading strategy
- Implement proper risk management at all times
- Backtest thoroughly before live implementation
- Understand that past performance does not guarantee future results
- Never risk more than you can afford to lose
The mathematics reveal deep market structure, but successful trading requires discipline, patience, and sound risk management beyond any indicator.
🔮 CONCLUSION
The Langlands-Operadic Möbius Vortex represents a quantum leap forward in technical analysis, bringing PhD-level pure mathematics to practical trading while maintaining visual elegance and usability.
From the harmonic analysis of the Langlands Program to the democratic composition of operadic theory, from the number-theoretic precision of the Möbius function to the revolutionary Order Flow Polarity Index, every component works in mathematical harmony to reveal the hidden order within market chaos.
This is more than an indicator - it's a mathematical lens that transforms how you see and understand market structure.
Trade with mathematical precision. Trade with the LOMV.
*"Mathematics is the language with which God has written the universe." - Galileo Galilei*
*In markets, as in nature, profound mathematical beauty underlies apparent chaos. The LOMV reveals this hidden order.*
— Dskyz, Trade with insight. Trade with anticipation.

(Mustang Algo) Stochastic RSI + Triple EMAStochastic RSI + Triple EMA (StochTEMA)
Overview
The Stochastic RSI + Triple EMA indicator combines the Stochastic RSI oscillator with a Triple Exponential Moving Average (TEMA) overlay to generate clear buy and sell signals on the price chart. By measuring RSI overbought/oversold conditions and confirming trend direction with TEMA, this tool helps traders identify high-probability entries and exits while filtering out noise in choppy markets.
Key Features
Stochastic RSI Calculation
Computes a standard RSI over a user-defined period (default 50).
Applies a Stochastic oscillator to the RSI values over a second user-defined period (default 50).
Smooths the %K line by taking an SMA over a third input (default 3), and %D is an SMA of %K over another input (default 3).
Defines oversold when both %K and %D are below 20, and overbought when both are above 80.
Triple EMA (TEMA)
Calculates three successive EMAs on the closing price with the same length (default 9).
Combines them using TEMA = 3×(EMA1 – EMA2) + EMA3, producing a fast-reacting trend line.
Bullish trend is identified when price > TEMA and TEMA is rising; bearish trend when price < TEMA and TEMA is falling; neutral/flat when TEMA change is minimal.
Signal Logic
Strong Buy: Previous bar’s Stoch RSI was oversold (both %K and %D < 20), %K crosses above %D, and TEMA is in a bullish trend.
Medium Buy: %K crosses above %D (without requiring oversold), TEMA is bullish, and previous %K < 50.
Weak Buy: Previous bar’s %K and %D were oversold, %K crosses above %D, TEMA is flat or bullish (not bearish).
Strong Sell: Previous bar’s Stoch RSI was overbought (both %K and %D > 80), %K crosses below %D, and TEMA is bearish.
Medium Sell: %K crosses below %D (without requiring overbought), TEMA is bearish, and previous %K > 50.
Weak Sell: Previous bar’s %K and %D were overbought, %K crosses below %D, TEMA is flat or bearish (not bullish).
Visual Elements on Chart
TEMA Line: Plotted in cyan (#00BCD4) with a medium-thick line for clear trend visualization.
Buy/Sell Markers:
BUY STRONG: Lime label below the candle
BUY MEDIUM: Green triangle below the candle
BUY WEAK: Semi-transparent green circle below the candle
SELL STRONG: Red label above the candle
SELL MEDIUM: Orange triangle above the candle
SELL WEAK: Semi-transparent orange circle above the candle
Candle & Background Coloring: When a strong buy or sell signal occurs, the candle body is tinted (semi-transparent lime/red) and the chart background briefly flashes light green (buy) or light red (sell).
Dynamic Support/Resistance:
On a strong buy signal, a green dot is plotted under that bar’s low as a temporary support marker.
On a strong sell signal, a red dot is plotted above that bar’s high as a temporary resistance marker.
Alerts
Strong Buy Alert: Triggered when Stoch RSI is oversold, %K crosses above %D, and TEMA is bullish.
Strong Sell Alert: Triggered when Stoch RSI is overbought, %K crosses below %D, and TEMA is bearish.
General Buy Alert: Triggered on any bullish crossover (%K > %D) when TEMA is not bearish.
General Sell Alert: Triggered on any bearish crossover (%K < %D) when TEMA is not bullish.
Inputs
Stochastic RSI Settings (group “Stochastic RSI”):
K (smoothK): Period length for smoothing the %K line (default 3, minimum 1)
D (smoothD): Period length for smoothing the %D line (default 3, minimum 1)
RSI Length (lengthRSI): Number of bars used for the RSI calculation (default 50, minimum 1)
Stochastic Length (lengthStoch): Number of bars for the Stochastic oscillator applied to RSI (default 50, minimum 1)
RSI Source (src): Price source for the RSI (default = close)
TEMA Settings (group “Triple EMA”):
TEMA Length (lengthTEMA): Number of bars used for each of the three EMAs (default 9, minimum 1)
How to Use
Add the Script
Copy and paste the indicator code into TradingView’s Pine Editor (version 6).
Save the script and add it to your chart as “Stochastic RSI + Triple EMA (StochTEMA).”
Adjust Inputs
Choose shorter lengths for lower timeframes (e.g., intraday scalping) and longer lengths for higher timeframes (e.g., swing trading).
Fine-tune the Stochastic RSI parameters (K, D, RSI Length, Stochastic Length) to suit the volatility of the instrument.
Modify TEMA Length if you prefer a faster or slower moving average response.
Interpret Signals
Primary Entries/Exits: Focus on “BUY STRONG” and “SELL STRONG” signals, as they require both oversold/overbought conditions and a confirming TEMA trend.
Confirmation Signals: Use “BUY MEDIUM”/“BUY WEAK” to confirm or add to an existing position when the market is trending. Similarly, “SELL MEDIUM”/“SELL WEAK” can be used to scale out or confirm bearish momentum.
Support/Resistance Dots: These help identify recent swing lows (green dots) and swing highs (red dots) that were tagged by strong signals—useful to place stop-loss or profit-target orders.
Set Alerts
Open the Alerts menu (bell icon) in TradingView, choose this script, and select the desired alert condition (e.g., “BUY Signal Strong”).
Configure notifications (popup, email, webhook) according to your trading workflow.
Notes & Best Practices
Filtering False Signals: By combining Stoch RSI crossovers with TEMA trend confirmation, most false breakouts during choppy price action are filtered out.
Timeframe Selection: This indicator works on all timeframes, but shorter timeframes may generate frequent signals—consider higher-timeframe confirmation when trading lower timeframes.
Risk Management: Always use proper position sizing and stop-loss placement. An “oversold” or “overbought” reading can remain extended for some time in strong trends.
Backtesting/Optimization: Before live trading, backtest different parameter combinations on historical data to find the optimal balance between sensitivity and reliability for your chosen instrument.
No Guarantee of Profits: As with any technical indicator, past performance does not guarantee future results. Use in conjunction with other forms of analysis (volume, price patterns, fundamentals).
Author: Your Name or Username
Version: 1.0 (Pine Script v6)
Published: June 2025
Feel free to customize input values and visual preferences. If you find bugs or have suggestions for improvements, open an issue or leave a comment below. Trade responsibly!

EMA Pullback System 1:5 RRR [SL]EMA Trend Pullback System (1:5 RRR)
Summary:
This indicator is designed to identify high-probability pullback opportunities along the main trend, providing trade signals that target a high 1:5 Risk/Reward Ratio. It is a trend-following strategy built for patient traders who wait for optimal setups.
Strategy Logic:
The system is based on three Exponential Moving Averages (EMAs): 21, 50, and 200.
BUY Signal:
Trend (Uptrend): The price must be above the 200 EMA.
Pullback: The price must pull back into the "Dynamic Support Zone" between the 21 EMA and 50 EMA.
Confirmation: A strong Bullish Confirmation Candle (e.g., Bullish Engulfing) must form within this zone.
SELL Signal:
Trend (Downtrend): The price must be below the 200 EMA.
Pullback: The price must rally back into the "Dynamic Resistance Zone" between the 21 EMA and 50 EMA.
Confirmation: A strong Bearish Confirmation Candle (e.g., Bearish Engulfing) must form within this zone.
Key Features:
Clearly plots the 21, 50, and 200 EMAs on the chart.
Displays BUY and SELL labels when the rules are met.
Automatically calculates and plots Stop Loss (SL) and Take Profit (TP) levels for each signal.
The Risk/Reward Ratio for the Take Profit level is customizable in the settings (Default: 1:5).
How to Use:
Best suited for higher timeframes like H1 and H4.
It is crucial to wait for the signal candle to close before considering an entry.
While this is an automated tool, for best results, combine its signals with your own analysis of Price Action and Market Structure.
Disclaimer:
This is an educational tool and not financial advice. Trading involves substantial risk. Always use proper risk management. It is essential to backtest any strategy before deploying it with real capital.

Enhanced BTC Order Block IndicatorThe script you provided is an "Enhanced BTC Order Block Indicator" written in Pine Script v5 for TradingView. It is designed to identify and visually mark Order Blocks (OBs) on a Bitcoin (BTC) price chart, specifically tailored for a high-frequency scalping strategy on the 5-minute (M5) timeframe. Order Blocks are key price zones where institutional traders are likely to have placed significant buy or sell orders, making them high-probability areas for reversals or continuations. The script incorporates customizable filters, visual indicators, and alert functionality to assist traders in executing the strategy outlined earlier.
Key Features and Functionality
Purpose:
The indicator detects bullish Order Blocks (buy zones) and bearish Order Blocks (sell zones) based on a predefined percentage price movement (default 0.5–1%) and volume confirmation.
It marks these zones on the chart with colored boxes and provides alerts when an OB is detected.
User-Configurable Inputs:
Price Move Range: minMovePercent (default 0.5%) and maxMovePercent (default 1.0%) define the acceptable price movement range for identifying OBs.
Volume Threshold: volumeThreshold (default 1.5x average volume) ensures OB detection is backed by significant trading activity.
Lookback Period: lookback (default 10 candles) determines how many previous candles are analyzed to find the last candle before a strong move.
Wick/Body Option: useWick (default false) allows users to choose whether the OB zone is based on the candle’s wick or body.
Colors: bullishOBColor (default green) and bearishOBColor (default red) set the visual appearance of OB boxes.
Box Extension: boxExtension (default 100 bars) controls how far the OB box extends to the right on the chart.
RSI Filter: useRSI (default true) enables an RSI filter, with rsiLength (default 14), rsiBullishThreshold (default 50), and rsiBearishThreshold (default 50) for trend confirmation.
M15 Support/Resistance: useSR (default true) and srLookback (default 20) integrate M15 timeframe swing highs and lows for additional OB validation.
Core Logic:
Bullish OB Detection: Identifies a strong upward move (0.5–1%) with volume above the threshold. It then looks back to the last bearish candle before the move to define the OB zone. RSI > 50 and proximity to M15 support/resistance (optional) enhance confirmation.
Bearish OB Detection: Identifies a strong downward move (0.5–1%) with volume confirmation, tracing back to the last bullish candle. RSI < 50 and M15 resistance proximity (optional) add validation.
The OB zone is drawn as a rectangle from the high to low of the identified candle, extended rightward.
Visual Output:
Boxes: Uses box.new to draw OB zones, with left set to the previous bar (bar_index ), right extended by boxExtension, top and bottom defined by the OB’s high and low prices. Each box includes a text label ("Bullish OB" or "Bearish OB") and is semi-transparent.
Colors distinguish between bullish (green) and bearish (red) OBs.
Alerts:
Global alertcondition definitions trigger notifications for "Bullish OB Detected" and "Bearish OB Detected" when the respective conditions are met, displaying the current close price in the message.
Helper Functions:
f_priceChangePercent: Calculates the percentage price change between open and close prices.
isNearSR: Checks if the price is within 0.2% of M15 swing highs or lows for support/resistance confluence.
How It Works
The script runs on each candle, evaluating the current price action against the user-defined criteria.
When a bullish or bearish move is detected (meeting the percentage, volume, RSI, and S/R conditions), it identifies the preceding candle to define the OB zone.
The OB is then visualized on the chart, and an alert is triggered if configured in TradingView.
Use Case
This indicator is tailored for your BTC scalping strategy, where trades last 1–15 minutes targeting 0.3–0.5% gains. It helps traders spot institutional order zones on the M5 chart, confirmed by secondary M1 analysis, and integrates with your use of EMAs, RSI, and volume. The customizable settings allow adaptation to varying market conditions or personal preferences.
Limitations
The M15 S/R detection is simplified (using swing highs/lows), which may not always align perfectly with manual support/resistance levels.
Alerts depend on TradingView’s alert system and require manual setup.
Performance may vary with high volatility or low-volume periods, necessitating parameter adjustments.

RTH Session Range Position (0-100) with EMAA Pine Script indicator designed to help traders understand where the current price is located within the Regular Trading Hours (RTH) session range, from 0 (session low) to 100 (session high). It also plots a smoothed EMA of this position to provide insight into momentum or trend during the RTH session.
What the Indicator Does
Defines RTH (Regular Trading Hours):
Start: 9:30 AM
End: 4:00 PM
These are typical US equity market hours.
Tracks the session's high and low during RTH:
sessionHigh and sessionLow update only during RTH.
Calculates position of the current price within the RTH range:
Formula: ((close - sessionLow) / (sessionHigh - sessionLow)) * 100
Result is a percentage:
0 = at session low
100 = at session high
50 = middle of session range
Calculates an EMA of that position (posEMA):
Smooths out the raw position to help visualize momentum within the range.
Plots and table:
Plots pos and posEMA on a separate chart pane.
Adds horizontal lines at key levels (0, 30, 50, 70, 100).
Table shows current values for Position, EMA, and Range.
Visual cues:
bgcolor highlights when pos crosses over or under the EMA — potential momentum shifts.
Alerts:
Cross above/below 50 (session midpoint).
Cross above/below EMA.
How to Use It Effectively
1. Session Strength & Momentum
Position above 70: Price is near session highs — strong upward momentum.
Position below 30: Price is near session lows — strong downward momentum.
Use the EMA of position to filter out noise and identify trends.
2. Breakout or Reversal Detection
Cross above EMA: Momentum may be turning bullish.
Cross below EMA: Momentum may be turning bearish.
These crosses (especially near mid-levels like 50) can hint at session trend shifts.
3. Range Context for Entries
If you're a mean-reversion trader, look for:
Price > 70 + turning down below EMA → possible short.
Price < 30 + turning up above EMA → possible long.
For breakout traders, you might wait for:
Crosses above 70 with EMA support.
Crosses below 30 with EMA resistance.
4. Confirmation Tool
Use this indicator alongside others to confirm:
Whether price action has strength within the day.
Whether breakouts have real momentum or are extended already.

Stochastic XThe "Stochastic X" script is a customizable momentum oscillator designed to help traders identify potential overbought and oversold conditions, as well as trend reversals, by analyzing the relationship between a security's closing price and its price range over a specified period. This indicator is particularly useful for traders looking to fine-tune their entry and exit points based on momentum shifts.
🔧 Indicator Settings and Customization
The script offers several user-configurable settings to tailor the indicator to specific trading strategies:
In addition to the source type, %K Period, %D Period, and Signal line periods you can now change moving average calculation for the stochastic and signal lines.
This script allows selection among various moving average methods (e.g., SMA, EMA, WMA, T3) for smoothing the %K and signal lines. Different methods can affect the responsiveness of the indicator.
🎨 Interpreting Background Colors
The script enhances visual analysis by changing the background color of the indicator panel based on the %K line's value:
Green Background: Indicates that the %K line is above 50, suggesting bullish momentum.
Red Background: Signifies that the %K line is below 50, pointing to bearish momentum.
Light Green Overlay: Appears when the %K line exceeds 80, highlighting overbought conditions.
Light Red Overlay: Shows up when the %K line falls below 20, indicating oversold conditions.
These visual cues assist traders in quickly assessing market momentum and potential reversal.
📈 Trading Strategies Using Stochastic X
Traders can utilize the Stochastic X indicator in various ways:
Overbought/Oversold Conditions:
A %K value above 80 may suggest that the asset is overbought, potentially signaling a price correction.
A %K value below 20 could indicate that the asset is oversold, possibly leading to a price rebound.
Signal Line Crossovers:
When the %K line crosses above the signal line, it may be interpreted as a bullish signal.
Conversely, a %K line crossing below the signal line might be seen as a bearish signal.
Divergence Analysis:
If the price makes a new high while the %K line does not, this bearish divergence could precede a price decline.
If the price hits a new low but the %K line forms a higher low, this bullish divergence might signal an upcoming price increase.
Trend Confirmation:
Sustained %K values above 50 can confirm an uptrend.
Persistent %K values below 50 may validate a downtrend.
In this chart, observe how the background colors change in response to the %K line's value, providing immediate visual feedback on market conditions. The crossovers between the %K and signal lines offer potential entry and exit points, while the overbought and oversold overlays help identify possible reversal zones.
⚙️ Adjusting Settings for Optimal Use
The Stochastic X indicator's flexibility allows traders to adjust settings to match their trading style and the specific asset's behavior:
Short-Term Trading: Use shorter periods (e.g., 5 for %K) and more responsive moving averages (e.g., WMA, VWMA, EMA, DEMA, TEMA, HMA) to capture quick market movements.
Long-Term Trading: Opt for longer periods (e.g., 14 for %K) and smoother moving averages (e.g., SMA, RMA, T3) to filter out noise and focus on broader trends.
Volatile Markets: Consider using the T3 moving average for its smoothing capabilities, helping to reduce false signals in choppy markets.
By experimenting with different settings, traders can fine-tune the indicator to better suit their analysis and improve decision-making.

US30 HMA Signal v2.8Indicator Description – US30 HMA Signal v2.8
Overview:
The US30 HMA Signal indicator is designed to generate Buy and Sell signals based on the crossover of three Hull Moving Averages (HMAs). The indicator focuses on identifying momentum shifts and directional bias using the 9, 21, and 50 HMA structures, optimised for the US30 (Dow Jones) index.
⸻
Indicator Components:
1. Hull Moving Averages (HMAs):
• 9 HMA (Green): Fastest HMA, responds quickly to price changes.
• 21 HMA (Amber): Medium-term HMA, acts as a transitional filter.
• 50 HMA (Red): Slowest HMA, defines the broader trend direction.
⸻
Logic and Signal Conditions:
1. Session Filter:
• Signals are only generated during the US session, defined as starting at 13:30 BST.
2. Directional Bias:
• Bullish Bias: Occurs when both the 9 HMA and 21 HMA are above the 50 HMA.
• Bearish Bias: Occurs when both the 9 HMA and 21 HMA are below the 50 HMA.
3. Crossover Logic:
• Buy Signal: Prints when the 9 HMA crosses above the 21 HMA while the directional bias is bullish.
• Sell Signal: Prints when the 9 HMA crosses below the 21 HMA while the directional bias is bearish.
4. Minimum Bar Spacing:
• To avoid signal clustering, a minimum bar spacing of 5 bars is implemented between consecutive signals.
⸻
Plotting:
• Buy Signal: Displays as a green label below the candle with the text “BUY.”
• Sell Signal: Displays as a red label above the candle with the text “SELL.”
⸻
Purpose and Usage:
• The indicator is designed for traders looking to capture momentum shifts in the US30 index using HMA crossovers.
• It is best applied on the 5-minute timeframe to balance signal frequency and reliability.
• The strict session filter ensures signals are only generated during the most volatile period, aligning with US market activity.
IBD Style Candles [tradeviZion]IBD Style Candles - Visualize Price Bars Like the Pros
Transform your chart with institutional-grade IBD-style bars and customizable moving averages for both daily and weekly timeframes. This indicator helps you visualize price action the way professionals at Investors Business Daily do.
What This Indicator Offers:
IBD-style bar visualization (clean, professional appearance)
Customizable coloring based on price movement or previous close
Automatic timeframe detection for appropriate moving averages
Four customizable moving averages for daily timeframes (10, 21, 50, 200)
Four customizable moving averages for weekly timeframes (10, 20, 30, 40)
Options to use SMAs or EMAs with adjustable colors and line widths
"The IBD-style bars provide a cleaner view of price action, allowing you to focus on market structure without the visual noise of traditional candles."
How to Apply the IBD-Style Bars:
On your TradingView chart, select "Bars" as the chart type from the main chart type selection menu (next to the time interval options).
Right-click on the chart and select "Settings".
Go to the "Symbol" tab.
Uncheck the "Thin Bars" option to display thicker bars.
Set the "Up Color" and "Down Color" opacity to 0 for a clean IBD-style appearance.
Enable "IBD-style Candles" from the script's settings.
To revert to the original chart style, repeat the above steps and restore the default settings.
Moving Average Configuration:
The indicator automatically detects your timeframe and displays the appropriate moving averages:
Daily Timeframe Moving Averages:
10-day moving average (SMA/EMA)
21-day moving average (SMA/EMA)
50-day moving average (SMA/EMA)
200-day moving average (SMA/EMA)
Weekly Timeframe Moving Averages:
10-week moving average (SMA/EMA)
20-week moving average (SMA/EMA)
30-week moving average (SMA/EMA)
40-week moving average (SMA/EMA)
Usage Tips:
Enable "Color bars based on previous close" to identify momentum shifts based on prior candle closes
Customize colors to match your chart theme or preference
Enable only the moving averages relevant to your trading strategy
For cleaner charts, reduce the number of visible moving averages
For stock trading, the 10/21/50/200 daily and 10/40 weekly MAs are most commonly used by institutions
// Example configuration for different timeframes
if timeframe.isweekly
// Weekly configuration
showSMA1_Weekly = true // 10-week MA
showSMA4_Weekly = true // 40-week MA
else
// Daily configuration
showMA2_Daily = true // 21-day MA
showMA3_Daily = true // 50-day MA
showMA4_Daily = true // 200-day MA
While the IBD style provides clarity, remember that no visualization method guarantees trading success. Always combine with proper analysis and risk management.
If you found this indicator helpful, please consider leaving a comment or suggestion for future improvements. Happy trading!

EXODUS EXODUS by (DAFE) Trading Systems
EXODUS is a sophisticated trading algorithm built by Dskyz (DAFE) Trading Systems for competitive and competition purposes, designed to identify high-probability trades with robust risk management. this strategy leverages a multi-signal voting system, combining three core components—SPR, VWMO, and VEI—alongside ADX, choppiness filters, and ATR-based volatility gates to ensure trades are taken only in favorable market conditions. the algo uses a take-profit to stop-loss ratio, dynamic position sizing, and a strict voting mechanism requiring all signals to align before entering a trade.
EXODUS was not overfitted for any specific symbol. instead, it uses a generic tuned setting, making it versatile across various markets. while it can trade futures, it’s not currently set up for it but has the potential to do more with further development. visuals are intentionally minimal due to its competition focus, prioritizing performance over aesthetics. a more visually stunning version may be released in the future with enhanced graphics.
The Unique Core Components Developed for EXODUS
SPR (Session Price Recalibration)
SPR measures momentum during regular trading hours (RTH, 0930-1600, America/New_York) to catch session-specific trends.
spr_lookback = input.int(15, "SPR Lookback") this sets how many bars back SPR looks to calculate momentum (default 15 bars). it compares the current session’s price-volume score to the score 15 bars ago to gauge momentum strength.
how it works: a longer lookback smooths out the signal, focusing on bigger trends. a shorter one makes SPR more sensitive to recent moves.
how to adjust: on a 1-hour chart, 15 bars is 15 hours (about 2 trading days). if you’re on a shorter timeframe like 5 minutes, 15 bars is just 75 minutes, so you might want to increase it to 50 or 100 to capture more meaningful trends. if you’re trading a choppy stock, a shorter lookback (like 5) can help catch quick moves, but it might give more false signals.
spr_threshold = input.float (0.7, "SPR Threshold")
this is the cutoff for SPR to vote for a trade (default 0.7). if SPR’s normalized value is above 0.7, it votes for a long; below -0.7, it votes for a short.
how it works: SPR normalizes its momentum score by ATR, so this threshold ensures only strong moves count. a higher threshold means fewer trades but higher conviction.
how to adjust: if you’re getting too few trades, lower it to 0.5 to let more signals through. if you’re seeing too many false entries, raise it to 1.0 for stricter filtering. test on your chart to find a balance.
spr_atr_length = input.int(21, "SPR ATR Length") this sets the ATR period (default 21 bars) used to normalize SPR’s momentum score. ATR measures volatility, so this makes SPR’s signal relative to market conditions.
how it works: a longer ATR period (like 21) smooths out volatility, making SPR less jumpy. a shorter one makes it more reactive.
how to adjust: if you’re trading a volatile stock like TSLA, a longer period (30 or 50) can help avoid noise. for a calmer stock, try 10 to make SPR more responsive. match this to your timeframe—shorter timeframes might need a shorter ATR.
rth_session = input.session("0930-1600","SPR: RTH Sess.") rth_timezone = "America/New_York" this defines the session SPR uses (0930-1600, New York time). SPR only calculates momentum during these hours to focus on RTH activity.
how it works: it ignores pre-market or after-hours noise, ensuring SPR captures the main market action.
how to adjust: if you trade a different session (like London hours, 0300-1200 EST), change the session to match. you can also adjust the timezone if you’re in a different region, like "Europe/London". just make sure your chart’s timezone aligns with this setting.
VWMO (Volume-Weighted Momentum Oscillator)
VWMO measures momentum weighted by volume to spot sustained, high-conviction moves.
vwmo_momlen = input.int(21, "VWMO Momentum Length") this sets how many bars back VWMO looks to calculate price momentum (default 21 bars). it takes the price change (close minus close 21 bars ago).
how it works: a longer period captures bigger trends, while a shorter one reacts to recent swings.
how to adjust: on a daily chart, 21 bars is about a month—good for trend trading. on a 5-minute chart, it’s just 105 minutes, so you might bump it to 50 or 100 for more meaningful moves. if you want faster signals, drop it to 10, but expect more noise.
vwmo_volback = input.int(30, "VWMO Volume Lookback") this sets the period for calculating average volume (default 30 bars). VWMO weights momentum by volume divided by this average.
how it works: it compares current volume to the average to see if a move has strong participation. a longer lookback smooths the average, while a shorter one makes it more sensitive.
how to adjust: for stocks with spiky volume (like NVDA on earnings), a longer lookback (50 or 100) avoids overreacting to one-off spikes. for steady volume stocks, try 20. match this to your timeframe—shorter timeframes might need a shorter lookback.
vwmo_smooth = input.int(9, "VWMO Smoothing")
this sets the SMA period to smooth VWMO’s raw momentum (default 9 bars).
how it works: smoothing reduces noise in the signal, making VWMO more reliable for voting. a longer smoothing period cuts more noise but adds lag.
how to adjust: if VWMO is too jumpy (lots of false votes), increase to 15. if it’s too slow and missing trades, drop to 5. test on your chart to see what keeps the signal clean but responsive.
vwmo_threshold = input.float(10, "VWMO Threshold") this is the cutoff for VWMO to vote for a trade (default 10). above 10, it votes for a long; below -10, a short.
how it works: it ensures only strong momentum signals count. a higher threshold means fewer but stronger trades.
how to adjust: if you want more trades, lower it to 5. if you’re getting too many weak signals, raise it to 15. this depends on your market—volatile stocks might need a higher threshold to filter noise.
VEI (Velocity Efficiency Index)
VEI measures market efficiency and velocity to filter out choppy moves and focus on strong trends.
vei_eflen = input.int(14, "VEI Efficiency Smoothing") this sets the EMA period for smoothing VEI’s efficiency calc (bar range / volume, default 14 bars).
how it works: efficiency is how much price moves per unit of volume. smoothing it with an EMA reduces noise, focusing on consistent efficiency. a longer period smooths more but adds lag.
how to adjust: for choppy markets, increase to 20 to filter out noise. for faster markets, drop to 10 for quicker signals. this should match your timeframe—shorter timeframes might need a shorter period.
vei_momlen = input.int(8, "VEI Momentum Length") this sets how many bars back VEI looks to calculate momentum in efficiency (default 8 bars).
how it works: it measures the change in smoothed efficiency over 8 bars, then adjusts for inertia (volume-to-range). a longer period captures bigger shifts, while a shorter one reacts faster.
how to adjust: if VEI is missing quick reversals, drop to 5. if it’s too noisy, raise to 12. test on your chart to see what catches the right moves without too many false signals.
vei_threshold = input.float(4.5, "VEI Threshold") this is the cutoff for VEI to vote for a trade (default 4.5). above 4.5, it votes for a long; below -4.5, a short.
how it works: it ensures only strong, efficient moves count. a higher threshold means fewer trades but higher quality.
how to adjust: if you’re not getting enough trades, lower to 3. if you’re seeing too many false entries, raise to 6. this depends on your market—fast stocks like NQ1 might need a lower threshold.
Features
Multi-Signal Voting: requires all three signals (SPR, VWMO, VEI) to align for a trade, ensuring high-probability setups.
Risk Management: uses ATR-based stops (2.1x) and take-profits (4.1x), with dynamic position sizing based on a risk percentage (default 0.4%).
Market Filters: ADX (default 27) ensures trending conditions, choppiness index (default 54.5) avoids sideways markets, and ATR expansion (default 1.12) confirms volatility.
Dashboard: provides real-time stats like SPR, VWMO, VEI values, net P/L, win rate, and streak, with a clean, functional design.
Visuals
EXODUS prioritizes performance over visuals, as it was built for competitive and competition purposes. entry/exit signals are marked with simple labels and shapes, and a basic heatmap highlights market regimes. a more visually stunning update may be released later, with enhanced graphics and overlays.
Usage
EXODUS is designed for stocks and ETFs but can be adapted for futures with adjustments. it performs best in trending markets with sufficient volatility, as confirmed by its generic tuning across symbols like TSLA, AMD, NVDA, and NQ1. adjust inputs like SPR threshold, VWMO smoothing, or VEI momentum length to suit specific assets or timeframes.
Setting I used: (Again, these are a generic setting, each security needs to be fine tuned)
SPR LB = 19 SPR TH = 0.5 SPR ATR L= 21 SPR RTH Sess: 9:30 – 16:00
VWMO L = 21 VWMO LB = 18 VWMO S = 6 VWMO T = 8
VEI ES = 14 VEI ML = 21 VEI T = 4
R % = 0.4
ATR L = 21 ATR M (S) =1.1 TP Multi = 2.1 ATR min mult = 0.8 ATR Expansion = 1.02
ADX L = 21 Min ADX = 25
Choppiness Index = 14 Chop. Max T = 55.5
Backtesting: TSLA
Frame: Jan 02, 2018, 08:00 — May 01, 2025, 09:00
Slippage: 3
Commission .01
Disclaimer
this strategy is for educational purposes. past performance is not indicative of future results. trading involves significant risk, and you should only trade with capital you can afford to lose. always backtest and validate any strategy before using it in live markets.
(This publishing will most likely be taken down do to some miscellaneous rule about properly displaying charting symbols, or whatever. Once I've identified what part of the publishing they want to pick on, I'll adjust and repost.)
About the Author
Dskyz (DAFE) Trading Systems is dedicated to building high-performance trading algorithms. EXODUS is a product of rigorous research and development, aimed at delivering consistent, and data-driven trading solutions.
Use it with discipline. Use it with clarity. Trade smarter.
**I will continue to release incredible strategies and indicators until I turn this into a brand or until someone offers me a contract.
2025 Created by Dskyz, powered by DAFE Trading Systems. Trade smart, trade bold.

Schaff Trend Cycle (STC) - t0rdn3Schaff Trend Cycle (STC)
By t0rdn3 (original STC by , now with more descriptive naming)
Description
The Schaff Trend Cycle (STC) is a momentum-based oscillator that combines the speed of a fast EMA crossover with cyclical normalization. Developed by Doug Schaff, it identifies market turning points more responsively than MACD or RSI.
How It Works
1. EMA Difference : Calculates the difference between two EMAs of the source series (default: close).
2. Cycle Percentage : Normalizes that difference to a 0–100 range over the cycle period.
3. Smoothing : Applies exponential smoothing twice—first to the cycle percentage, then to its normalized cycles—to reduce noise.
4. Final STC Line : Produces a smoothed oscillator oscillating between 0 and 100.
Alerts
- "STC turned down above 75" : Fires once when STC makes a local peak above the upper threshold ( 75 ).
- "STC turned up below 25" : Fires once when STC makes a local trough below the lower threshold ( 25 ).
Inputs
Cycle Period : 12 — Lookback in bars for normalization
Fast EMA Length : 26 — Period of the fast EMA
Slow EMA Length : 50 — Period of the slow EMA
Smoothing Factor : 0.5 — Exponential smoothing coefficient (0–1)
Usage
Readings above 75 indicate an overbought cycle; readings below 25 indicate an oversold cycle. Crossings of the 50 midline can confirm trend direction:
- STC rising through 50 → bullish shift
- STC falling through 50 → bearish shift
Combine STC with price action or other trend filters to improve signal quality. You can adjust the cycle period and EMA lengths to match different timeframes or instruments.

RSI_Heikinashi📜 Title:
Heikin-Ashi RSI Candle Plot with Multi-Timeframe Analysis and EMA Overlay
📖 Full Description:
This is an original custom indicator that transforms the traditional Relative Strength Index (RSI) into a Heikin-Ashi (HA) candle representation, allowing traders to visualize RSI trends with greater clarity, less noise, and multi-timeframe perspective.
🛠️ Core Concept and Original Method:
Rather than plotting a single RSI line, this script recalculates RSI into a Heikin-Ashi candle format, using a double EMA smoothing method on the RSI data itself.
Here's how the transformation works:
RSI Calculation:
RSI is computed traditionally using Wilder's Moving Average (RMA) for smoothing gains and losses.
The RSI period and price source are fully customizable (default length = 28, source = close).
Heikin-Ashi Style Smoothing (applied to RSI):
The HA Close is calculated as the EMA of the average between the current RSI and previous HA Close.
The HA Open is calculated as the EMA of the average between the previous HA Open and the current HA Close.
The HA High and HA Low are dynamically calculated based on the maximum/minimum values of the current RSI, HA Open, and HA Close.
Smoothing is done via 5-period EMA, which adds a unique layer of trend smoothing without traditional price-based HA calculation.
Multi-Timeframe Comparison:
In addition to plotting the chart timeframe HA RSI, the indicator retrieves the 1-hour timeframe HA RSI using request.security.
This allows traders to align trades with higher timeframe RSI trends, a powerful technique for multi-timeframe confirmation.
50 EMA Overlay:
A 50-period Exponential Moving Average (EMA) is plotted over both the chart timeframe HA RSI and the 1-hour HA RSI.
EMA acts as a trend filter or dynamic support/resistance for RSI behavior.
RSI Bands and Visual Aids:
Standard RSI bands at 70 (Overbought), 50 (Midline), and 30 (Oversold) are plotted.
A shaded background between the 30–70 levels helps highlight RSI range-bound movements versus breakout momentum.
🔥 Why this script is original and useful:
Unique Application:
This is not a simple RSI plot or standard Heikin-Ashi candle — it is a specialized smoothing method applied directly to RSI values for a clearer, noise-reduced momentum reading.
Multi-Timeframe Advantage:
Unlike typical RSI indicators, it includes a 1-hour timeframe comparison alongside the chart timeframe, improving decision-making across intraday and swing strategies.
Advanced Smoothing Logic:
Double EMA smoothing of RSI and HA-style recalculations offer a much smoother signal than traditional RSI or basic RSI/EMA crossovers.
Visualized Trend Strength:
Using colored candles instead of just a line enhances readability and gives an intuitive sense of momentum direction, strength, and possible reversals.
Fully Customizable:
Traders can adjust the RSI period and source depending on asset volatility or timeframe preferences.
📋 How to Use:
Look for HA RSI candles color changes for early momentum shifts.
Use the 50 EMA crossovers on HA RSI to confirm larger trend changes.
Compare chart timeframe vs 1H timeframe HA RSI for stronger signal alignment.
Watch for overbought/oversold breaks beyond the 70/30 bands for trade entries or exits.
⚙️ Inputs:
RSI Length (Default: 28)
RSI Source (Default: Close)
📢 Important Note:
This script is originally conceptualized and custom-built.
It is not a mashup of existing open-source indicators and introduces a new smoothing technique for RSI visualization.
🙏 Credits:
Script developed by Sri_RSI.
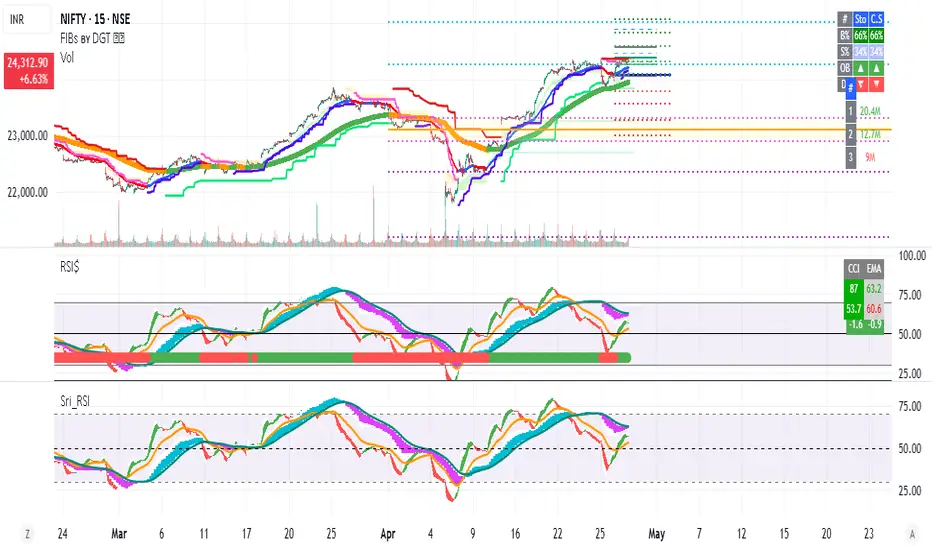
Frozen Bias Zones – Sentiment Lock-insOverview
The Frozen Bias Zones indicator visualizes market sentiment lock-ins using a combination of RSI, MACD, and OBV. It creates "bias zones" that indicate whether the market is in a sustained bullish or bearish phase. These zones are then highlighted on the chart, helping traders spot when the market is locked in a bias. The script also detects breakout events from these zones and marks them with clear labels for easier decision-making.
Features
Multi-Indicator Sentiment Analysis: Combines RSI, MACD, and OBV to detect synchronized bullish or bearish sentiment.
Frozen Bias Zones: Identifies and visually represents zones where the market has remained in a particular sentiment (bullish or bearish) for a defined period.
Breakout Alerts: Displays labels to indicate when the price breaks out of the established bias zone.
Customizable Inputs: Adjust the zone duration, RSI, MACD, and breakout label visibility.
Input Parameters
Bias Duration (biasLength)
The minimum number of candles the market must stay in a specific sentiment to consider it a "Frozen Bias Zone".
Default: 5 candles.
RSI Period (rsiPeriod)
Period for the Relative Strength Index (RSI) calculation.
Default: 14 periods.
MACD Settings
MACD Fast (macdFast): The fast-moving average period for the MACD calculation.
Default: 12.
MACD Slow (macdSlow): The slow-moving average period for the MACD calculation.
Default: 26.
MACD Signal (macdSig): The signal line period for MACD.
Default: 9.
Show Break Label (showBreakLabel)
Toggle to show labels when the price breaks out of the bias zone.
Default: True (shows label).
Bias Zone Colors
Bullish Bias Color (bullColor): The color for bullish zones (light green).
Bearish Bias Color (bearColor): The color for bearish zones (light red).
How It Works
This indicator analyzes three key market metrics to determine whether the market is in a bullish or bearish phase:
RSI (Relative Strength Index)
Measures the speed and change of price movements. RSI > 50 indicates a bullish phase, while RSI < 50 indicates a bearish phase.
MACD (Moving Average Convergence Divergence)
Measures the relationship between two moving averages of the price. A positive MACD histogram indicates bullish momentum, while a negative histogram indicates bearish momentum.
OBV (On-Balance Volume)
Uses volume flow to determine if a trend is likely to continue. A rising OBV indicates bullish accumulation, while a falling OBV indicates bearish distribution.
Bias Zone Detection
The market sentiment is considered bullish if all three indicators (RSI, MACD, and OBV) are bullish, and bearish if all three indicators are bearish.
Bullish Zone: A zone is created when the market sentiment remains bullish for the duration of the specified biasLength.
Bearish Zone: A zone is created when the market sentiment remains bearish for the duration of the specified biasLength.
These bias zones are visually represented on the chart as colored boxes (green for bullish, red for bearish).
Breakout Detection
The script automatically detects when the market exits a bias zone. If the price moves outside the bounds of the established zone (either up or down), the script will display one of the following labels:
Bias Break (Up): Indicates that the price has broken upwards out of the zone (with a green label).
Bias Break (Down): Indicates that the price has broken downwards out of the zone (with a red label).
These labels help traders easily identify potential breakout points.
Example Use Case
Bullish Market Conditions: If the RSI is above 50, the MACD histogram is positive, and OBV is increasing, the script will highlight a green bias zone. Traders can watch for potential bullish breakouts or trend continuation after the zone ends.
Bearish Market Conditions: If the RSI is below 50, the MACD histogram is negative, and OBV is decreasing, the script will highlight a red bias zone. Traders can look for potential bearish breakouts when the zone ends.
Conclusion
The Frozen Bias Zones indicator is a powerful tool for traders looking to visualize prolonged market sentiment, whether bullish or bearish. By combining RSI, MACD, and OBV, it helps traders spot when the market is "locked in" to a bias. The breakout labels make it easier to take action when the price moves outside of the established zone, potentially signaling the start of a new trend.
Instructions
To use this script:
Add the Frozen Bias Zones indicator to your TradingView chart.
Adjust the input parameters to suit your trading strategy.
Observe the colored bias zones on your chart, along with breakout labels, to make informed decisions on trend continuation or reversal.

RSI + MA + Divergence + SnR + Price levelOverview
This indicator combines several technical analysis tools to give traders a comprehensive view based on the RSI indicator. Its main features include:
RSI & Moving Averages on RSI:
RSI: Calculates the RSI based on the closing price (or a user-selected source) with a configurable period (default is 14).
EMA and WMA: Computes and plots an Exponential Moving Average (EMA with a period of 9) and a Weighted Moving Average (WMA with a period of 45) on the RSI, helping to smooth out signals and better identify trends.
Price Ladder Based on RSI:
Draws horizontal lines at specified target RSI levels (from targetRSI1 to targetRSI7, default levels ranging from 20 to 80).
Calculates a target price based on the price change relative to the averaged gains and losses, providing an estimated price level when the RSI reaches those critical levels.
Divergence Detection:
Identifies divergence between price and RSI:
Bullish Divergence: Detected when the price forms a lower low but RSI fails to confirm with a corresponding lower low, with the RSI falling under a configurable threshold (d_below).
Bearish Divergence: Detected when the price forms a higher high while the RSI does not, with the RSI exceeding a configurable upper threshold (d_upper).
Optionally displays labels on the chart to alert the trader when divergence signals are detected.
Auto Support & Resistance on RSI:
Automatically calculates and plots support and resistance lines based on the RSI over different lookback periods (e.g., 34, 89, 200 bars).
Helps traders identify key RSI levels where price reversals or breakouts might occur.
Benefits for the Trader
This indicator is designed to assist traders in their decision-making process by integrating multiple technical analysis elements:
Identifying Market Trends:
By combining the RSI with its moving averages (EMA, WMA), traders can better assess market trends and the strength of these trends, thereby improving trade entry accuracy.
Early Reversal Signals via Divergence:
Divergence signals (both bullish and bearish) can help forecast potential reversals in the market, allowing traders to adjust their strategies timely.
Determining RSI-Based Support/Resistance Levels:
Automatic identification of support and resistance levels on the RSI provides key areas where a price reversal or breakout may occur, assisting traders in setting stop-loss and take-profit levels strategically.
Price Target Forecasting with the Price Ladder:
The target price labels calculated at important RSI levels provide insights into potential price objectives, aiding in risk management and profit planning.
Flexible Configuration:
Traders can customize key parameters such as the RSI period, lengths for EMA and WMA, target RSI levels, divergence conditions, and support/resistance settings. This flexibility allows the indicator to adapt to different trading styles and strategies.
How to read data
Some use-cases
Used to estimate price according to the RSI level.
When you trade using RSI, you want to set your stop-loss or take-profit levels based on RSI. By looking at the price ladder, you know the corresponding price level to enter a trade.
Used to determine the entry zone.
RSI often reacts to its own previously established support/resistance levels. Use the Auto SnR feature to identify those zones.
Used to determine the trend.
RSI and its moving averages help identify the price trend:
Uptrend: 3 lines separate and point upward.
Downtrend: 3 lines separate and point downward.
Use WMA45 to determine the trend:
Uptrend: WMA45 is moving upward or trading above the 50 level.
Downtrend: WMA45 is moving downward or trading below the 50 level.
Sideways: WMA45 is trading around the 50 level.
Use EMA9 to confirm the trend: A crossover of EMA9 through WMA45 confirms the formation of a new trend.
Configuration
The script allows users to configure a number of important parameters to suit their analytical preferences:
RSI Settings:
RSI Length (rsiLengthInput): The number of periods used to compute the RSI (default is 14, adjustable as needed).
RSI Source (rsiSourceInput): Select the price source (default is the closing price).
RSI Color (rsiClr): The color used to display the RSI line.
Moving Averages on RSI:
EMA Length (emaLength): The period for calculating the EMA on RSI (default is 9).
WMA Length (wmaLength): The period for calculating the WMA on RSI (default is 45).
EMA Color (emaClr) and WMA Color (wmaClr): Customize the colors of the EMA and WMA lines.
Price Ladder Settings:
Toggle Price Ladder (showPrice): Enable or disable the display of the price ladder.
Target RSI Levels: targetRSI1 through targetRSI7: RSI values at which target prices are calculated (default values range from 20, 30, 40, 50, 60, 70 to 80).
Price Label Color (priceColor): The text color for displaying the target price labels.
Divergence Settings:
Divergence Toggle (calculateDivergence): Option to enable or disable divergence calculation and display.
Divergence Conditions:
d_below: RSI level below which bullish divergence is considered.
d_upper: RSI level above which bearish divergence is considered.
Display Divergence Labels (showDivergenceLabel): Option to display labels on the chart when divergence is detected.
Auto Support & Resistance on RSI:
Toggle Auto S&R (enableAutoSnR): Enable or disable automatic plotting of support and resistance levels.
Lookback Periods for Support/Resistance:
L1_lookback: Lookback period for level 1 (e.g., 34 bars).
L2_lookback: Lookback period for level 2 (e.g., 89 bars).
L3_lookback: Lookback period for level 3 (e.g., 200 bars).
Support and Resistance Colors:
rsiSupportClr: Color for the support line.
rsiResistanceClr: Color for the resistance line.
Alerts:
Divergence Alerts: Alert conditions are set up to notify the trader when bullish or bearish divergence is detected, aiding in timely decision-making.

Buy/Sell EMA Trend Filter v6Buy/Sell EMA Trend Filter v6
This indicator provides a comprehensive trading system based on EMA crossovers with trend filtering for TradingView. It's designed to identify high-probability buy and sell signals by combining short-term crossovers with longer-term trend direction confirmation.
Key Features:
EMA Crossover System: Uses fast and slow EMAs (9 and 21 by default) to generate initial signals
Trend Filtering: Confirms signals with longer-term trend direction (50 and 200 EMAs)
Automatic TP/SL Calculation: Displays clear take profit and stop loss levels based on fixed risk points
Visual Alerts: Clear buy/sell markers at the point of signal with detailed labels
Risk Management: Pre-calculated risk-to-reward setup (default 1:2 ratio)
How It Works:
Buy Signal: When the fast EMA crosses above the slow EMA while the 50 EMA is above the 200 EMA (bullish trend)
Sell Signal: When the fast EMA crosses below the slow EMA while the 50 EMA is below the 200 EMA (bearish trend)
Customizable Parameters:
Fast EMA period (default: 9)
Slow EMA period (default: 21)
Trend EMA periods (default: 50 and 200)
Fixed risk in points (default: 20)
Reward ratio (default: 2.0)
The indicator displays clear entry points with predefined stop loss and take profit levels, making it ideal for traders looking for a systematic approach to the markets. Perfect for both day trading and swing trading timeframes.
This tool combines both trend following and momentum principles to filter out low-probability trades and focus on high-quality setups where the trend and momentum align.

Range Filter Buy and Sell 5min## **Enhanced Range Filter Strategy: A Comprehensive Overview**
### **1. Introduction**
The **Enhanced Range Filter Strategy** is a powerful technical trading system designed to identify high-probability trading opportunities while filtering out market noise. It utilizes **range-based trend filtering**, **momentum confirmation**, and **volatility-based risk management** to generate precise entry and exit signals. This strategy is particularly useful for traders who aim to capitalize on trend-following setups while avoiding choppy, ranging market conditions.
---
### **2. Key Components of the Strategy**
#### **A. Range Filter (Trend Determination)**
- The **Range Filter** smooths price fluctuations and helps identify clear trends.
- It calculates an **adjusted price range** based on a **sampling period** and a **multiplier**, ensuring a dynamic trend-following approach.
- **Uptrends:** When the current price is above the range filter and the trend is strengthening.
- **Downtrends:** When the price falls below the range filter and momentum confirms the move.
#### **B. RSI (Relative Strength Index) as Momentum Confirmation**
- RSI is used to **filter out weak trades** and prevent entries during overbought/oversold conditions.
- **Buy Signals:** RSI is above a certain threshold (e.g., 50) in an uptrend.
- **Sell Signals:** RSI is below a certain threshold (e.g., 50) in a downtrend.
#### **C. ADX (Average Directional Index) for Trend Strength Confirmation**
- ADX ensures that trades are only taken when the trend has **sufficient strength**.
- Avoids trading in low-volatility, ranging markets.
- **Threshold (e.g., 25):** Only trade when ADX is above this value, indicating a strong trend.
#### **D. ATR (Average True Range) for Risk Management**
- **Stop Loss (SL):** Placed **one ATR below** (for long trades) or **one ATR above** (for short trades).
- **Take Profit (TP):** Set at a **3:1 reward-to-risk ratio**, using ATR to determine realistic price targets.
- Ensures volatility-adjusted risk management.
---
### **3. Entry and Exit Conditions**
#### **📈 Buy (Long) Entry Conditions:**
1. **Price is above the Range Filter** → Indicates an uptrend.
2. **Upward trend strength is positive** (confirmed via trend counter).
3. **RSI is above the buy threshold** (e.g., 50, to confirm momentum).
4. **ADX confirms trend strength** (e.g., above 25).
5. **Volatility is supportive** (using ATR analysis).
#### **📉 Sell (Short) Entry Conditions:**
1. **Price is below the Range Filter** → Indicates a downtrend.
2. **Downward trend strength is positive** (confirmed via trend counter).
3. **RSI is below the sell threshold** (e.g., 50, to confirm momentum).
4. **ADX confirms trend strength** (e.g., above 25).
5. **Volatility is supportive** (using ATR analysis).
#### **🚪 Exit Conditions:**
- **Stop Loss (SL):**
- **Long Trades:** 1 ATR below entry price.
- **Short Trades:** 1 ATR above entry price.
- **Take Profit (TP):**
- Set at **3x the risk distance** to achieve a favorable risk-reward ratio.
- **Ranging Market Exit:**
- If ADX falls below the threshold, indicating a weakening trend.
---
### **4. Visualization & Alerts**
- **Colored range filter line** changes based on trend direction.
- **Buy and Sell signals** appear as labels on the chart.
- **Stop Loss and Take Profit levels** are plotted as dashed lines.
- **Gray background highlights ranging markets** where trading is avoided.
- **Alerts trigger on Buy, Sell, and Ranging Market conditions** for automation.
---
### **5. Advantages of the Enhanced Range Filter Strategy**
✅ **Trend-Following with Noise Reduction** → Helps avoid false signals by filtering out weak trends.
✅ **Momentum Confirmation with RSI & ADX** → Ensures that only strong, valid trades are executed.
✅ **Volatility-Based Risk Management** → ATR ensures adaptive stop loss and take profit placements.
✅ **Works on Multiple Timeframes** → Effective for day trading, swing trading, and scalping.
✅ **Visually Intuitive** → Clearly displays trade signals, SL/TP levels, and trend conditions.
---
### **6. Who Should Use This Strategy?**
✔ **Trend Traders** who want to enter trades with momentum confirmation.
✔ **Swing Traders** looking for medium-term opportunities with a solid risk-reward ratio.
✔ **Scalpers** who need precise entries and exits to minimize false signals.
✔ **Algorithmic Traders** using alerts for automated execution.
---
### **7. Conclusion**
The **Enhanced Range Filter Strategy** is a powerful trading tool that combines **trend-following techniques, momentum indicators, and risk management** into a structured, rule-based system. By leveraging **Range Filters, RSI, ADX, and ATR**, traders can improve trade accuracy, manage risk effectively, and filter out unfavorable market conditions.
This strategy is **ideal for traders looking for a systematic, disciplined approach** to capturing trends while **avoiding market noise and false breakouts**. 🚀

Enhanced Range Filter Strategy with ATR TP/SLBuilt by Omotola
## **Enhanced Range Filter Strategy: A Comprehensive Overview**
### **1. Introduction**
The **Enhanced Range Filter Strategy** is a powerful technical trading system designed to identify high-probability trading opportunities while filtering out market noise. It utilizes **range-based trend filtering**, **momentum confirmation**, and **volatility-based risk management** to generate precise entry and exit signals. This strategy is particularly useful for traders who aim to capitalize on trend-following setups while avoiding choppy, ranging market conditions.
---
### **2. Key Components of the Strategy**
#### **A. Range Filter (Trend Determination)**
- The **Range Filter** smooths price fluctuations and helps identify clear trends.
- It calculates an **adjusted price range** based on a **sampling period** and a **multiplier**, ensuring a dynamic trend-following approach.
- **Uptrends:** When the current price is above the range filter and the trend is strengthening.
- **Downtrends:** When the price falls below the range filter and momentum confirms the move.
#### **B. RSI (Relative Strength Index) as Momentum Confirmation**
- RSI is used to **filter out weak trades** and prevent entries during overbought/oversold conditions.
- **Buy Signals:** RSI is above a certain threshold (e.g., 50) in an uptrend.
- **Sell Signals:** RSI is below a certain threshold (e.g., 50) in a downtrend.
#### **C. ADX (Average Directional Index) for Trend Strength Confirmation**
- ADX ensures that trades are only taken when the trend has **sufficient strength**.
- Avoids trading in low-volatility, ranging markets.
- **Threshold (e.g., 25):** Only trade when ADX is above this value, indicating a strong trend.
#### **D. ATR (Average True Range) for Risk Management**
- **Stop Loss (SL):** Placed **one ATR below** (for long trades) or **one ATR above** (for short trades).
- **Take Profit (TP):** Set at a **3:1 reward-to-risk ratio**, using ATR to determine realistic price targets.
- Ensures volatility-adjusted risk management.
---
### **3. Entry and Exit Conditions**
#### **📈 Buy (Long) Entry Conditions:**
1. **Price is above the Range Filter** → Indicates an uptrend.
2. **Upward trend strength is positive** (confirmed via trend counter).
3. **RSI is above the buy threshold** (e.g., 50, to confirm momentum).
4. **ADX confirms trend strength** (e.g., above 25).
5. **Volatility is supportive** (using ATR analysis).
#### **📉 Sell (Short) Entry Conditions:**
1. **Price is below the Range Filter** → Indicates a downtrend.
2. **Downward trend strength is positive** (confirmed via trend counter).
3. **RSI is below the sell threshold** (e.g., 50, to confirm momentum).
4. **ADX confirms trend strength** (e.g., above 25).
5. **Volatility is supportive** (using ATR analysis).
#### **🚪 Exit Conditions:**
- **Stop Loss (SL):**
- **Long Trades:** 1 ATR below entry price.
- **Short Trades:** 1 ATR above entry price.
- **Take Profit (TP):**
- Set at **3x the risk distance** to achieve a favorable risk-reward ratio.
- **Ranging Market Exit:**
- If ADX falls below the threshold, indicating a weakening trend.
---
### **4. Visualization & Alerts**
- **Colored range filter line** changes based on trend direction.
- **Buy and Sell signals** appear as labels on the chart.
- **Stop Loss and Take Profit levels** are plotted as dashed lines.
- **Gray background highlights ranging markets** where trading is avoided.
- **Alerts trigger on Buy, Sell, and Ranging Market conditions** for automation.
---
### **5. Advantages of the Enhanced Range Filter Strategy**
✅ **Trend-Following with Noise Reduction** → Helps avoid false signals by filtering out weak trends.
✅ **Momentum Confirmation with RSI & ADX** → Ensures that only strong, valid trades are executed.
✅ **Volatility-Based Risk Management** → ATR ensures adaptive stop loss and take profit placements.
✅ **Works on Multiple Timeframes** → Effective for day trading, swing trading, and scalping.
✅ **Visually Intuitive** → Clearly displays trade signals, SL/TP levels, and trend conditions.
---
### **6. Who Should Use This Strategy?**
✔ **Trend Traders** who want to enter trades with momentum confirmation.
✔ **Swing Traders** looking for medium-term opportunities with a solid risk-reward ratio.
✔ **Scalpers** who need precise entries and exits to minimize false signals.
✔ **Algorithmic Traders** using alerts for automated execution.
---
### **7. Conclusion**
The **Enhanced Range Filter Strategy** is a powerful trading tool that combines **trend-following techniques, momentum indicators, and risk management** into a structured, rule-based system. By leveraging **Range Filters, RSI, ADX, and ATR**, traders can improve trade accuracy, manage risk effectively, and filter out unfavorable market conditions.
This strategy is **ideal for traders looking for a systematic, disciplined approach** to capturing trends while **avoiding market noise and false breakouts**. 🚀

Multi-Timeframe EMAsMulti Timeframe EMA's
The 'Multi-Timeframe EMA Band Comparison' indicator is a tool designed to analyze trend direction across multiple timeframes using Exponential Moving Averages. it calculates the 50, 100, and 200 period EMAs for fiver user defined timeframes and compares their relationships to provide a visual snapshot of bullish or bearish momentum.
How it Works:
EMA Calculations: For each selected timeframe, the indicator computes the 50, 100, and 200 period EMAs based on the closing price.
Band Comparisons: Three key relationships are evaluated:
50 EMA vs 100 EMA
100 EMA vs 200 EMA
50 EMA vs 200 EMA
Scoring System: Each comparison is assigned a score:
🟢 (Green Circle): The shorter EMA is above the longer EMA, signaling bullish momentum.
🔴 (Red Circle): The shorter EMA is below the longer EMA, signaling bearish momentum.
⚪️ (White Circle): The EMAs are equal or data is unavailable (rare).
Average Score:
An overall average score is calculated across all 15 comparisons ranging from 1 to -1, displayed with two decimal places and color coded.
Customization:
This indicator is fully customizable from the timeframe setting to the color of the table. The only specific part that is not changeable is the EMA bands.