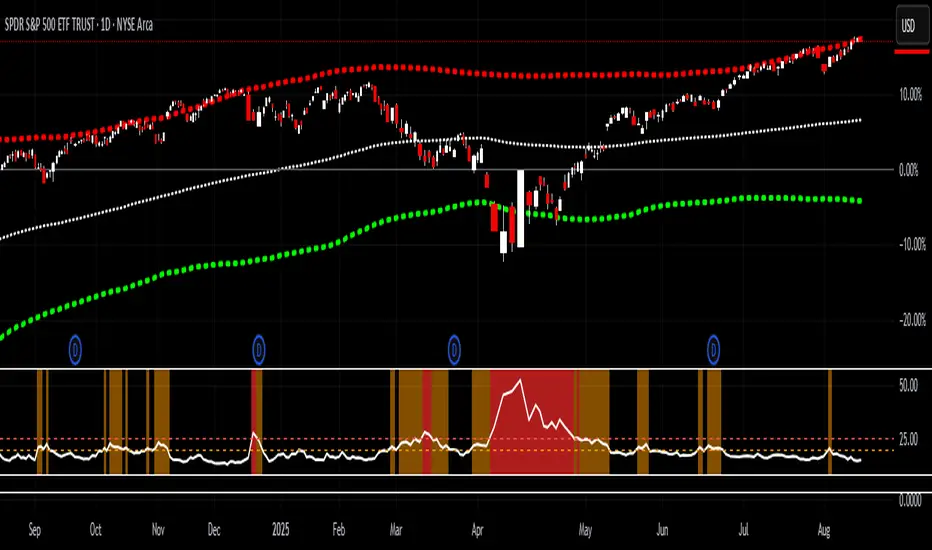
VIX daily chang95%
This is a VIX indicator It goes with VIX MA 95%
When VIX daily change 10MA > past 200Days VIX daily change 10MA 95 Percentile than color turn to orange
Both VIX MA&95% and VIX daily change 95% turn to orange means Risk off. get out of market!
Recherche dans les scripts pour "同花顺软件+美国+VIX+恐慌指数+行情代码"

VIX MA&95%
This is a VIX indicator It goes with VIX daily change 95%
When 10 VIX MA > past 200Days 10 VIX MA 95 Percentile than color turn to orange
Both VIX MA&95% and VIX daily change 95% turn to orange means Risk off. get out of market!

VIX > 20/25 HighlightThis indicator tracks the CBOE Volatility Index (VIX) and highlights when volatility exceeds critical thresholds.
Plots the VIX with dashed reference lines at 20 and 25.
Background turns orange when the VIX is above 20.
Background turns bright red when the VIX is above 25.
Includes alert conditions to notify you when the VIX crosses above 20 or 25.
Use this tool to quickly visualize periods of elevated market stress and manage risk accordingly.
VIX - SKEW DivergenceThe CBOE VIX is a well-known index representing market expectations for volatility over the next 30 days.
The CBOE SKEW is an index reflecting the perceived tail risk over the next 30 days.
When the SKEW rises over a certain level (~140/150), that means investors are hedging their exposure with options, because they are worried about an incoming market crash or a "black swan". If that happens when the VIX is very low and apparently there is no uncertainty, this can warn of a sudden change in direction of the market. You will see for yourself that an increasing divergence often anticipates a sharp fall of leading stock indexes, usually within two to four months.
This is probably not very relevant for the short-term trader but mid/long-term traders and market analysts may find it useful to clearly visualize the extent of the distance between the VIX and the SKEW. For that reason, I wrote this highly customizable script with which you can plot the two indexes and fill the space within them with a color gradient to highlight the maximum and minimum divergence. Additionally, you can fill the beneath VIX area with four different colors. It is also possible to plot the divergence value itself, so if you want you can draw trendlines and support/resistance levels on it.
Please note that the divergence per se doesn't predict anything and it's meant to be used synergistically with other technical analysis tools.
More informations here:
www.cboe.com
www.cboe.com

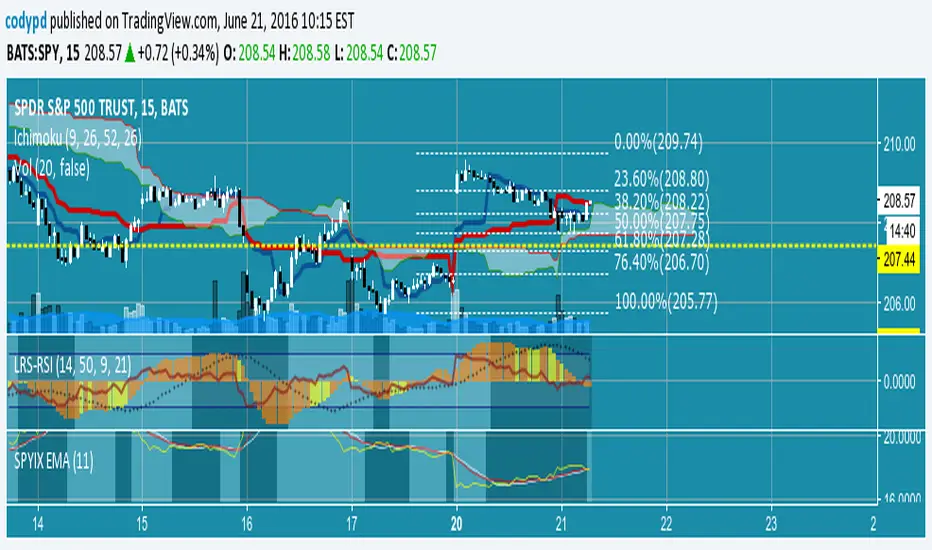
SPYIX EMAVariation on idea at url below using SPYIX from BATS instead of VIX
from marketsci.wordpress.com
Aids in identifying changes in volatility direction.
EDIT: just noticed that URL is now password protected. The concept from the author is simple: use EMA and SMA smoothing of the VIX as two signal lines. When they cross you have a change in VIX direction. I simply coded that for SPYIX which is a slightly different (but theoretically similar) index vs VIX. SPYIX provides intraday updates without a subscription so this indicator can be used for intraday tracking.
VIX Overnight Unch or Up AlertThis indicator alerts when VIX opens the day unchanged or higher on the day. If in fact VIX opens up unchanged or higher, it will display near the first bar of the day, previous day's close time and level and the opening time and level. The close time is typically 16:15 New York Time and the opening time is 09:30 or the first print a few minutes later. I use TVC:VIX instead of CBOT because TVC for me is real time. I also use the 1 minute chart and the script is coded as 1 minute.

VIX BanditThis is a momentum indicator that identifies potential VIX bottoms by using seven configurable Williams %R oscillators simultaneously.
Green dots🟢appear below the bar when all %R series agree the VIX is extremely oversold.
Fuchsia dots🟣appear above the bar when VIX reverts to its long-term average (an EMA).
I hope this helps you spot moments of maximum optimism and trade the subsequent panic, somehow.

VIX Contango Sentiment IndicatorRegime dependent ONLY USE 2018 ONWARD
Plots VIX3m/VIX measuring the complacency of the VIX term structure
<.8 = COMPLACENCY VIX spike likely
Buy risk on the 2nd downtick from capitulation zone

VIX Fix Indicator (Hestla 2015)This script provides a streamlined version of the VIX Fix, referencing the foundational work of Larry Williams and the strategies of Amber Hestla. It serves as a synthetic volatility gauge for assets that lack a dedicated VIX index. The math works by measuring the percentage drop from the highest recent close to the current low, essentially quantifying fear in the market without needing options data.
This specific script is designed to be purely visual. I have removed all the buy and sell labels found in other versions to leave a clean pane that plots only the oscillator and its moving average. You can use this to identify potential market bottoms when the black line spikes significantly, signaling that selling pressure is reaching a mathematical extreme relative to the recent trend.

VIX/VIX3M Ratio計算並顯示 CBOE:VIX 和 CBOE:VIX3M 的比率,幫助交易者評估市場的波動性。
當比率超過設定的高水平或低於低水平時,指標將顯示為紅色,提示潛在的市場異常情況。
Calculates and displays the ratio of CBOE:VIX to CBOE:VIX3M, helping traders assess market volatility.
When the ratio exceeds the set high level or falls below the low level, the indicator will be displayed in red, signaling potential market anomalies.

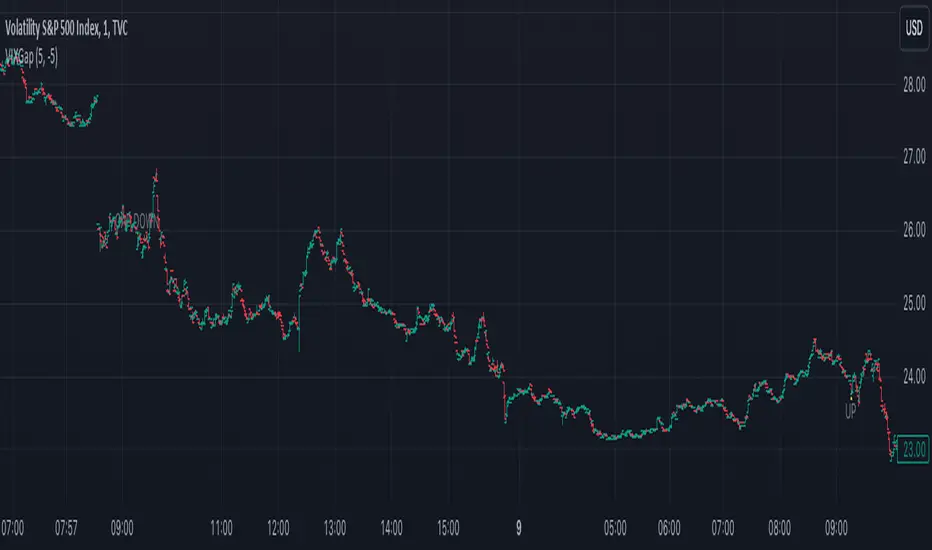
VIX Opening GapOverview
This simple script generates alerts based on the difference between the previous trading day's VIX close and the current trading day's opening bar. It is designed for use on the TVC version of the VIX chart, with 1-minute bars.
Features
The script flags one of four conditions based on the difference between the previous day's close and the current day's open: (1) open up; (2) open down; (3) gap up; and (4) gap down. The thresholds for gaps up and down are expressed as percentages and can be changed in the input settings.
The script can assess the gap at the first bar of the premarket session or at the first bar printed after market open. Change this by toggling the "Use Premarket Hours" feature in the input settings.
Vix FIX / StochRSI Strategy
Updated to Pine V5
Enter upon a filtered or aggressive entry
If there are multiple entry signals, allow pyramiding
Exit when there is Stochastic RSI crossover above 80
Work with some futures and futures timeframes
Based on Chris Moody's Vix Fix
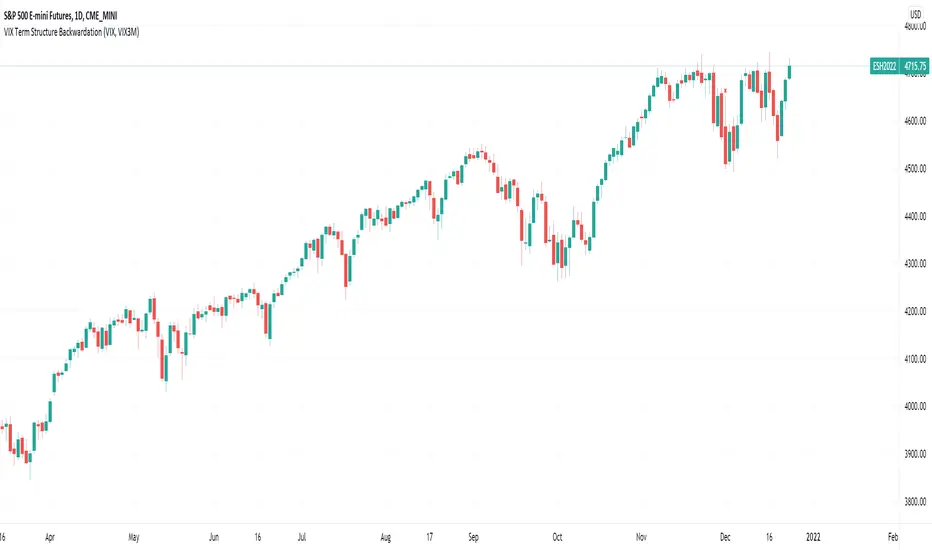
VIX Term Structure BackwardationTracks backwardation of the VIX Term Structure using the difference between 2 custom durations VIX / VIX3M /VIX6M/VIX1Y

VIX/VXV Ratio (TitsNany)This script plots the VXV/VIX ratio, which compares medium-term volatility (90-day fear) to short-term volatility (30-day fear). When the ratio rises above key levels like 1.16 or 1.24, it signals that traders expect future stress, often preceding market pullbacks. When the ratio falls toward or below 1.0, short-term fear is spiking, which typically occurs during active selloffs or volatility events. In short, elevated readings warn of potential market drops ahead, while sharp declines in the ratio reflect panic already hitting the market.

VIX Futures Spread (VX1 - VX2)Calculate the currente VIX front vs next contract spread.
Allow to identify if the market is in Contango or Backwardation
Display the result as a color coded histogram

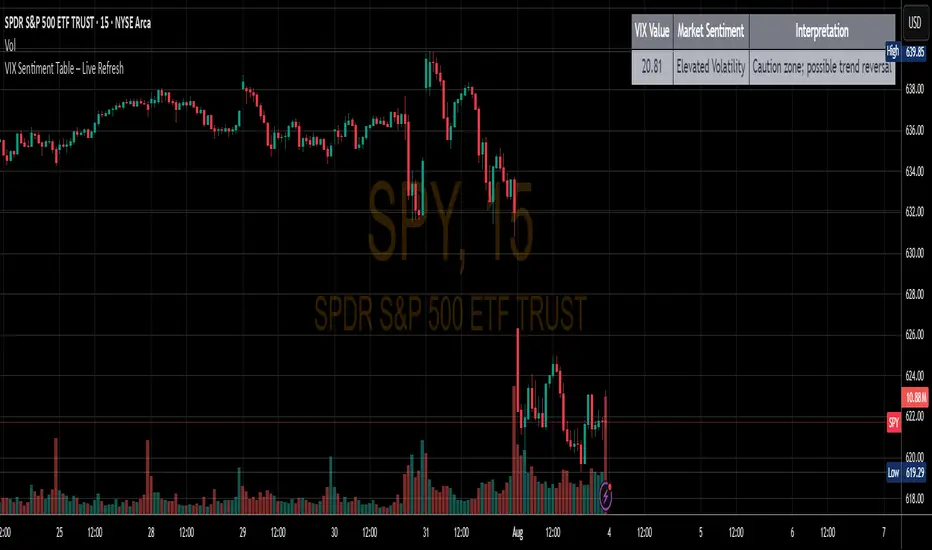
VIX Sentiment Table – ResolutionThis indicator provides verbal representation of the current VIX value and likely market trend for easy to view and interpret
VIX Differential(Melon)Simple indy that measures the difference between VIX9D and VIX to try assessing short-term market sentiment. I've liked this recently as a big clue for market bottom reversals.

VIX CorrelationIndicator tracks the 10 day correlation with VIX. I prefer to use this with SPY. Can be a great way to flag tops/melt-ups.
Default settings are set to when the correlation is above 0.2, bars turn red, but you can change this.


Connors VIX Reversal III invented by Dave LandryThis strategy is based on trading signals derived from the behavior of the Volatility Index (VIX) relative to its 10-day moving average. The rules are split into buying and selling conditions:
Buy Conditions:
The VIX low must be above its 10-day moving average.
The VIX must close at least 10% above its 10-day moving average.
If both conditions are met, a buy signal is generated at the market's close.
Sell Conditions:
The VIX high must be below its 10-day moving average.
The VIX must close at least 10% below its 10-day moving average.
If both conditions are met, a sell signal is generated at the market's close.
Exit Conditions:
For long positions, the strategy exits when the VIX trades intraday below its previous day’s 10-day moving average.
For short positions, the strategy exits when the VIX trades intraday above its previous day’s 10-day moving average.
This strategy is primarily a mean-reversion strategy, where the market is expected to revert to a more normal state after the VIX exhibits extreme behavior (i.e., large deviations from its moving average).
About Dave Landry
Dave Landry is a well-known figure in the world of trading, particularly in technical analysis. He is an author, trader, and educator, best known for his work on swing trading strategies. Landry focuses on trend-following and momentum-based techniques, teaching traders how to capitalize on shorter-term price swings in the market. He has written books like "Dave Landry on Swing Trading" and "The Layman's Guide to Trading Stocks," which emphasize practical, actionable trading strategies.
About Connors Research
Connors Research is a financial research firm known for its quantitative research in financial markets. Founded by Larry Connors, the firm specializes in developing high-probability trading systems based on historical market behavior. Connors’ work is widely respected for its data-driven approach, including systems like the RSI(2) strategy, which focuses on short-term mean reversion. The firm also provides trading education and tools for institutional and retail traders alike, emphasizing strategies that can be backtested and quantified.
Risks of the Strategy
While this strategy may appear to offer promising opportunities to exploit extreme VIX movements, it carries several risks:
Market Volatility: The VIX itself is a measure of market volatility, meaning the strategy can be exposed to sudden and unpredictable market swings. This can result in whipsaws, where positions are opened and closed in rapid succession due to sharp reversals in the VIX.
Overfitting: Strategies based on specific conditions like the VIX closing 10% above or below its moving average can be subject to overfitting, meaning they work well in historical tests but may underperform in live markets. This is a common issue in quantitative trading systems that are not adaptable to changing market conditions .
Mean-Reversion Assumption: The core assumption behind this strategy is that markets will revert to their mean after extreme movements. However, during periods of sustained trends (e.g., market crashes or rallies), this assumption may break down, leading to prolonged drawdowns.
Liquidity and Slippage: Depending on the asset being traded (e.g., S&P 500 futures, ETFs), liquidity issues or slippage could occur when executing trades at market close, particularly in volatile conditions. This could increase costs or worsen trade execution.
Scientific Explanation of the Strategy
The VIX is often referred to as the "fear gauge" because it measures the market's expectations of volatility based on options prices. Research has shown that the VIX tends to spike during periods of market stress and revert to lower levels when conditions stabilize . Mean reversion strategies like this one assume that extreme VIX levels are unsustainable in the long run, which aligns with findings from academic literature on volatility and market behavior.
Studies have found that the VIX is inversely correlated with stock market returns, meaning that higher VIX levels often correspond to lower stock prices and vice versa . By using the VIX’s relationship with its 10-day moving average, this strategy aims to capture reversals in market sentiment. The 10% threshold is designed to identify moments when the VIX is significantly deviating from its norm, signaling a potential reversal.
However, academic research also highlights the limitations of relying on the VIX alone for trading signals. The VIX does not predict market direction, only volatility, meaning that it cannot indicate the magnitude of price movements . Furthermore, extreme VIX levels can persist longer than expected, particularly during financial crises.
In conclusion, while the strategy is grounded in well-established financial principles (e.g., mean reversion and the relationship between volatility and market performance), it carries inherent risks and should be used with caution. Backtesting and careful risk management are essential before applying this strategy in live markets.
