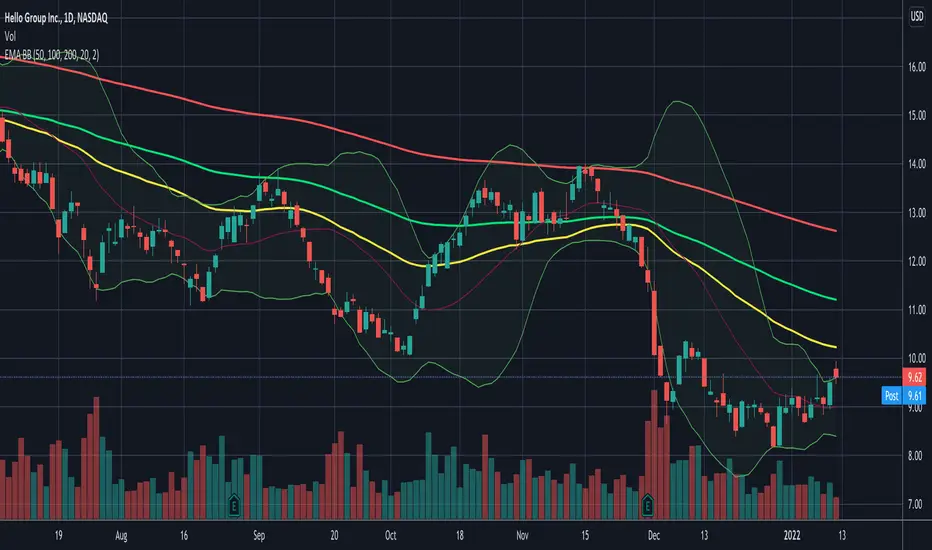
Median Absolute Deviation Filtered SMA & BBMedian Absolute Deviation (MAD) is a robust measurement of variability and more resilient against outliers and small samples.
This experiment uses MAD as a means of filtering outliers from an SMA calculation. First we construct the equivalent of a Bollinger Band, but based on the median as the basis and a multiple( k ) of MAD as the outlier cutoff.
k can be set a number of ways. As a simple multiple (3 - very conservative / 2.5 - moderately conservative / 2 - poorly conservative). Alternatively MAD can be used as an estimator of standard deviation by using a multiple of 1.4826 (SD1 - 1.4826 / SD2 - 2.9652 / SD3 - 4.4478).
Once we have a cutoff range an SMA is calculated with the outliers filtered out. Additionally a Bollinger band can be output using the filtered SMA as the basis and a multiple of the MAD instead of SD for the bands.
Recherche dans les scripts pour "弘历投教boll指标代码分析"

CBG Swing HighLow MAThis indicator will show the swing high and lows for the number of bars back. It's very easy to use and shows good support and resistance levels.
I then took it a step further and added a moving average with all the standard types in my indicators:
SMA
EMA
Weighted
Hull
Symmetrical
Volume Weighted
Wilder
Linear Regression
I then added Bollinger Bands to show the standard deviation from the midline.
Finally, I added a simple bar coloring scheme: green if above the upper BB, Red if below and orange if in the middle.
I am just testing this out so please use with caution. If anyone in the community wants to run some backtests, that would be great and we would all appreciate it.
Of course you can keep it all simple and turn off all the moving averages and bollinger bands.
Enjoy! :-)

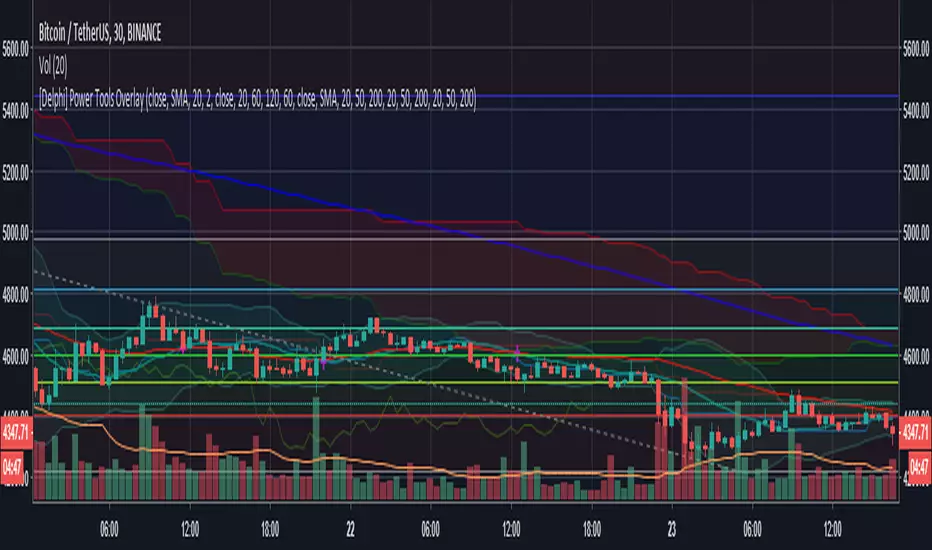
[Delphi] Power Tools OverlayFEATURE
3EMA 3MA 3WMA 3MA-3EMA 3EMA-3WMA 3WMA-3MA
Bollinger Bands
Ichimoku Cloud
//******************************************************************************
// Power Tools Overlay
// Inner Version 1.0 21/11/2018
// Developer: iDelphi
// Developer: astropark (Ichimoku Cloud)
//------------------------------------------------------------------------------
// 21/11/2018 Added EMA MA WMA
// 21/11/2018 Added MA-EMA EMA-WMA WMA-MA (Thanks to mariobros1 for the idea of the Simultaneous MA)
// 21/11/2018 Added Bollinger Bands
// 21/11/2018 Added Ichimoku Cloud (Thanks to astropark for all the code of the Ichimoku Cloud)
//******************************************************************************
3 in one (BB, 3 MA +) // 3 en 1 (BB, 3 medias moviles, y mas)Version 2 of my previous published script. It allows bollinger bands, 3 moving averages and also it allows to draw entry point, sl and take profit of a single trade in order to track it.
***********************************
Evolución del script anteriormente publicado. Se añaden Bollinger bands y la posibilidad de dibujar los niveles de stop loss, take profit y entrada para una operación en curso. Todas las funciones pueden ser desactivadas. Leer el script para mas información.
BAHbO - multi indicators and signals SMA,BB,RSI,Engulfing,Signal4 SMAs - 9,21,55,200
Bollinger Bands - 21
Engulfing patterns
Fractal Support Resistance
Bullish and Bearish Engulfing signals
Engulfing Candles
Bollinger Bands + RSI combined indicator with signals

Projecting From StabilityStable periods that are projected can be found using Bollinger Band Percent Width Crossing RSI
The projected periods are paying most attention to the drop in % BBand width.


Bollinger Fanboy v2.0By using this script you agree that the author will not be liable for any losses financial or otherwise from the use of this script.
Copyright Michael Edwards 2014 (bollingerfanboy.com)
Professional 3SD Institutional Rejection
This indicator identifies institutional "liquidity grab" and "momentum exhaustion" zones using the statistical extremes of 3 Standard Deviations (3SD) on Bollinger Bands. Unlike standard strategies, it doesn't just look for band touches; it confirms price "wicking" outside the 3SD and closing back inside the 2SD band (rejection), while ensuring the Money Flow Index (MFI) shows signs of exhaustion. It is highly effective on 1H, 4H, and Daily timeframes for mean-reversion setups targeting the median line.

Advanced Trend & Volatility Indicator (VWAP & EMA360)Bollinger band with adjustable NO TRADE tool. green buy and red sell signals for 20 moving average added 360 moving average for micro trading. Has VWAP and additional EMA defaulted to 9 (adjust to your style). For confluence use this along with an RSI over bought and over sold WMA with similar green buy and red sell signals.
Bollinger BandsThis is the combination of three indicators (BOLLINGE BAND+VWAP+EMA200)
CREATED BY ANKR SINGH

Crypto Breakout IndicatorHey Guys,
The idea of the script is that accumalation and small pumps do happen before the big ones, therefore, i tried to create a breakout indicator that can tell that:
the script components are:
1- Price to consolidate within 15% range between the highest of 6 candles and lowest of 6 candles
2- Price needs to breakout with minimum of 1% and maximum of 20%
3- Price needs to have sufficient volume, hence volume of current bar needs to be higher than previous one with 10% at least
4- RSI needs to be between 50 and 75
5- Bollinger Bands Percentage needs to be equal or lower than 1
6- Price is closing above EMA200
I tried to make all these numbers to be available for you guys through settings so you can tell me about any better settings!

Double Basics - Identify Overbought & Oversold - MultitimeframeI believe that everyone should monitor the basic indicators; EMA/SMA cross, BB and RSI on at least TWO timeframes before making any trading decisions. And because that is only possible on paid subscriptions, I created this indicator for people just getting started.
It allows you to plot all of the mentioned AND 2 weeklies of your choice on 1 chart INCLUDING a higher timeframe, using only 1 indicator.
The EMA's are plotted as ORANGE and the SMA's as BLACK, you can distinguish them by the line size, thin is current chart, thick is higher timeframe.
Same for the Bollinger Bands, Upper lines are red (overbought = sell signal) and bottom lines are green (oversold = buy signal)
The RSI, normally plotted in its own window, are plotted on the scale of the BB of the 2nd timeframe, where the bottom line = 0, upper line = 100 and middle (think black) line = 50. The thin purple line is the RSI of the chart resolution, the thicker purple line is the RSI of the 2nd timeframe.
Finally, the two weeklies are plotted as thick black lines.
Enjoy, and let me know your feedback!

[kai]Keltner&BolingerIt is an indicator that simultaneously displays the Bollinger Bands (BB) and Keltner Channel (KC) calculated for the log scale.
* If you need the normal scale version, please turn off the log mode in the settings.
I think the usage is the same as normal BB and KC.
From here, it ’s an original way of thinking.
I thought about countermeasures for the phenomenon that the BB contracts (squeezes) and breaks, but for some reason it suddenly reverses and breaks greatly in the opposite direction or ends in misfire.
The main part of this Inge is KC, and I think that the range within KC is the range.
Considering that the bar broke above and below the range of KC and broke, the trend market started.
BB fits in KC and judges that the trend is game over
If it is within KC, it is contrarian at the upper and lower limits of KC.
If it breaks, Trend following
Profit if BB fits in KC
I'm thinking about how to use it
ログスケール用にログ計算したボリンジャーバンド(BB)とケルトナーチャンネル(KC)を同時に表示するインジケーターです
※通常スケール版が必要な時は設定のlog modeをOFFにしてください
使い方は普通のBBとKCとおなじで使用方法で良いと思います
ここからはオリジナルな使い方の考え方です
BBが収縮(スクイーズ)してブレイクしたのに何故か突然反転して反対の方に大きくブレイクしたり、不発に終わったりする現象の対策を考えました
このインジのメインはKCでKCの範囲内はレンジと考えます
KCの範囲外にバーが上抜け、下抜けして、ブレイクしたと考え、トレンド相場スタートとします
BBがKCの中に納まってトレンド終了と判定します
KC内の場合はKCの上限、下限で逆張り
ブレイクした場合は順張り
BBがKCの中に納まったら利確
という感じの使い方を考えています

Daily EMA50 100 200 + BBStandard Bollinger Bands (timeframe dependent), period and standard deviation are configurable.
And standard daily triple EMA (timeframe independent). Short, Medium and Long periods are configurable (50/100/200 by default)
Volatility Funnel v2Using the contracting phase of what are basically bollinger bands and some fancy coloring, this indicator draws funnels to which show tightening ranges and doesn't take up too much screen space unless you want it to.
There is a smoothing option if you're into that.
Enjoy!!!

IDEAL BB with MA (With Alerts)It gives well combination of Moving average and Bollinger bands with signals

Multiband Oscillator - Zigzag versionJust variation of Multi Band oscillator present here: Multi-Band-Channel-Oversold-Overbought-Oscillator
Changes are:
Instead of regular moving average, here I am using Zigzag Moving average. This is calculated in similar to as explained in: Zigzag-Cloud
Instead of ATR, using AZR (Average Zigzag Range) - Average-Zigzag-Range-AZR
Rest of the logic remains same.
Number of bands used 100 - which means, calculate 100 Bollinger bands with Std Dev Multiplier starting from 0.1 and with step 0.1 for the next one.
Which divides price ranges into 200 equal parts. Calculate what is the current range and plot them.
Overbought - Oversold levels are dynamics. They are dependent on the max and min state price has reached in last 80 days. Offset and factor can be used to adjust overbought oversold levels.

Value RangeHere is another attempt to chase value based on technical analysis.
This is extended version of PE range script published earlier.
Instead of just PE, this script contains several other factors which defines value. You can chose which factor to look at from input dialog:
Possible value factors included in this script are:
Price to Earnings
Price to Sales
Price to Book
PE - Forwarding
PS - Forwarding
Price to Cashflow
Enterprise Value to EBITDA
Enterprise Value to Cashflow
Some of these can be added to chart directly from financials. But, the script also calculate range based on donchian channel or bollinger bands. Instead of short periods, we are looking for periods in terms of years. Rest of things remain same.

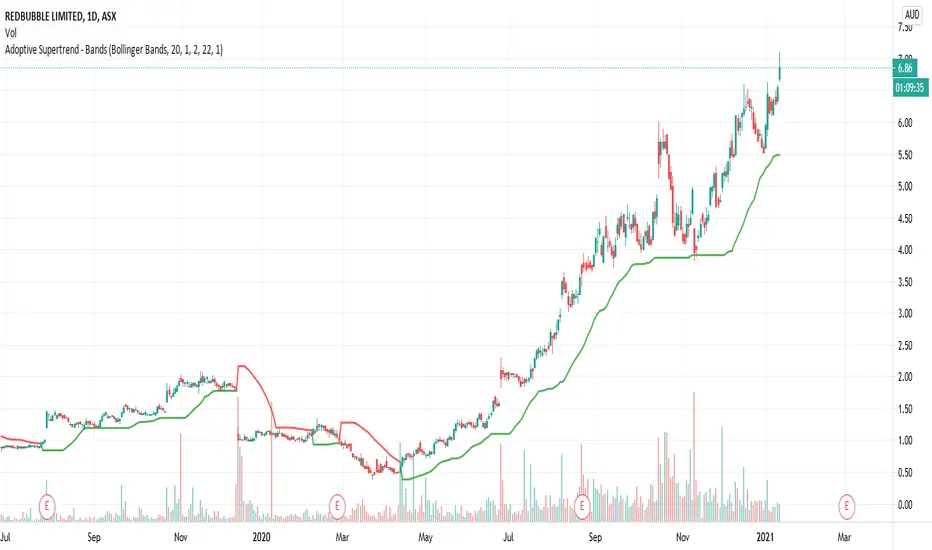
Adoptive Supertrend - BandsAnother adoption of supertrend. This time based on different channels - Bollinger Band, Keltner Channel, Donchian Channel and Pivot point based Donchian channel.
When price hits top of bands, it is considered as start or continuation of uptrend. When price hits bottom of the band it is considered as start or continuation of downtrend. Hence, supertrend is drawn based on these calculations. Use ATR Periods and ATR Multiplier to create stops certain ATR away from band's top and bottom.
Other supertrend adoptions published are here:
Pivot point based donchian channel is published here:
BB+K strategyApplying Bollinger Bands and K-bar strategies
Suitable for long time periods
Suitable for forex trading, when the forex deviation is too large, the Fed will intervene and thus correct
Strategy: Enter when the price hits the upper or lower BB track and there is a reversal of the strong signal, and exit when it hits the other track and there is a reversal signal.

Double BB & Double EMA by IKINThis is the combination of code to detect the cross over between EMA 7 & EMA 21.
By using the double Bollinger Bands will help traders to make the decision by exit the counter just incase buy at the highest price.
Create for FREE TRADING VIEW USER

[M2J] Indicator | Turtle Atom Duck Signal Turtle Atom Duck shows potential buy and sell
It consist of 3 indicators
Turtle - Donchian Channel
- bullish when price close above previous 1 bar high
- bearish when price close below previous 1 bar low
Atom - Bollinger Band
- bullish when price close above upper band
- bearish when price close below lower band
Duck - Moving Average (Default 50-period EMA)
- bullish when price close above moving average
- bearish when price close below moving average
When all 3 are bullish, buy signal appears
When all 3 are bearish, sell signal appears
Screener Turtle Atom Duck
Example:
FBMKLCI
Technology Sector
Health Sector
TOPGLOV
BINTAI
XOX
PRLEXUS
JCY
EURUSD
XAUUSD
