Multiple Smoothed Moving AveragesMultiple Smoothed Moving Averages (SMMAs)
This indicator displays up to 5 Smoothed Moving Averages (SMMAs) on your chart, providing a comprehensive view of multiple trend timeframes simultaneously.
═══════════════════════════════════════
WHAT IS A SMOOTHED MOVING AVERAGE?
═══════════════════════════════════════
The Smoothed Moving Average (SMMA), also known as the Running Moving Average (RMA), is a type of moving average that provides more smoothing than a Simple Moving Average (SMA).
Unlike SMA which gives equal weight to all values in the period, SMMA uses a recursive formula that gives more weight to previous SMMA values, resulting in:
- Smoother price action with less noise
- Slower response to recent price changes
- Better identification of longer-term trends
- Reduced false signals in choppy markets
CALCULATION METHOD:
- First value: Simple Moving Average of the initial period
- Subsequent values: (Previous SMMA × (Length - 1) + Current Price) / Length
This recursive nature makes SMMA particularly effective for identifying sustained trends while filtering out short-term volatility.
═══════════════════════════════════════
FEATURES
═══════════════════════════════════════
✓ 5 Independent SMMAs: Each with its own configurable period length
✓ Individual Toggles: Show/hide each SMMA independently
✓ Distinct Colors: Easy visual identification of each moving average
✓ Customizable Lengths: Adjust each period to match your trading strategy
✓ Shared Source: All SMMAs calculate from the same price source (default: close)
✓ Overlay Display: Plots directly on the price chart
═══════════════════════════════════════
DEFAULT SETTINGS
═══════════════════════════════════════
- SMMA 1: 30 periods (Blue)
- SMMA 2: 50 periods (Orange)
- SMMA 3: 100 periods (Green)
- SMMA 4: 200 periods (Purple)
- SMMA 5: 300 periods (Red)
All SMMAs are enabled by default.
═══════════════════════════════════════
HOW TO USE
═══════════════════════════════════════
TREND IDENTIFICATION:
- Price above all SMMAs = Strong uptrend
- Price below all SMMAs = Strong downtrend
- Price between SMMAs = Transitional phase or consolidation
SUPPORT & RESISTANCE:
- SMMAs often act as dynamic support in uptrends
- SMMAs often act as dynamic resistance in downtrends
- Longer-period SMMAs (200, 300) provide stronger S/R levels
CROSSOVER SIGNALS:
- Faster SMMA crossing above slower SMMA = Bullish signal
- Faster SMMA crossing below slower SMMA = Bearish signal
MULTIPLE TIMEFRAME ANALYSIS:
- Short-term trends: 30, 50 periods
- Medium-term trends: 100 periods
- Long-term trends: 200, 300 periods
═══════════════════════════════════════
CUSTOMIZATION
═══════════════════════════════════════
INPUTS TAB:
- Adjust each SMMA length to suit your trading timeframe
- Toggle individual SMMAs on/off using checkboxes
- Change the source (close, open, high, low, hl2, hlc3, ohlc4)
STYLE TAB:
- Modify line colors for each SMMA
- Adjust line thickness and style
- Change transparency levels
═══════════════════════════════════════
NOTES
═══════════════════════════════════════
- This indicator uses the mathematically correct SMMA calculation with the recursive formula
- All calculations are performed on every bar to ensure data consistency
- SMMAs respond more slowly than EMAs but faster than WMAs to price changes
- Best used in combination with other technical analysis tools
- Use on any timeframe
═══════════════════════════════════════
Perfect for traders who want a clear, multi-timeframe view of market trends using the smooth, reliable SMMA calculation method.
Recherche dans les scripts pour "收集一只股票30个交易日的成交量、开盘价、最高价和最低价和收盘价"

MNQ Morning Indicator | Clean SignalsMNQ Morning Trading Indicator Summary
What It Does
This is a TradingView indicator designed for day trading MNQ (Micro Nasdaq-100 futures) during morning sessions. It generates BUY and SELL signals only when multiple technical conditions align, helping traders identify high-probability trade setups.
Core Strategy
BUY Signal Requirements (All must be true):
✅ Price above VWAP (volume-weighted average price)
✅ Fast EMA (9) above Slow EMA (21) - uptrend confirmation
✅ Price above 15-minute 50 EMA - higher timeframe confirmation
✅ MACD histogram positive - momentum confirmation
✅ RSI above 55 - strength confirmation
✅ ADX above 25 - trending market (not choppy)
✅ Volume 1.5x above average - strong participation
SELL Signal (opposite conditions)
Key Features
🎯 Risk Management
Stop Loss: 2× ATR (Average True Range)
Take Profit 1: 2× ATR (1:2 risk-reward)
Take Profit 2: 3× ATR (1:3 risk-reward)
Dollar values: Calculates P&L based on MNQ's $2/point value
⏰ Session Filter
Default: 9:30 AM - 11:30 AM ET (customizable)
Safety feature: Avoids first 15 minutes (high volatility period)
Won't generate signals outside trading hours
🛡️ Signal Quality
Rates each signal: 🔥 STRONG, ⚡ MEDIUM, or ⚠️ WEAK
Requires minimum 15 bars between signals (prevents overtrading)
📊 Visual Dashboard
Shows real-time metrics:
ATR values
ADX (trend strength)
RSI (momentum)
Market condition (TREND/CHOP)
Session status
Volume status
Signal cooldown timer
Visual Elements
📈 VWAP with standard deviation bands (1σ, 2σ, 3σ)
📉 Multiple EMAs with trend-based coloring
🟢/🔴 Buy/Sell arrows on chart
📋 Detailed trade labels showing entry, SL, TPs, and risk-reward ratios
🎨 Background highlighting for market conditions
Safety Features
Cooldown period between signals
Session restrictions (no trading outside set hours)
First 15-minute avoidance (post-open volatility)
Multi-confirmation requirement (all 7 conditions must align)
Trend filter (ADX minimum to avoid choppy markets)
Best For
Day traders focused on morning sessions
MNQ futures traders
Traders who prefer systematic, rule-based entries
Those wanting pre-calculated risk management levels
Customization
All parameters are adjustable:
EMA periods
MACD settings
RSI thresholds
ADX minimum
ATR multipliers
Session times
Visual preferences
This indicator is designed to be conservative — it waits for strong confirmation before signaling, which means fewer but potentially higher-quality trades.

1m Scalping ATR (with SL & Zones)A universal ATR indicator that anchors volatility to your stop-loss.
Read any market (FX, JPY pairs, Gold/Silver, indices, crypto) consistently—regardless of pip/point conventions and timeframe.
Why this indicator?
Classic ATR is absolute (pips/points) and feels different across markets/TFs. ATR Takeoff normalizes ATR to your stop-loss in pips and highlights clear zones for “quiet / ideal / too volatile,” so you instantly know if a 10-pip SL fits current conditions.
Key features
Auto pip detection (FX, JPY, XAU/XAG, indices, BTC/ETH).
Selectable ATR source: chart timeframe or fixed ATR TF (e.g., “15”, “30”, “60”).
Display modes:
Percent of SL – ATR relative to SL in %, great for M1 (typical 10–30%).
Multiple of SL – ATR as a multiple of SL (e.g., 0.6× / 1.0× / 1.2×).
Panel zones:
Green = “Ready for takeoff” (≤ Low), Yellow = reference (Mid), Red = too volatile (≥ High).
Status badge (top-right): Quiet / ATR ok / Wild, current ATR/SL value, ATR TF used.
Direction-agnostic: Works the same for longs and shorts.
Inputs (at a glance)
Length / Smoothing (RMA/SMA/EMA/WMA): ATR base settings.
Your Stop-Loss (Pips): Reference SL (e.g., 10).
ATR Timeframe (empty = chart): Use chart TF or a fixed TF.
Display Mode: “Percent of SL” or “Multiple of SL.”
Low/Mid/High (Percent Mode): Zone thresholds in % of SL.
Low/Mid/High (Multiple Mode): Zone thresholds in ×SL.
Recommended defaults
Length 14, Smoothing RMA, SL 10 pips
Display Mode: Percent of SL
Low/Mid/High (%): 15 / 20 / 25
ATR Timeframe: empty (= chart) for reactive, or “30” for smoother M30 context with M1 entries.
How to use
Set SL (pips). 2) Choose display mode. 3) Optionally pick ATR TF.
Interpretation:
≤ Low (green): setups allowed.
≈ Mid (yellow): neutral reference.
≥ High (red): too volatile → adjust SL/size or wait.
Note: Auto-pip relies on common ticker naming; verify on exotic symbols.
Disclaimer: For research/education. Not financial advice.

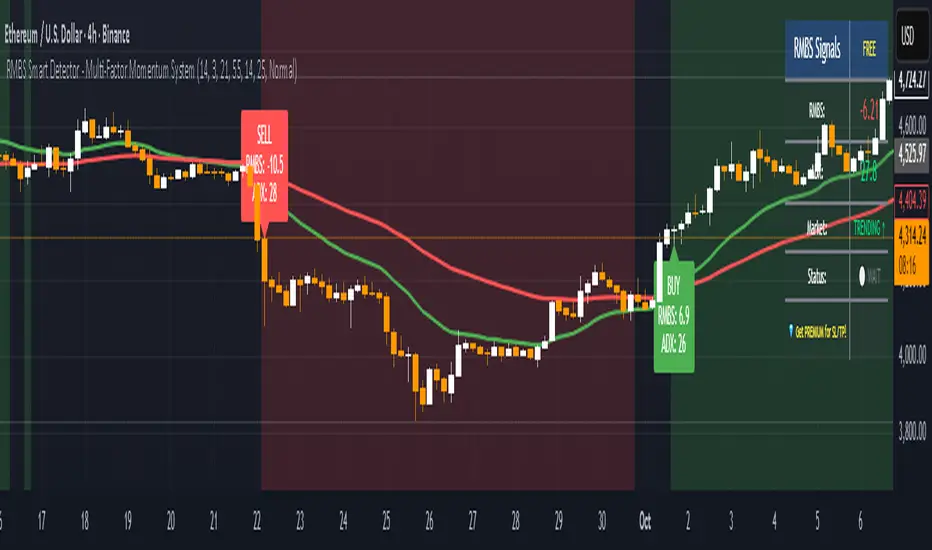
RMBS Smart Detector - Multi-Factor Momentum System
# RMBS Smart Detector - Multi-Factor Momentum System
## Overview
RMBS (Smart Detector - Multi-Factor Momentum System) is a proprietary scoring method developed by Ario, combining normalized RSI and Bollinger band positioning into a single composite metric.
---
## Core Methodology
### Buy/Sell Logic
Marker (green or red )appear when **all four filters** pass:
**1. RMBS Score (Momentum Strength)**
From the formula Bellow
Combined Range: -10 (extreme bearish) to +10 (extreme bullish)
Signal Thresholds:
• BUY: Score > +3.0
• SELL: Score < -3.0
2. EMA Trend Filter
BUY: EMA(21) > EMA(55) → Uptrend confirmed
SELL: EMA(21) < EMA(55) → Downtrend confirmed
3. ADX Strength Filter
Minimum ADX: 25 (adjustable 20-30)
ADX > 25: Trending market → Signal allowed
ADX < 25: Range-bound → Signal blocked
4. Alternating Logic
Prevents signal spam by requiring alternation:
✓ BUY → SELL → BUY (allowed)
✗ BUY → BUY → BUY (blocked)
________________________________________
Mathematical Foundation
RMBS Formula: scoring method developed by Ario
RMBS = (RSI – 50) / 10 + ((BB_pos – 50) / 10)
where:
• RSI = Relative Strength Index (close, L)
• BB_pos = (Close – (SMA – 2 σ)) / ((SMA + 2 σ) – (SMA – 2 σ)) × 100
• σ = standard deviation of close over lookback L
• SMA = simple moving average of close over lookback L
• L = rmbs_length (period setting)
This produces a normalized composite score around zero:
• Positive → bullish momentum and upper band dominance
• Negative → bearish momentum and lower band pressure
• Near 0 → neutral or transitional zone
Input Parameters
ADX Threshold (default: 25)
• Lower (20-23): More signals, less filtering
• Higher (28-30): Fewer signals, stronger trends
• Recommended: 25 for balanced filtering
Signal Thresholds
• BUY: +3.0 (adjustable)
• SELL: -3.0 (adjustable)
Visual Options
• Marker colors
• Background highlights
• Alert settings
________________________________________
Usage Guidelines
How to Interpret
• 🟢 Green Marker: All conditions met for Bull condition
• 🔴 Red Marker: All conditions met for Bear condition
• No Marker: Waiting for confirmation
________________________________________
Important Disclaimers
⚠️ Educational Purpose Only
• This tool demonstrates multi-factor technical analysis concepts
• Not financial advice or trade recommendations
• No guarantee of profitability
⚠️ Known Limitations
• Less effective in ranging/choppy markets
• Requires proper risk management (stop-loss, position sizing)
• Should be combined with fundamental analysis
⚠️ Risk Warning
Trading involves substantial risk of loss. Past performance does not indicate future results. Always conduct your own research and consult professionals before trading.
________________________________________
Open Source
Full Pine Script code available for educational study and modification. Feedback and improvement suggestions welcome.
“All logic is presented for research and educational visualization.”
---
**Attribution & Fair Use Notice**
The RMBS scoring framework (Multi-Factor Momentum System) was originally designed and formulated by *Ahmadrezarahmati( Ario or Ario_ Pine Lab)*.
If you build upon, modify, or republish this logic—please include proper attribution to the original author. This request is made under a spirit of open collaboration and educational fairness.
Camarilla Pivots + 20 EMA StrategyThis is an intraday volatility and trend-following system for commodities like Natural Gas, combining dynamic pivot levels (Camarilla) with a trend filter (20-period EMA) to improve risk-reward and reduce false breakouts.
Core Components
1. Camarilla Pivots:
These are special support and resistance levels (H3, H4, L3, L4) calculated each day based on the previous day's high, low, and close.
The pivots adapt to daily volatility, giving more relevant breakout and bounce zones than static lines.
H4: Aggressive resistance (used for breakout LONG entry)
H3: Moderate resistance/support (used for bounce or stoploss)
L4: Aggressive support (used for breakout SHORT entry)
L3: Moderate support/resistance (used for bounce or stoploss)
2. 20 EMA (Exponential Moving Average):
Plotted on the 30-minute chart, this acts as a trend filter.
If the price is above 20 EMA: Only look for long trades (bullish bias).
If below 20 EMA: Only look for short trades (bearish bias).
How the Strategy Works
Setup (30-Min Chart):
Camarilla pivots for the day are drawn on the chart.
20 EMA is also plotted.
Trade Filter:
Bullish: Trade ONLY if price is above 20 EMA.
Bearish: Trade ONLY if price is below 20 EMA.
Entry:
LONG: Enter when price breaks and closes above the H4 pivot AND is above 20 EMA.
SHORT: Enter when price breaks and closes below the L4 pivot AND is below 20 EMA.
Stop Loss:
LONG: Place stoploss at H3 (the next lower Camarilla resistance).
SHORT: Place stoploss at L3 (the next higher Camarilla support).
Target:
Always set a profit target at 2x the distance (risk) between entry and stoploss (strict R:R 2).
For example, if your entry is at H4 and stoploss at H3, your target is entry + 2*(entry - stoploss).
Alerts & Visuals:
The strategy plots entry arrows, stoploss and target lines for immediate visual reference.
Alerts trigger on breakout signals so you never miss a trade.
Why This Works Well for Natural Gas
Adapts to volatility: The pivots change daily, handling wide-ranging and choppy price moves better than fixed breakouts.
Trend filter: EMA prevents counter-trend whipsaws, only trades with market momentum.
Risk control: Every trade must meet strict risk-reward criteria, so losses are contained and winners can outweigh losers.

Realtime rVOL w/ Candle Highlight [Blk0ut]About This Script
Realtime rVOL Table + Candle Highlight (Presets, No Smoothing)
By Blk0ut
This tool visualizes real-time relative volume (rVOL) directly on your chart and in a compact table, helping traders identify where intraday participation deviates from the session’s baseline.
Unlike standard volume overlays, this script recalculates rVOL dynamically through the session and highlights candles when participation exceeds configurable thresholds — providing a clear picture of ignition zones, volume surges, and potential breakout conditions.
Core Features
-Realtime rVOL tracking: Displays the current bar’s relative volume ratio compared to a moving baseline of recent bars.
-Preset Profiles: Choose from four purpose-built profiles to quickly adjust the rVOL sensitivity to your trading horizon.
----------------------------------------------------------------------
*Opening Rush: 100-bar lookback, threshold 2.5*
*RTH 5m: 30-bar lookback, threshold 1.2*
*RTH 1hr: 50-bar lookback, threshold 1.5*
*RTH 1d+: 100-bar lookback, threshold 1.5*
----------------------------------------------------------------------
RTH-only filter: Option to limit the moving average baseline to regular market hours (09:30–16:00).
Candle highlighting: Optionally outlines candles when rVOL exceeds the active threshold to emphasize spikes visually in real time.
Table display: Compact dashboard showing current rVOL, raw volume, average baseline, and preset parameters.
How To Use
Select a preset that matches your timeframe or trading style.
Scalpers and open traders can use RTH 5m or Opening Rush.
Position or swing traders may prefer RTH 1hr or RTH 1d+.
Watch for rVOL readings above the threshold (and colored candle outlines). These often correspond to momentum ignition, news impact, or institutional activity.
Combine with VWAP, ORB, or intraday key levels for best confirmation.
Notes
The table automatically adapts to your chart corner choice.
Highlight thresholds can follow the preset or be set manually.
Color intensity tiers (High/Medium/Low) can be tuned in settings.
Designed for intraday and session-based traders who rely on live volume context rather than end-of-day stats.

Micro SuiteWhat it is: One Pine v5 indicator that stacks several tools: EMA ribbon + a color-flipping 11/34 EMA trend line, multi-timeframe RSI pressure arrows, and a Bollinger Band re-entry system that marks Top/Bottom triggers (T/B) and later “r” confirmations. It also sprinkles in 3-Line Strike, Leledc exhaustion dots, and a small “Micro Dots” engine (ATR regime + VMA filter). Alerts for all of it.
TradingView
The core signals you’ll actually use:
RSI arrows: Up arrow when current RSI(6) < 30 and selected higher-TF RSIs are also < 30; down arrow when > 70 cluster cools. Idea = stacked OB/OS “pressure.”
TradingView
Bollinger re-entry (T/B + r):
T = first close back inside upper band; B = first close back inside lower band.
r = confirmation within N bars (price takes out the trigger bar’s high/low). These bars tint so they’re easy to see.
TradingView
Trend filter: EMA-11 vs EMA-34 color flip + optional VMA trend line; helps you ignore counter-trend stabs.
TradingView
Quick playbook (how to read it):
Reversal short: See a T near the top band → get the r within your window → bonus if a down RSI arrow or a Leledc high dot shows up.
Reversal long: Mirror that with B → r, plus an up RSI arrow/Leledc low dot.
Continuation: If Micro Dot stays green (or red) and 11>34 EMA holds, ignore isolated T/B traps.
TradingView
Inputs that matter:
confirmBars for the T/B “r” window.
Which higher-TF RSIs must agree for arrows.
Show/hide and lengths for EMAs and BB.
Micro block: show dots, VMA line, and speed (Fast/Med/Slow).
TradingView
Why people like it: You get trend, momentum, and mean-revert cues on one pane with ready-made alerts, so it’s easier to build a ruleset (e.g., “only take B→r longs when 11>34 and there’s an RSI up arrow”).
TradingView
Caveats: It’s still just TA—OB/OS clusters can persist in trends; confirmations can miss V-shaped turns; and stacking signals can be late in fast markets. Pair it with risk rules (fixed R, ATR stops) and a higher-TF bias.
One-liner cheat sheet:
Longs: B → r + RSI up arrow + 11>34 (optional Micro Dot green).
Shorts: T → r + RSI down arrow + 11<34 (optional Micro Dot red).
TradingView

DCC Sessions Pro — fixed sessionsDCC Sessions Pro automatically highlights the three main market sessions directly on your candles for a clean and professional chart view.
• Asia (purple): 01:00 – 08:00
• London (blue): 08:00 – 15:30
• US (orange): 15:30 – 23:00
Weekends are automatically excluded so you only see relevant price action.
Perfect for intraday traders who want to track session behavior, volume shifts, and liquidity timing without overlapping colors or messy backgrounds.

Katana_Fox RSI Pro - Advanced Momentum Indicator with Clear BUOverview:
Connors RSI Pro is a sophisticated enhancement of the classic Connors RSI indicator, designed for traders who demand professional-grade tools. This premium version combines multiple momentum components with intelligent signaling and beautiful visualization to give you an edge in the markets.
Key Features:
🎯 Clear BUY/SELL Signal System
BUY signals in green when CRSI crosses above oversold level
SELL signals in red when CRSI crosses below overbought level
Clean, professional labels that are easy to read
Customizable overbought/oversold levels (70/30 default)
🎨 Professional Visualization
Modern color scheme that adapts to market conditions
Customizable background fills for better readability
Smooth, easy-to-read line plotting
⚡ Enhanced Calculations
Triple-component momentum analysis (RSI, UpDown RSI, Percent Rank)
EMA smoothing for reduced noise and false signals
Configurable lengths for each component
🔔 Advanced Alert System
4 distinct alert conditions for various market scenarios
Compatible with TradingView's native alert system
Perfect for automated trading strategies
Input Parameters:
RSI Length (3): Period for standard RSI calculation
UpDown Length (2): Period for UpDown RSI component
ROC Length (100): Period for Rate of Change percentile ranking
Signal Alerts: Toggle BUY/SELL signals on/off
Custom Colors: Choose between classic and modern color schemes
Trading Signals:
BUY (Green Label): Bullish signal when CRSI crosses above oversold level
SELL (Red Label): Bearish signal when CRSI crosses below overbought level
Background Colors: Visual zones indicating momentum strength
Ideal For:
Swing traders seeking momentum reversals
Day traders looking for overbought/oversold conditions
Algorithmic traders needing reliable signals
Technical analysts wanting multi-timeframe confirmation
How to Use:
Oversold Bounce: Enter long when CRSI shows BUY signal above 30
Overbought Rejection: Enter short when CRSI shows SELL signal below 70
Trend Confirmation: Use the 50-level crossover for trend direction
Divergence Trading: Look for price/indicator divergences at extremes
Upgrade your trading arsenal with Connors RSI Pro - where professional analytics meet clear trading signals!

Advantage RSI PredictorThe Relative Strength Index (RSI) is a widely used momentum oscillator that measures the speed and change of price movements, typically on a scale from 0 to 100, to identify overbought (above 70) or oversold (below 30) conditions. However, its reliance on historical data limits its ability to predict future price movements. To overcome this, an advanced indicator—termed the Advanced RSI Predictor (ARP)—can be developed to provide predictive bands for RSI levels, enhancing its forecasting potential.The ARP leverages machine learning techniques, such as Long Short-Term Memory (LSTM) networks, combined with traditional RSI calculations to forecast future RSI values and establish confidence intervals or bands. These bands represent a range within which the RSI is likely to fluctuate over a specified period, offering traders a probabilistic perspective on momentum shifts. The indicator starts with the standard RSI computation, using a 14-period lookback as a foundation, but enriches this by incorporating additional inputs like moving averages, volatility measures (e.g., Bollinger Bands width), and trading volume. These features are processed through an LSTM model trained on historical price and RSI data to predict future RSI trajectories.The output includes upper and lower predictive bands, typically set at a 95% confidence level, surrounding a central forecasted RSI line. For example, if the current RSI is 45, the ARP might project a band from 40 to 50 over the next five days, indicating potential momentum stability or a range for overbought/oversold thresholds. The bands adapt dynamically to market conditions—narrowing during stable trends and widening during volatile periods—using real-time data updates. This adaptability allows traders to anticipate breakouts or reversals before they manifest on the price chart.Validation can be strengthened through backtesting against historical data, ensuring the ARP’s bands align with significant market turns. This indicator proves especially valuable in trending markets, where traditional RSI levels (e.g., 70 or 30) may falter, offering a sophisticated tool for informed trading or investment decisions.

John Bollinger's Bollinger BandsJapanese below / 日本語説明は下記
This indicator replicates how John Bollinger, the inventor of Bollinger Bands, uses Bollinger Bands, displaying Bollinger Bands, %B and Bandwidth in one indicator with alerts and signals.
Bollinger Bands is created by John Bollinger in 1980s who is an American financial trader and analyst. He introduced %B and Bandwidth 30 years later.
🟦 What's different from other Bollinger Bands indicator?
Unlike the default Bollinger Bands or other custom Bollinger Bands indicators on TradingView, this indicator enables to display three Bollinger Bands tools into a single indicator with signals and alerts capability.
You can plot the classic Bollinger Bands together with either %B or Bandwidth or three tools altogether which requires the specific setting(see below settings).
This makes it easy to quantitatively monitor volatility changes and price position in relation to Bollinger Bands in one place.
🟦 Features:
Plots Bollinger Bands (Upper, Basis, Lower) with fill between bands.
Option to display %B or Bandwidth with Bollinger Bands.
Plots highest and lowest Bandwidth levels over a customizable lookback period.
Adds visual markers when Bandwidth reaches its highest (Bulge) or lowest (Squeeze) value.
Includes ready-to-use alert conditions for Bulge and Squeeze events.
📈Chart
Green triangles and red triangles in the bottom chart mark Bulges and Squeezes respectively.
🟦 Settings:
Length: Number of bars used for Bollinger Band middleline calculation.
Basis MA Type: Choose SMA, EMA, SMMA (RMA), WMA, or VWMA for the midline.
StdDev: Standard deviation multiplier (default = 2.0).
Option: Select "Bandwidth" or "%B" (add the indicator twice if you want to display both).
Period for Squeeze and Bulge: Lookback period for detecting the highest and lowest Bandwidth levels.(default = 125 as specified by John Bollinger )
Style Settings: Colors, line thickness, and transparency can be customized.
📈Chart
The chart below shows an example of three Bollinger Bands tools: Bollinger Band, %B and Bandwidth are in display.
To do this, you need to add this indicator TWICE where you select %B from Option in the first addition of this indicator and Bandwidth from Option in the second addition.
🟦 Usage:
🟠Monitor Volatility:
Watch Bandwidth values to spot volatility contractions (Squeeze) and expansions (Bulge) that often precede strong price moves.
John Bollinger defines Squeeze and Bulge as follows;
Squeeze:
The lowest bandwidth in the past 125 period, where trend is born.
Bulge:
The highest bandwidth in the past 125 period where trend is going to die.
According to John Bollinger, this 125 period can be used in any timeframe.
📈Chart1
Example of Squeeze
You can see uptrends start after squeeze(red triangles)
📈Chart2
Example of Bulge
You can see the trend reversal from downtrend to uptrends at the bulge(green triangles)
📈Chart3
Bulge DOES NOT NECESSARILY mean the beginning of a trend in opposite direction.
For example, you can see a bulge happening in the right side of the chart where green triangles are marked. Nevertheless, uptrend still continues after the bulge.
In this case, the bulge marks the beginning of a consolidation which lead to the continuation of the trend. It means that a phase of the trend highlighted in the light blue box came to an end.
Note: light blue box is not drawn by the indicator.
Like other technical analysis methods or tools, these setups do not guarantee birth of new trends and trend reversals. Traders should be carefully observing these setups along with other factors for making decisions.
🟠Track Price Position:
Use %B to see where price is located in relation to the Bollinger Bands.
If %B is close to 1, the price is near upper band while %B is close to 0, the price is near lower band.
🟠Set Alerts:
Receive alerts when Bandwidth hits highest and lowest values of bandwidth, helping you prepare for potential breakout, ending of trends and trend reversal opportunities.
🟠Combine with Other Tools:
This indicator would work best when combined with price action, trend analysis, or
market environmental analysis.
—————————————————————————————
このインジケーターはボリンジャーバンドの考案者であるジョン・ボリンジャー氏が提唱するボリンジャーバンドの使い方を再現するために、ボリンジャーバンド、%B、バンドウィズ(Bandwidth) の3つを1つのインジケーターで表示可能にしたものです。シグナルやアラートにも対応しています。
ボリンジャーバンドは1980年代にアメリカ人トレーダー兼アナリストのジョン・ボリンジャー氏によって開発されました。彼はその30年後に%Bとバンドウィズを導入しました。
🟦 他のボリンジャーバンドとの違い
TradingView標準のボリンジャーバンドや他のボリンジャーバンドとは異なり、このインジケーターでは3つのボリンジャーバンドツールを1つのインジケーターで表示し、シグナルやアラート機能も利用できるようになっています。
一般的に知られている通常のボリンジャーバンドに加え、%Bやバンドウィズを組み合わせて表示でき、設定次第では3つすべてを同時にモニターすることも可能です。これにより、価格とボリンジャーバンドの位置関係とボラティリティ変化をひと目で、かつ定量的に把握することができます。
🟦 機能:
ボリンジャーバンド(アッパーバンド・基準線・ロワーバンド)を描画し、バンド間を塗りつぶし表示。
オプションで%Bまたはバンドウィズを追加表示可能。
バンドウィズの最高値・最安値を、任意の期間で検出して表示。
バンドウィズが指定期間の最高値(バルジ※)または最安値(スクイーズ)に達した際にシグナルを表示。
※バルジは一般的にボリンジャーバンドで用いられるエクスパンションとほぼ同じ意味ですが、定義が異なります。(下記参照)
バルジおよびスクイーズ発生時のアラート設定が可能。
📈 チャート例
下記チャートの緑の三角と赤の三角は、それぞれバルジとスクイーズを示しています。
🟦 設定:
Length: ボリンジャーバンドの基準線計算に使う期間。
Basis MA Type: SMA, EMA, SMMA (RMA), WMA, VWMAから選択可能。
StdDev: 標準偏差の乗数(デフォルト2.0)。
Option: 「Bandwidth」または「%B」を選択(両方表示するにはこのインジケーターを2回追加)。
Period for Squeeze and Bulge: Bandwidthの最高値・最安値を検出する期間(デフォルトはジョン・ボリンジャー氏が推奨する125)。
Style Settings: 色、線の太さ、透明度などをカスタマイズ可能。
📈 チャート例
下のチャートは「ボリンジャーバンド」「%B」「バンドウィズ」の3つを同時に表示した例です。
この場合、インジケーターを2回追加し、最初に追加した方ではOptionを「%B」に、次に追加した方では「Bandwidth」を選択します。
🟦 使い方:
🟠 ボラティリティを監視する:
バンドウィズの値を見ることで、価格変動の収縮(スクイーズ)や拡大(バルジ)を確認できます。
これらはしばしば強い値動きの前兆となります。
ジョン・ボリンジャー氏はスクイーズとバルジを次のように定義しています:
スクイーズ: 過去125期間の中で最も低いバンドウィズ→ 新しいトレンドが生まれる場所。
バルジ: 過去125期間の中で最も高いバンドウィズ → トレンドが終わりを迎える場所。
この「125期間」はどのタイムフレームでも利用可能とされています。
📈 チャート1
スクイーズの例
赤い三角のスクイーズの後に上昇トレンドが始まっているのが確認できます。
📈 チャート2
バルジの例
緑の三角のバルジの箇所で下降トレンドから上昇トレンドへの反転が見られます。
📈 チャート3
バルジが必ずしも反転を意味しない例
下記のチャート右側の緑の三角で示されたバルジの後も、上昇トレンドが継続しています。
この場合、バルジは反転ではなく「トレンド一時的な調整(レンジ入り)」を示しており、結果的に上昇トレンドが継続しています。
この場合、バルジは水色のボックスで示されたトレンドのフェーズの終わりを示しています。
※水色のボックスはインジケーターが描画したものではありません。
また、他のテクニカル分析と同様に、これらのセットアップは必ず新しいトレンドの発生やトレンド転換を保証するものではありません。トレーダーは他の要素も考慮し、慎重に意思決定する必要があります。
🟠 価格とボリンジャーバンドの位置関係を確認する:
%Bを利用すれば、価格がバンドのどこに位置しているかを簡単に把握できます。
%Bが1に近ければ価格はアッパーバンド付近、0に近ければロワーバンド付近にあります。
🟠 アラートを設定する:
バンドウィズが一定期間の最高値または最安値に到達した際にアラートを設定することで、ブレイクアウトやトレンド終了、反転の可能性に備えることができます。
🟠 他のツールと組み合わせる:
このインジケーターは、プライスアクション、トレンド分析、環境認識などと組み合わせて活用すると最も効果的です。

自定义均线(多色 & 分级线宽)Title: Multi-Color Moving Average Suite (MA5…MA4320) — Pine v6
Summary (1–2 lines):
An overlay indicator that plots a full ladder of SMA lines from MA5 up to MA4320. Each MA has a unique color, and line width scales with period (short = thin, mid = medium, long = thick) to make trend structure easy to read at a glance.
What it does
• Plots 16 simple moving averages: 5, 10, 20, 30, 60, 120, 160, 240, 480, 720, 960, 1440, 1750, 2880, 4320.
• Distinct colors for every MA to avoid confusion when lines cluster.
• Period-based thickness:
• Short-term (<60) = thin,
• Mid-term (60–160) = medium,
• Long-term (≥240) = thick (capped; no unlimited growth).
• Designed for quick trend reading across intraday to multi-year cycles (especially useful for 24/7 markets like crypto).
How to use
1. Add the indicator to any chart (works on all symbols/timeframes).
2. Use the thin/medium/thick visual hierarchy to identify short-/mid-/long-term bias and crossovers.
3. On very low timeframes, consider hiding some ultra-long MAs if your chart has insufficient history.
Notes
• Built with Pine Script v6; uses ta.sma(close, length) only (no repainting).
• Very long MAs (e.g., 2880/4320) require enough bars; they will display na until sufficient history loads.
• No inputs/alerts by default—kept intentionally simple for clarity. (Easy to extend with toggles, custom colors, EMA/WMA options, alerts, etc.)
Credits
Author: TraderFinsher (customized multi-MA visualization with color and thickness hierarchy).
⸻
标题: 多色均线系统(MA5…MA4320)— Pine v6
摘要(1–2 句):
这是一个叠加在价格上的 SMA 均线组,从 MA5 到 MA4320。为每条均线设置了 独立颜色,并按 周期长度分级线宽(短=细、中=中等、长=较粗),让趋势结构一眼可读。
功能说明
• 绘制 16 条简单移动平均线:5、10、20、30、60、120、160、240、480、720、960、1440、1750、2880、4320。
• 全部不同颜色,避免密集时混淆。
• 线宽随周期分级:
• 短期(<60)= 细,
• 中期(60–160)= 中等,
• 长期(≥240)= 粗(封顶,不再无限加粗)。
• 适合从日内到多年周期的 趋势快速判读(对加密等 24/7 市场尤为友好)。
使用建议
1. 将指标添加到任意品种/周期。
2. 结合细/中/粗的视觉层级,判断短/中/长趋势与均线交叉。
3. 在较低周期下,如果历史数据不足,可隐藏部分超长均线。
注意事项
• 使用 Pine v6,仅调用 ta.sma(close, length),不重绘。
• 超长均线需要足够历史数据,未满足前会显示 na。
• 默认不含参数和告警,追求简洁清晰(后续可扩展开关、自定义颜色/线宽、EMA/WMA 选项与告警等)。
致谢
作者:TraderFinsher(基于颜色与线宽层级的多均线可视化)。

Gap ZonesThis TradingView indicator automatically detects daily price gaps and plots them clearly on any timeframe (intraday or daily).
It helps visualize where unfilled gaps are sitting, track whether they’ve been filled, and control how far the zone extends.
Key Features
1. Daily Gap Detection
• Works even when you’re on intraday charts (uses daily OHLC data).
• Marks both gap up (potential support zones) and gap down (potential resistance zones).
2. Shaded Gap Zones
• Each gap is highlighted as a band (greenish for up, reddish for down).
• Option to turn shading off if you just want horizontal lines.
3. Hide When Filled
• Once price closes or touches the far side of the gap, it disappears (configurable: Touch vs Close).
4. Lookback Window
• Gaps only show if they occurred within the past X trading days (default: 30).
• Prevents your chart from being cluttered with ancient gaps.
5. Multiple Gaps Tracked
• Can track up to 5 recent gaps simultaneously.
• Oldest gaps “roll off” as new ones form.
6. Finite Right-Edge Guides
• Optional horizontal guide lines extend to the right, but only for a fixed number of bars (default: 50).
• Cleaner than infinite extensions.
7. Gap-Day Marker
• Optional vertical line drawn on the bar where the gap first occurred.
⸻
⚙️ Inputs & Settings
When you apply the indicator, you’ll see these options:
• Lookback (trading days): How far back to scan for gaps (default 30).
• Max gaps to show (1..5): How many simultaneous gap zones to display.
• Min gap size (% of prior close): Filter out tiny gaps (default 0.25%).
• Hide gaps once filled: Removes a gap from the chart once filled.
• Fill rule uses CLOSE (off = Touch):
• Touch = filled when price trades through the level intraday.
• Close = filled only when a candle close crosses it.
• Show shading: Toggle zone fills on/off.
• Show vertical marker on gap day: Toggle gap-day marker line.
• Show finite right-edge lines: Toggle horizontal lines extending right.
• Right line length (bars): How far those lines extend (default 50 bars).
⸻
🟢 How to Use It
1. Apply on Any Chart
• Works best on daily or intraday (5m, 15m, 1h).
• Gaps are always calculated from daily data, so intraday charts will show higher-timeframe gaps correctly.
2. Interpret Colors
• Green shading = Gap Up (often acts as support).
• Red shading = Gap Down (often acts as resistance).
3. Watch for Fills
• When price re-enters the gap zone, the indicator checks if it’s “filled” (based on your Touch/Close setting).
• If “Hide When Filled” is on, the zone vanishes.
4. Trade Context
• Many traders use gaps as targets (expecting a fill) or levels of support/resistance.
• Combined with your bull put/bear call spread strategies, it helps confirm strong levels.

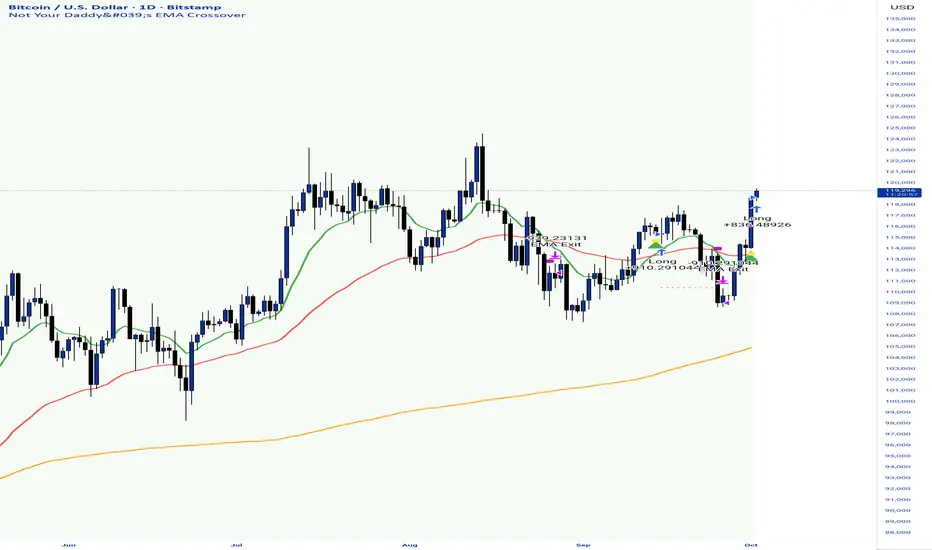
Not Your Daddy's EMA CrossoverNot Your Daddy's EMA Crossover - Quick Guide
What It Does
This isn't your typical 50/200 EMA crossover. It uses academically-proven, optimized EMA periods specifically backtested for crypto markets. Instead of generic settings, it adapts to different trading styles with research-backed parameter combinations that have demonstrated real returns.
Core Logic
Enters when fast EMA crosses slow EMA in the trend direction (confirmed by 200 SMA filter)
Exits either on opposite EMA cross (trend-following) or at fixed profit targets (scalping)
Uses a 200 SMA to filter trades - only longs above it, only shorts below it
Key Settings & Toggles
1. Trading Style (Auto-adjusts EMA periods):
"15 Min Scalping": 9/21 EMA - Fast-paced, frequent signals
"1 Hour Swing": 13/48 EMA - For swing trading
"Daily Trend": 15/150 MA - Captured +97.87% in bull runs
2. Entry Method:
"Crossover Entry": Enters immediately on EMA cross
"Pullback to EMA Entry": Waits for first pullback to slow EMA (better risk/reward)
3. Exit Method:
"EMA Cross Exit": Trend-following, lets winners run until EMAs reverse
"Fixed % Target (Scalping)": Quick 0.5-1% profits with tight stops
4. Optional Features:
MACD Confirmation: Adds 6-15-1 MACD filter for higher-probability setups
Periodic Compounding: Compounds every 30 hours (research shows 1-30 hour compounding is optimal)
Recommended Timeframes
📊 Match your chart to your selection:
Select "15 Min Scalping" → Use 15-minute chart
Select "1 Hour Swing" → Use 1-hour chart
Select "Daily Trend" → Use daily chart
I personally like this on the daily, which coincidentally is printing a long signal today on Bitcoin.
Enjoy!
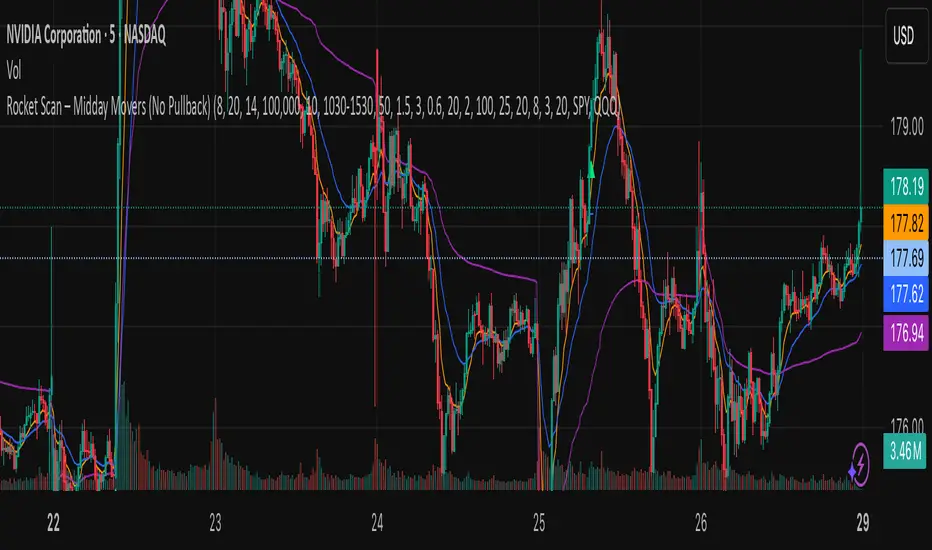
Rocket Scan – Midday Movers (No Pullback)This indicator is designed to spot intraday breakout movers that often appear after the market open — the ones that rip out of nowhere and cause FOMO if you’re late.
🔑 Core Logic
• Momentum Burst: Detects sudden price pops (ROC) with confirming relative volume.
• Squeeze → Breakout: Finds low-volatility compressions (tight Bollinger bandwidth) and flags the first breakout move.
• VWAP Reclaims: Highlights strong reversals when price reclaims VWAP on volume.
• Relative Volume (RVOL): Filters for unusual activity vs. recent averages.
• Gap Filter: Skips large overnight gappers, focuses on fresh intraday movers.
• Relative Strength: Optional filter requiring the symbol to outperform SPY (and sector ETF if chosen).
• Session Window: Default 10:30–15:30 ET to ignore noisy open action and catch true midday moves.
🎯 Use Case
• Built for traders who want early alerts on midday runners without waiting for pullbacks.
• Helps identify potential entry points before FOMO kicks in.
• Works best on liquid tickers (stocks, ETFs, crypto) with reliable intraday volume.
📊 Visuals
• Plots fast EMA, slow EMA, and VWAP for trend context.
• Paints green ▲ for long signals and red ▼ for short signals on the chart.
• Info label shows RVOL, ROC, RS filter status, and gap conditions.
🚨 Alerts
Two alert conditions included:
• Rocket: Midday LONG → Fires when bullish conditions align.
• Rocket: Midday SHORT → Fires when bearish conditions align.
⸻
⚠️ Disclaimer:
This tool is for educational and research purposes only. It is not financial advice. Trading involves risk; always do your own research or consult a licensed professional.
Order Block Volumatic FVG StrategyInspired by: Volumatic Fair Value Gaps —
License: CC BY-NC-SA 4.0 (Creative Commons Attribution–NonCommercial–ShareAlike).
This script is a non-commercial derivative work that credits the original author and keeps the same license.
What this strategy does
This turns BigBeluga’s visual FVG concept into an entry/exit strategy. It scans bullish and bearish FVG boxes, measures how deep price has mitigated into a box (as a percentage), and opens a long/short when your mitigation threshold and filters are satisfied. Risk is managed with a fixed Stop Loss % and a Trailing Stop that activates only after a user-defined profit trigger.
Additions vs. the original indicator
✅ Strategy entries based on % mitigation into FVGs (long/short).
✅ Lower-TF volume split using upticks/downticks; fallback if LTF data is missing (distributes prior bar volume by close’s position in its H–L range) to avoid NaN/0.
✅ Per-FVG total volume filter (min/max) so you can skip weak boxes.
✅ Age filter (min bars since the FVG was created) to avoid fresh/immature boxes.
✅ Bull% / Bear% share filter (the 46%/53% numbers you see inside each FVG).
✅ Optional candle confirmation and cooldown between trades.
✅ Risk management: fixed SL % + Trailing Stop with a profit trigger (doesn’t trail until your trigger is reached).
✅ Pine v6 safety: no unsupported args, no indexof/clamp/when, reverse-index deletes, guards against zero/NaN.
How a trade is decided (logic overview)
Detect FVGs (same rules as the original visual logic).
For each FVG currently intersected by the bar, compute:
Mitigation % (how deep price has entered the box).
Bull%/Bear% split (internal volume share).
Total volume (printed on the box) from LTF aggregation or fallback.
Age (bars) since the box was created.
Apply your filters:
Mitigation ≥ Long/Short threshold.
Volume between your min and max (if enabled).
Age ≥ min bars (if enabled).
Bull% / Bear% within your limits (if enabled).
(Optional) the current candle must be in trade direction (confirm).
If multiple FVGs qualify on the same bar, the strategy uses the most recent one.
Enter long/short (no pyramiding).
Exit with:
Fixed Stop Loss %, and
Trailing Stop that only starts after price reaches your profit trigger %.
Input settings (quick guide)
Mitigation source: close or high/low. Use high/low for intrabar touches; close is stricter.
Mitigation % thresholds: minimal mitigation for Long and Short.
TOTAL Volume filter: skip FVGs with too little/too much total volume (per box).
Bull/Bear share filter: require, e.g., Long only if Bull% ≥ 50; avoid Short when Bull% is high (Short Bull% max).
Age filter (bars): e.g., ≥ 20–30 bars to avoid fresh boxes.
Confirm candle: require candle direction to match the trade.
Cooldown (bars): minimum bars between entries.
Risk:
Stop Loss % (fixed from entry price).
Activate trailing at +% profit (the trigger).
Trailing distance % (the trailing gap once active).
Lower-TF aggregation:
Auto: TF/Divisor → picks 1/3/5m automatically.
Fixed: choose 1/3/5/15m explicitly.
If LTF can’t be fetched, fallback allocates prior bar’s volume by its close position in the bar’s H–L.
Suggested starting presets (you should optimize per market)
Mitigation: 60–80% for both Long/Short.
Bull/Bear share:
Long: Bull% ≥ 50–70, Bear% ≤ 100.
Short: Bull% ≤ 60 (avoid shorting into strong support), Bear% ≥ 0–70 as you prefer.
Age: ≥ 20–30 bars.
Volume: pick a min that filters noise for your symbol/timeframe.
Risk: SL 4–6%, trailing trigger 1–2%, distance 1–2% (crypto example).
Set slippage/fees in Strategy Properties.
Notes, limitations & best practices
Data differences: The LTF split uses request.security_lower_tf. If the exchange/data feed has sparse LTF data, the fallback kicks in (it’s deliberate to avoid NaNs but is a heuristic).
Real-time vs backtest: The current bar can update until close; results on historical bars use closed data. Use “Bar Replay” to understand intrabar effects.
No pyramiding: Only one position at a time. Modify pyramiding in the header if you need scaling.
Assets: For spot/crypto, TradingView “volume” is exchange volume; in some markets it may be tick volume—interpret filters accordingly.
Risk disclosure: Past performance ≠ future results. Use appropriate position sizing and risk controls; this is not financial advice.
Credits
Visual FVG concept and original implementation: BigBeluga.
This derivative strategy adds entry/exit logic, volume/age/share filters, robust LTF handling, and risk management while preserving the original spirit.
License remains CC BY-NC-SA 4.0 (non-commercial, attribution required, share-alike).

Volume Delta Volume Signals by Claudio [hapharmonic]// This Pine Script™ code is subject to the terms of the Mozilla Public License 2.0 at mozilla.org
// © hapharmonic
//@version=6
FV = format.volume
FP = format.percent
indicator('Volume Delta Volume Signals by Claudio ', format = FV, max_bars_back = 4999, max_labels_count = 500)
//------------------------------------------
// Settings |
//------------------------------------------
bool usecandle = input.bool(true, title = 'Volume on Candles',display=display.none)
color C_Up = input.color(#12cef8, title = 'Volume Buy', inline = ' ', group = 'Style')
color C_Down = input.color(#fe3f00, title = 'Volume Sell', inline = ' ', group = 'Style')
// ✅ Nueva entrada para colores de señales
color buySignalColor = input.color(color.new(color.green, 0), "Buy Signal Color", group = "Signals")
color sellSignalColor = input.color(color.new(color.red, 0), "Sell Signal Color", group = "Signals")
string P_ = input.string(position.top_right,"Position",options = ,
group = "Style",display=display.none)
string sL = input.string(size.small , 'Size Label', options = , group = 'Style',display=display.none)
string sT = input.string(size.normal, 'Size Table', options = , group = 'Style',display=display.none)
bool Label = input.bool(false, inline = 'l')
History = input.bool(true, inline = 'l')
// Inputs for EMA lengths and volume confirmation
bool MAV = input.bool(true, title = 'EMA', group = 'EMA')
string volumeOption = input.string('Use Volume Confirmation', title = 'Volume Option', options = , group = 'EMA',display=display.none)
bool useVolumeConfirmation = volumeOption == 'none' ? false : true
int emaFastLength = input(12, title = 'Fast EMA Length', group = 'EMA',display=display.none)
int emaSlowLength = input(26, title = 'Slow EMA Length', group = 'EMA',display=display.none)
int volumeConfirmationLength = input(6, title = 'Volume Confirmation Length', group = 'EMA',display=display.none)
string alert_freq = input.string(alert.freq_once_per_bar_close, title="Alert Frequency",
options= ,group = "EMA",
tooltip="If you choose once_per_bar, you will receive immediate notifications (but this may cause interference or indicator repainting).
\n However, if you choose once_per_bar_close, it will wait for the candle to confirm the signal before notifying.",display=display.none)
//------------------------------------------
// UDT_identifier |
//------------------------------------------
type OHLCV
float O = open
float H = high
float L = low
float C = close
float V = volume
type VolumeData
float buyVol
float sellVol
float pcBuy
float pcSell
bool isBuyGreater
float higherVol
float lowerVol
color higherCol
color lowerCol
//------------------------------------------
// Calculate volumes and percentages |
//------------------------------------------
calcVolumes(OHLCV ohlcv) =>
var VolumeData data = VolumeData.new()
data.buyVol := ohlcv.V * (ohlcv.C - ohlcv.L) / (ohlcv.H - ohlcv.L)
data.sellVol := ohlcv.V - data.buyVol
data.pcBuy := data.buyVol / ohlcv.V * 100
data.pcSell := 100 - data.pcBuy
data.isBuyGreater := data.buyVol > data.sellVol
data.higherVol := data.isBuyGreater ? data.buyVol : data.sellVol
data.lowerVol := data.isBuyGreater ? data.sellVol : data.buyVol
data.higherCol := data.isBuyGreater ? C_Up : C_Down
data.lowerCol := data.isBuyGreater ? C_Down : C_Up
data
//------------------------------------------
// Get volume data |
//------------------------------------------
ohlcv = OHLCV.new()
volData = calcVolumes(ohlcv)
// Plot volumes and create labels
plot(ohlcv.V, color=color.new(volData.higherCol, 90), style=plot.style_columns, title='Total',display = display.all - display.status_line)
plot(ohlcv.V, color=volData.higherCol, style=plot.style_stepline_diamond, title='Total2', linewidth = 2,display = display.pane)
plot(volData.higherVol, color=volData.higherCol, style=plot.style_columns, title='Higher Volume', display = display.all - display.status_line)
plot(volData.lowerVol , color=volData.lowerCol , style=plot.style_columns, title='Lower Volume',display = display.all - display.status_line)
S(D,F)=>str.tostring(D,F)
volStr = S(math.sign(ta.change(ohlcv.C)) * ohlcv.V, FV)
buyVolStr = S(volData.buyVol , FV )
sellVolStr = S(volData.sellVol , FV )
// ✅ MODIFICACIÓN: Porcentaje sin decimales
buyPercentStr = str.tostring(math.round(volData.pcBuy)) + " %"
sellPercentStr = str.tostring(math.round(volData.pcSell)) + " %"
totalbuyPercentC_ = volData.buyVol / (volData.buyVol + volData.sellVol) * 100
sup = not na(ohlcv.V)
if sup
TC = text.align_center
CW = color.white
var table tb = table.new(P_, 6, 6, bgcolor = na, frame_width = 2, frame_color = chart.fg_color, border_width = 1, border_color = CW)
tb.cell(0, 0, text = 'Volume Candles', text_color = #FFBF00, bgcolor = #0E2841, text_halign = TC, text_valign = TC, text_size = sT)
tb.merge_cells(0, 0, 5, 0)
tb.cell(0, 1, text = 'Current Volume', text_color = CW, bgcolor = #0B3040, text_halign = TC, text_valign = TC, text_size = sT)
tb.merge_cells(0, 1, 1, 1)
tb.cell(0, 2, text = 'Buy', text_color = #000000, bgcolor = #92D050, text_halign = TC, text_valign = TC, text_size = sT)
tb.cell(1, 2, text = 'Sell', text_color = #000000, bgcolor = #FF0000, text_halign = TC, text_valign = TC, text_size = sT)
tb.cell(0, 3, text = buyVolStr, text_color = CW, bgcolor = #074F69, text_halign = TC, text_valign = TC, text_size = sT)
tb.cell(1, 3, text = sellVolStr, text_color = CW, bgcolor = #074F69, text_halign = TC, text_valign = TC, text_size = sT)
tb.cell(0, 5, text = 'Net: ' + volStr, text_color = CW, bgcolor = #074F69, text_halign = TC, text_valign = TC, text_size = sT)
tb.merge_cells(0, 5, 1, 5)
tb.cell(0, 4, text = buyPercentStr, text_color = CW, bgcolor = #074F69, text_halign = TC, text_valign = TC, text_size = sT)
tb.cell(1, 4, text = sellPercentStr, text_color = CW, bgcolor = #074F69, text_halign = TC, text_valign = TC, text_size = sT)
cellCount = 20
filledCells = 0
for r = 5 to 1 by 1
for c = 2 to 5 by 1
if filledCells < cellCount * (totalbuyPercentC_ / 100)
tb.cell(c, r, text = '', bgcolor = C_Up)
else
tb.cell(c, r, text = '', bgcolor = C_Down)
filledCells := filledCells + 1
filledCells
if Label
sp = ' '
l = label.new(bar_index, ohlcv.V,
text=str.format('Net: {0}\nBuy: {1} ({2})\nSell: {3} ({4})\n{5}/\\\n {5}l\n {5}l',
volStr, buyVolStr, buyPercentStr, sellVolStr, sellPercentStr, sp),
style=label.style_none, textcolor=volData.higherCol, size=sL, textalign=text.align_left)
if not History
(l ).delete()
//------------------------------------------
// Draw volume levels on the candlesticks |
//------------------------------------------
float base = na,float value = na
bool uc = usecandle and sup
if volData.isBuyGreater
base := math.min(ohlcv.O, ohlcv.C)
value := base + math.abs(ohlcv.O - ohlcv.C) * (volData.pcBuy / 100)
else
base := math.max(ohlcv.O, ohlcv.C)
value := base - math.abs(ohlcv.O - ohlcv.C) * (volData.pcSell / 100)
barcolor(sup ? color.new(na, na) : ohlcv.C < ohlcv.O ? color.red : color.green,display = usecandle? display.all:display.none)
UseC = uc ? volData.higherCol:color.new(na, na)
plotcandle(uc?base:na, uc?base:na, uc?value:na, uc?value:na,
title='Body', color=UseC, bordercolor=na, wickcolor=UseC,
display = usecandle ? display.all - display.status_line : display.none, force_overlay=true,editable=false)
plotcandle(uc?ohlcv.O:na, uc?ohlcv.H:na, uc?ohlcv.L:na, uc?ohlcv.C:na,
title='Fill', color=color.new(UseC,80), bordercolor=UseC, wickcolor=UseC,
display = usecandle ? display.all - display.status_line : display.none, force_overlay=true,editable=false)
//------------------------------------------------------------
// Plot the EMA and filter out the noise with volume control. |
//------------------------------------------------------------
float emaFast = ta.ema(ohlcv.C, emaFastLength)
float emaSlow = ta.ema(ohlcv.C, emaSlowLength)
bool signal = emaFast > emaSlow
color c_signal = signal ? C_Up : C_Down
float volumeMA = ta.sma(ohlcv.V, volumeConfirmationLength)
bool crossover = ta.crossover(emaFast, emaSlow)
bool crossunder = ta.crossunder(emaFast, emaSlow)
isVolumeConfirmed(source, length, ma) =>
math.sum(source > ma ? source : 0, length) >= math.sum(source < ma ? source : 0, length)
bool ISV = isVolumeConfirmed(ohlcv.V, volumeConfirmationLength, volumeMA)
bool crossoverConfirmed = crossover and (not useVolumeConfirmation or ISV)
bool crossunderConfirmed = crossunder and (not useVolumeConfirmation or ISV)
PF = MAV ? emaFast : na
PS = MAV ? emaSlow : na
p1 = plot(PF, color = c_signal, editable = false, force_overlay = true, display = display.pane)
plot(PF, color = color.new(c_signal, 80), linewidth = 10, editable = false, force_overlay = true, display = display.pane)
plot(PF, color = color.new(c_signal, 90), linewidth = 20, editable = false, force_overlay = true, display = display.pane)
plot(PF, color = color.new(c_signal, 95), linewidth = 30, editable = false, force_overlay = true, display = display.pane)
plot(PF, color = color.new(c_signal, 98), linewidth = 45, editable = false, force_overlay = true, display = display.pane)
p2 = plot(PS, color = c_signal, editable = false, force_overlay = true, display = display.pane)
plot(PS, color = color.new(c_signal, 80), linewidth = 10, editable = false, force_overlay = true, display = display.pane)
plot(PS, color = color.new(c_signal, 90), linewidth = 20, editable = false, force_overlay = true, display = display.pane)
plot(PS, color = color.new(c_signal, 95), linewidth = 30, editable = false, force_overlay = true, display = display.pane)
plot(PS, color = color.new(c_signal, 98), linewidth = 45, editable = false, force_overlay = true, display = display.pane)
fill(p1, p2, top_value=crossover ? emaFast : emaSlow,
bottom_value =crossover ? emaSlow : emaFast,
top_color =color.new(c_signal, 80),
bottom_color =color.new(c_signal, 95)
)
// ✅ Usar colores configurables para señales
plotshape(crossoverConfirmed and MAV, style=shape.triangleup , location=location.belowbar, color=buySignalColor , size=size.small, force_overlay=true,display =display.pane)
plotshape(crossunderConfirmed and MAV, style=shape.triangledown, location=location.abovebar, color=sellSignalColor, size=size.small, force_overlay=true,display =display.pane)
string msg = '---------\n'+"Buy volume ="+buyVolStr+"\nBuy Percent = "+buyPercentStr+"\nSell volume = "+sellVolStr+"\nSell Percent = "+sellPercentStr+"\nNet = "+volStr+'\n---------'
if crossoverConfirmed
alert("Price (" + str.tostring(close) + ") Crossed over MA\n" + msg, alert_freq)
if crossunderConfirmed
alert("Price (" + str.tostring(close) + ") Crossed under MA\n" + msg, alert_freq)

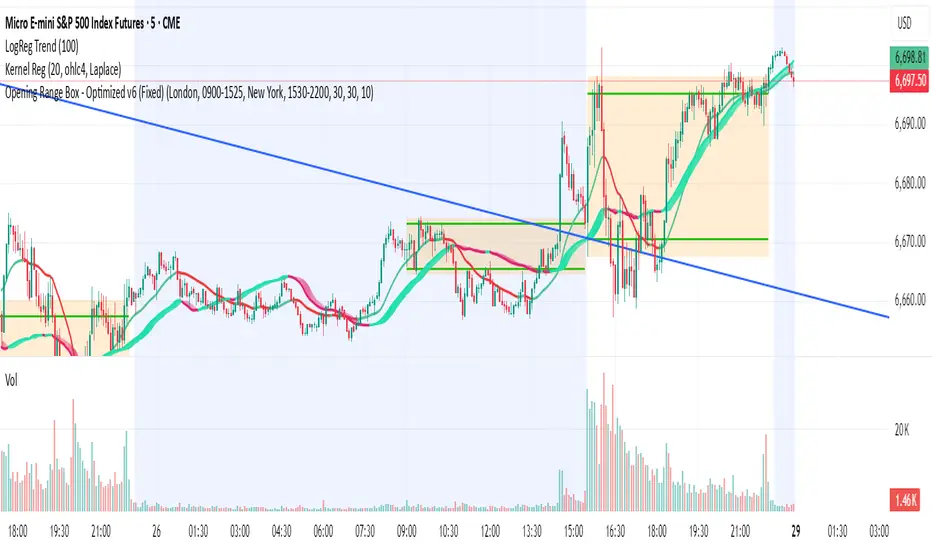
Opening Range BoxThis indicator, called the "Opening Range Box," is a visual tool that helps you track the start of key trading sessions like London and New York (or whatever session you set).
It does three main things:
Finds the Daily 'First Move': It automatically calculates the High and Low reached during the first 30 minutes (or whatever time you set) of each defined session.
Draws a Box: It immediately draws a colored, transparent box on your chart from the moment the session starts. The top of the box is the OR High, and the bottom is the OR Low. This box acts as a clear reference for the session's initial boundaries.
Extends the Levels: After the initial 30 minutes are over, the box stops growing vertically (it locks in the OR High/Low) but continues to stretch out horizontally for the rest of the trading session. This allows you to easily see how the price reacts to the opening levels throughout the day.
In short: It visually highlights the most important price levels established at the very beginning of the major market sessions.

Opening Range BoxThis indicator, called the "Opening Range Box," is a visual tool that helps you track the start of key trading sessions like London and New York.
It does three main things:
Finds the Daily 'First Move': It automatically calculates the High and Low reached during the first 30 minutes (or whatever time you set) of each defined session.
Draws a Box: It immediately draws a colored, transparent box on your chart from the moment the session starts. This box acts as a clear reference for the session's initial boundaries.
Extends the Levels: After the initial 30 minutes are over, the box stops growing vertically (it locks in the OR High/Low) but continues to stretch out horizontally for the rest of the trading session. This allows you to easily see how the price reacts to the opening levels throughout the day.
In short: It visually highlights the most important price levels established at the very beginning of the major market sessions.
Smart Money Support/Resistance — LiteSmart Money Support/Resistance — Lite
Overview & Methodology
This indicator identifies support and resistance as zones derived from concentrated buying and selling pressure, rather than relying solely on traditional swing highs/lows. Its design focuses on transparency: how data is sourced, how zones are computed, and how the on‑chart display should be interpreted.
Lower‑Timeframe (LTF) Data
The script requests Up Volume, Down Volume, and Volume Delta from a lower timeframe to expose intrabar order‑flow structure that the chart’s native timeframe cannot show. In practical terms, this lets you see where buyers or sellers briefly dominated inside the body of a higher‑timeframe bar.
bool use_custom_tf_input = input.bool(true, title="Use custom lower timeframe", tooltip="Override the automatically chosen lower timeframe for volume calculations.", group=grpVolume)
string custom_tf_input = input. Timeframe("1", title="Lower timeframe", tooltip="Lower timeframe used for up/down volume calculations (default 5 seconds).", group=grpVolume)
import TradingView/ta/10 as tvta
resolve_lower_tf(useCustom, customTF) =>
useCustom ? customTF :
timeframe.isseconds ? "1S" :
timeframe.isintraday ? "1" :
timeframe.isdaily ? "5" : "60"
get_up_down_volume(lowerTf) =>
= tvta.requestUpAndDownVolume(lowerTf)
var float upVolume = na
var float downVolume = na
var float deltaVolume = na
string lower_tf = resolve_lower_tf(use_custom_tf_input, custom_tf_input)
= get_up_down_volume(lower_tf)
upVolume := u_tmp
downVolume := d_tmp
deltaVolume := dl_tmp
• Data source: TradingView’s ta.requestUpAndDownVolume(lowerTf) via the official TA library.
• Plan capabilities: higher‑tier subscriptions unlock seconds‑based charts and allow more historical bars per chart. This expands both the temporal depth of LTF data and the precision of short‑horizon analysis, while base tiers provide minute‑level data suitable for day/short‑swing studies.
• Coverage clarity: a small on‑chart Coverage Panel reports the active lower timeframe, the number of bars covered, and the latest computed support/resistance ranges so you always know the bounds of valid LTF input.
Core Method
1) Data acquisition (LTF)
The script retrieves three series from the chosen lower timeframe:
– Up Volume (buyers)
– Down Volume (sellers)
– Delta (Up – Down)
2) Rolling window & extrema
Over a user‑defined lookback (Global Volume Period), the algorithm builds rolling arrays of completed bars and scans for extrema:
– Buyers_max / Buyers_min from Up Volume
– Sellers_max / Sellers_min from Down Volume
Only completed bars are considered; the current bar is excluded for stability.
3) Price mapping
The extrema are mapped back to their source candles to obtain price bounds:
– For “maximum” roles the algorithm uses the relevant candle highs.
– For “minimum” roles it uses the relevant candle lows.
These pairs define candidate resistance (max‑based) and support (min‑based) zones or vice versa.
4) Zone construction & minimum width
To ensure practicality on all symbols, zones enforce a minimum vertical thickness of two ticks. This prevents visually invisible or overly thin ranges on instruments with tight ticks.
5) Vertical role resolution
When both max‑ and min‑based zones exist, the script compares their midpoints. If, due to local price structure, the min‑based zone sits above the max‑based zone, display roles are swapped so the higher zone is labeled Resistance and the lower zone Support. Colors/widths are updated accordingly to keep the visual legend consistent.
6) Rendering & panel
Two horizontal lines and a filled box represent each active zone. The Coverage Panel (bottom‑right by default) prints:
– Lower‑timeframe in use
– Number of bars covered by LTF data
– Current Support and Resistance ranges
If the two zones overlap, an additional “Range Market” note is shown.
Key Inputs
• Global Volume Period: shared lookback window for the extrema search.
• Lower timeframe: user‑selectable override of the automatically resolved lower timeframe.
• Visualization toggles: independent show/hide controls and colors for maximum (resistance) and minimum (support) zones.
• Coverage Panel: enable/disable the single‑cell table and its readout.
Operational Notes
• The algorithm aligns all lookups to completed bars (no peeking). Price references are shifted appropriately to avoid using the still‑forming bar in calculations.
• Second‑based lower timeframes improve granularity for scalping and very short‑term entries. Minute‑based lower timeframes provide broader coverage for intraday and short‑swing contexts.
• Use the Coverage Panel to confirm the true extent of available LTF history on your symbol/plan before drawing conclusions from very deep lookbacks.
Visual Walkthrough
A step‑by‑step image sequence accompanies this description. Each figure demonstrates how the indicator reads LTF volume, locates extrema, builds price‑mapped zones, and updates labels/colors when vertical order requires it.
Chart Interpretation
This chart illustrates two distinct perspectives of the Smart Money Support/Resistance — Lite indicator, each derived from different lookback horizons and lower-timeframe (LTF) resolutions.
1- Short-term view (43 bars, 10-second LTF)
Using the most recent 43 completed bars with 10-second intrabar data, the algorithm detects that both maximum and minimum volume extrema fall within a narrow range. The result is a clearly identified range market: resistance between 178.15–184.55 and support between 175.02–179.38.
The Coverage Panel (bottom-right) confirms the scope of valid input: the lower timeframe used, number of bars covered, and the resulting zones. This short-term scan highlights how the indicator adapts to limited data depth, flagging sideways structure where neither side dominates.
2 - Long-term view (120 bars, 30-second LTF)
Over a wider 120-bar lookback with higher-granularity 30-second data, broader supply and demand zones emerge.
– The long-term resistance zone captures the concentration of buyers and sellers at the upper boundary of recent price history.
– The long-term support zone anchors to the opposite side of the distribution, derived from maxima and minima of both buying and selling pressure.
These zones reflect deeper structural levels where market participants previously committed significant volume.
Combined Perspective
By aligning the short-term and long-term outputs, the chart shows how the indicator distinguishes immediate consolidation (range market) from more durable support and resistance levels derived from extended history. This dual resolution approach makes clear that support and resistance are not static lines but dynamic zones, dependent on both timeframe depth and the resolution of intrabar volume data.

RSI(7) + MACD ZoneTitle: RSI(7) + MACD Zone Combo
Description:
This indicator combines RSI (7) and MACD (12,26,9) into a single panel with a unified scale for easier analysis.
RSI (7) is plotted in white and automatically turns red when the market reaches overbought (>70) or oversold (<30) conditions.
MACD is normalized to align with the RSI scale (0–100).
A value of 50 represents MACD = 0.
Above 50 (teal) indicates positive momentum.
Below 50 (red) indicates negative momentum.
This combination allows traders to quickly identify when short-term RSI conditions align with overall momentum shifts from MACD.
How to use:
Look for potential buy opportunities when RSI is oversold (<30) and MACD is above 50 (positive momentum).
Look for potential sell opportunities when RSI is overbought (>70) and MACD is below 50 (negative momentum).
Use in conjunction with price action and risk management — not as a standalone signal.

Market Pressure Oscillator█ OVERVIEW
The Market Pressure Oscillator is an advanced technical indicator for TradingView, enabling traders to identify potential trend reversals and momentum shifts through candle-based pressure analysis and divergence detection. It combines a smoothed oscillator with moving average signals, overbought/oversold levels, and divergence visualization, enhanced by customizable gradients, dynamic band colors, and alerts for quick decision-making.
█ CONCEPT
The indicator measures buying or selling pressure based on candle body size (open-to-close difference) and direction, with optional smoothing for clarity and divergence detection between price action and the oscillator. It relies solely on candle data, offering insights into trend strength, overbought/oversold conditions, and potential reversals with a customizable visual presentation.
█ WHY USE IT?
- Divergence Detection: Identifies bullish and bearish divergences to reinforce signals, especially near overbought/oversold zones.
- Candle Pressure Analysis: Measures pressure based on candle body size, normalized to a ±100 scale.
- Signal Generation: Provides buy/sell signals via overbought/oversold crossovers, zero-line crossovers, moving average zero-line crossovers, and dynamic band color changes.
- Visual Clarity: Uses dynamic colors, gradients, and fill layers for intuitive chart analysis.
Flexibility: Extensive settings allow customization to individual trading preferences.
█ HOW IT WORKS?
- Candle Pressure Calculation: Computes candle body size as math.abs(close - open), normalized against the average body size over a lookback period (avgBody = ta.sma(body, len)). - Candle direction (bullish: +1, bearish: -1, neutral: 0) is multiplied by body weight to derive pressure.
- Cumulative Pressure: Sums pressure values over the lookback period (Lookback Length) and normalizes to ±100 relative to the maximum possible value.
- Smoothing: Optionally applies EMA (Smoothing Length) to normalized pressure.
- Moving Average: Calculates SMA (Moving Average Length) for trend confirmation (Moving Average (SMA)).
- Divergence Detection: Identifies bullish/bearish divergences by comparing price and oscillator pivot highs/lows within a specified range (Pivot Length). Divergence signals appear with a delay equal to the Pivot Length.
- Signals: Generates signals for:
Crossing oversold upward (buy) or overbought downward (sell).
Crossing the zero line by the oscillator or moving average (buy/sell).
Bullish/bearish divergences, marked with labels, enhancing signals, especially near overbought/oversold zones.
Dynamic band color changes when the moving average crosses MA overbought/oversold thresholds (green for oversold, red for overbought).
- Visualization: Plots the oscillator and moving average with dynamic colors, gradient fills, transparent bands, and labels, with customizable overbought/oversold levels.
Alerts: Built-in alerts for divergences, overbought/oversold crossovers, and zero-line crossovers (oscillator and moving average).
█ SETTINGS AND CUSTOMIZATION
- Lookback Length: Period for aggregating candle pressure (default: 14).
- Smoothing Length (EMA): EMA length for smoothing the oscillator (default: 1). Higher values smooth the signal but may reduce signal frequency; adjust overbought/oversold levels accordingly.
- Moving Average Length (SMA): SMA length for the moving average (default: 14, minval=1). Higher values make SMA a trend indicator, requiring adjusted MA overbought/oversold levels.
- Pivot Length (Left/Right): Candles for detecting pivot highs/lows in divergence calculations (default: 2, minval=1). Higher values reduce noise but add delay equal to the set value.
- Enable Divergence Detection: Enables divergence detection (default: true).
- Overbought/Oversold Levels: Thresholds for the oscillator (default: 30/-30) and moving average (default: 10/-10). For the moving average, no arrows appear; bands change color from gray to green (oversold) or red (overbought), reinforcing entry signals.
- Signal Type: Select signals to display: "None", "Overbought/Oversold", "Zero Line", "MA Zero Line", "All" (default: "Overbought/Oversold").
- Colors and Gradients: Customize colors for bullish/bearish oscillator, moving average, zero line, overbought/oversold levels, and divergence labels.
- Transparency: Adjust gradient fill transparency (default: 70, minval=0, maxval=100) and band/label transparency (default: 40, minval=0, maxval=100) for consistent visuals.
- Visualizations: Enable/disable moving average, gradients for zero/overbought/oversold levels, and gradient fills.
█ USAGE EXAMPLES
- Momentum Analysis: Observe the MPO Oscillator above 0 for bullish momentum or below 0 for bearish momentum. The SMA, being smoother, reacts slower and can confirm trend direction as a noise filter.
- Reversal Signals: Look for buy triangles when the oscillator crosses oversold upward, especially when the SMA is below the MA oversold threshold and the band turns green. Similarly, seek sell triangles when crossing overbought downward, with the SMA above the MA overbought threshold and the band turning red.
- Using Divergences: Treat bullish (green labels) and bearish (red labels) divergences as reinforcement for other signals, especially near overbought/oversold zones, indicating stronger potential trend reversals.
- Customization: Adjust lookback length, smoothing, and moving average length to specific instruments and timeframes to minimize false signals.
█ USER NOTES
Combine the indicator with tools like Fibonacci levels or pivot points to enhance accuracy.
Test different settings for lookback length, smoothing, and moving average length on your chosen instrument and timeframe to find optimal values.

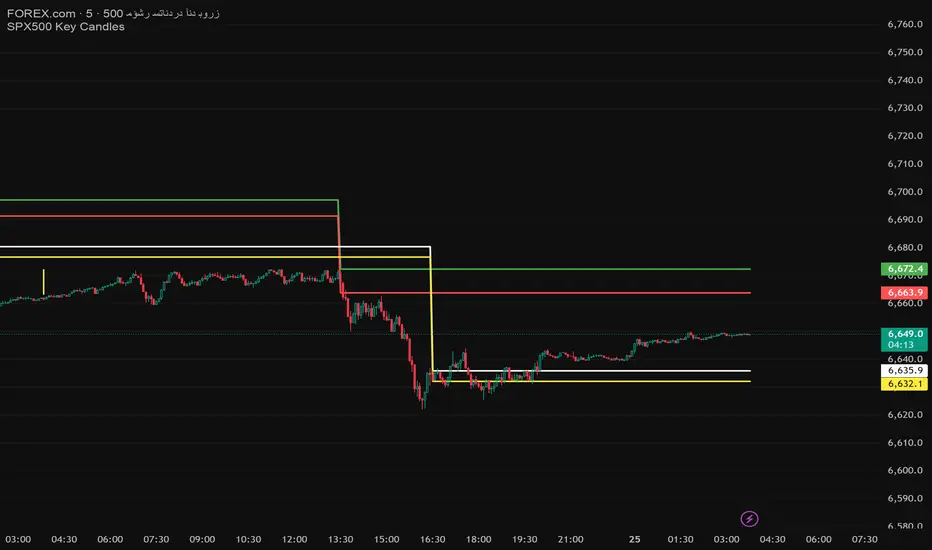
Key Levels: Open & Midday🔹 Opening Candle (9:30 AM New York Time)
Plots the high and low of the first 5-minute candle after the market opens.
🔹 12:30 PM Candle (3 hours after open)
Plots the high and low of the candle formed exactly 3 hours after the market opens.
These levels are useful for:
Identifying support/resistance zones.
Creating breakout or reversal strategies.
Tracking intraday momentum shifts.
📌 Important Notes:
Designed for 5-minute charts.
Make sure your chart is set to New York time (exchange time) for accurate levels.
Happy Trading!