Session Range and Breakout Summary
This script presents the session range and post session movements relative to that range of all the majors and crosses on a single page. You can also set it to a daily range and weekly range (beta). It will even show you the pip value of the range. I made the indicator to easily stay on top of market movements at london open relative to the Asia session range. Its very easy to see which entire currency group is breaking its asia range WHIST ITS HAPPENING. Focus on NZD in the examples as it was the market lead today - I was able to get some of it when I saw the entire group breaking its range
Showing all the majors and crosses relative to the Asia range (00:00 - 07:00 GMT)
Active 'show on chart' to verify the indicator is measuring the range correctly. Compare below to the NZD box above - you can see how NZD had control of the market this morning and all NZD pairs broke out of their ranges.
'PIP MODE' - active pip mode to see what the pip range was of the session
Notes
The information is presented RELATIVELY - this means that all the ranges and movements are scaled to be the same size. You are therefore seeing the movements relative to their ranges. When you see a breakout it relative to the size of the range - for example, if GBPJPY had a range of 50pips and breaks out of the range by 100 pip and GBPEUR has a range of 20 pips and breaks out by 40 pips they have both broken out double the range and will be displayed as the same distance.
The indicator will show the movements whilst the range is forming. I did this so I can see what the groups are doing before Europe open and be ready - such as lingering at the top end of its INCOMPLETE asia range. Be aware through that if the lines are flat at the top of the range WHILST THE RANGE IS STILL FORMING this does not mean price was flat, it means that price was pushing up and growing the range. (Price can't breakout until the range has formed at the end of the session)
The currency pairs are organised to show the strength or weakness of the selected group - this means that the base currency is always the select group. This is to present the data with currencies moving in the same direction rather than some reversed but meaning the same in relation to currency strength. In the NZD example:
NZDAUD (not AUDNZD )
NZDCAD
NZDCHF
NZDEUR (not EURNZD )
NZDGBP (not GBPNZD )
NZDJPY
NZDUSD
I hope its useful. This is the most powerful indicator I've managed to write yet. It was difficult to make the code efficient enough to fit into the pinescript limit and still do everything.
Recherche dans les scripts pour "泰国一寺庙被曝藏有40多具尸体"

HhLl-OscilatorSimple oscillator which checks how many highs and how many lows the price is making. Parameters are as explained below:
lookback - Checks how many highs and lows it is making in these many bars. Sum of all highs and lows are taken for plotting.
periods - Initial period to check high and lows
multiples - Number of multiples on initial period for which highs and lows are checked
colorCandles - CandleColor based on the oscillator
If periods is 20 and multiples is 5 and loopback is 10
Indicator checks for last 10 bars how many highs/lows are made for 20, 40, 60, 80 and 100 periods. Sum of all highs and lows are plotted on the oscillator overlay

Sniper DragonThis indicator improvement from Indicator | MCDX
I make some revise with adding rsi line and range. Also, hardcoded sensitive value to the rsi base, period etc.
Sniper Dragon created for help trader to identify smart money and momentum using RSI .
The rsi base also hard coded with sensitive rsi value that will get accurate value.
How to use this indicator:-
Histrogram Color legend
1. Green Color - Retailers
2. Yellow Color - Institution
3. Red Color - Smart Money
- the more red color in one bar is prefer for long position
- full yellow color indicate will good for mid position or short term position.
- if more green color then red and yellow indicate that the price likely going down. need to be careful here. the seller is in overpower.
- if more red color increasing, its indicate that the buyers momentum come in. A powerful buying interest.
Black Line RSI using RSI 9
- help trader to indentify current momentum.
- RSI range area already scale to fit in with the histogram.
- RSI scale range:-
- RSI 40-50 : signal overbought. standby for sell
- RSI 25-35 : indecision signal. might sideway. if before got above 35 can buy.
- RSI 0-15 : signal oversold. standby for buy
Horizontal Line Range
- red line :- indicate max range for the momentum. need to standby to sell.
- green line:- indicate lower min range for the momentum. can ready for buy if black line cross up the horizontal range.

Stock Market Strategy : VWAP, MACD, EMA, Breakout, BBHello there,
Today I bring you a stock market strategy, specialized in NASDAQ stocks.
Its a daytrading strategy, that can only do a max of 1 trade per day. In this case it only trades the first 2 opening hours of the market.
The rules are simple :
We follow the trend based on a big EMA, in this case 200, after that, we check for VWAP direction , then, we check histogram from MACD. This is the simple logic of the strategy.
Inside there is another strategy, that not just do the above, but also uses Bollinger bands, and checks for breakout of bottom or top line. Also it uses Average directional Index, for even a bigger criteria .
So for example a long condition it would be : candle is above the ema, and candle is above vwap, and histogram is positive, and candle break the top bb level and ADI < 40 -> long signal . The opposite works for short(ADI > 20).
In this case all this criterias are between the first 2 hours of market. So we enter between the first hour, and exit in the next hour. For this we need to use very short time frames.
Hope you enjoy it.
Let me know if you have any questions

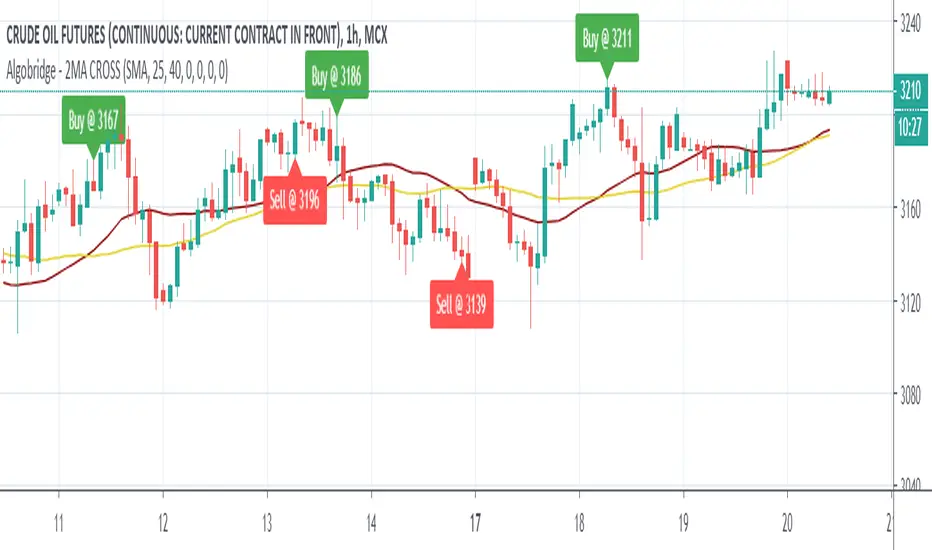
Low volatility Buy w/ TP & SL (Coinrule)The compression of volatility usually leads to expansion. When the breakout comes, it can ignite strong trends. One way to catch a coin trading in an accumulation area is to spot three moving averages with values close to each other. The strategy uses a combination of Moving Averages to spot the best time to buy a coin before its breakout.
Buy Condition
The MA200 is greater than the MA100
The MA50 is greater than the MA100
According to backtesting results, the 1-hour time frame is the best to run this strategy.
Sell Condition
Take Profit: the price increases 8% from the entry price
Stop Loss: the price drops 4% from the entry price
The strategy has a profitability of 40-60% (depending on the market conditions). Having a ratio of two between Take profit and Stop Loss helps keeping the strategy profitable in the long term.

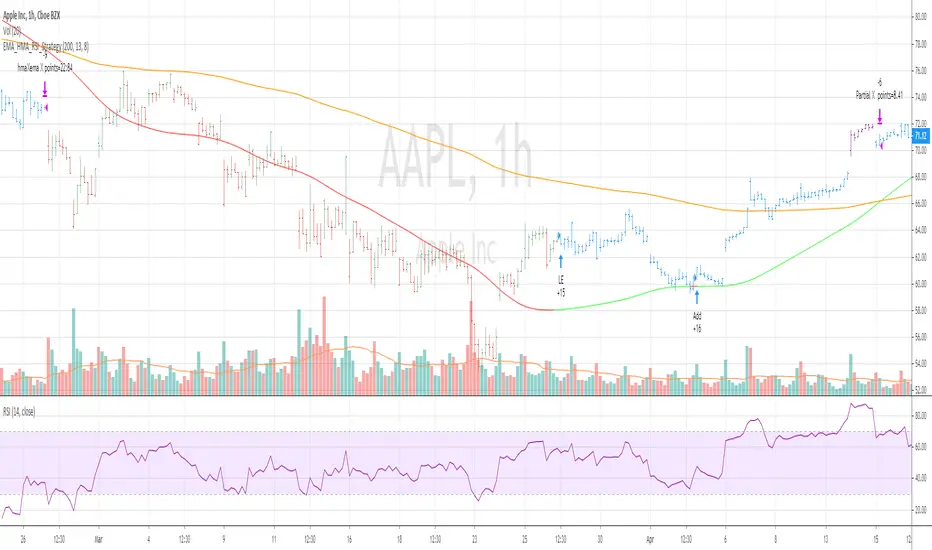
EMA_HMA_RSI_StrategyThis strategy BUYS when HMA is below EMA (default setting is 200) and HMA turning to green and RSI 13 is below 70
Adds to existing position when current price is below BUY price and RSI crossing above 30 or 40
Exits the long position when HMA crosses down EMA
when you select Take Profit setting , partial profits are taken when current price > BUY price and RSI 13 crossing down 80
Bar color changes to purple when RSI13 is above 80 (if only in Long position exists)
Tested for SPY QQQ AAPL on hourly and 30 mins chart
Warning : For educational purposes only
Session High and Session LowI have heard many people ask for a script that will identify the high and low of a specific session. So, I made one.
Important Note: This indicator has to be set up properly or you will get an error. Important things to note are the length of the range and the session definition. The idea is that you would set it up for what's relevant to your trading. Going too far back in the chart history will cause errors. Setting the session for a time that is not on the chart can cause errors. If you set it to look farther back than there are bars to display, you may get an error. What I've found is that if you get an error, you just need to change the settings to reflect available data and it will be able to compile the script. At the time of its publishing, the default range start is set to 10/01/2020. If you're looking at this years later, you'll probably have to set the range to something more recent.
Features:
Plot or Lines:
Using Plot (displayed), the indicator will track the high/low from the end of the session into the next session. Then at the start of the next session, it will start tracking the high/low of that session until its end, then track that high/low until the start of the next session then reset.
Using lines, it will extend horizontal lines to the right indefinitely. The number of sessions back that the lines apply to is a user-defined number of sessions. There are limits to the number of lines that can be cast on a chart (roughly 40-50). So, the maximum number of sessions you can apply the lines to is the last 21 sessions (42 lines total). That gets really noisy though so I can't imagine that is a limiting factor.
Colors:
You can change the background color and its transparency, as well as turn the background color on or off.
You can change the highs and lows colors
You can adjust the line width to your preference
Session Length:
You can use a continuous session covering any user-defined period (provided its not tooooo many candles back)
You can define the session length for intraday
You can exclude weekends
Display Options:
You can adjust the colors, transparency, and linewidth
You can display the plotline or horizontal lines
You can show/hide the background color.
You can change how many sessions back the horizontal lines will track
Let me know if there's anything this script is missing or if you run into any issues that I might be able to help resolve.
Here's what it looks like with Lines for the last 5 sessions and different background color.

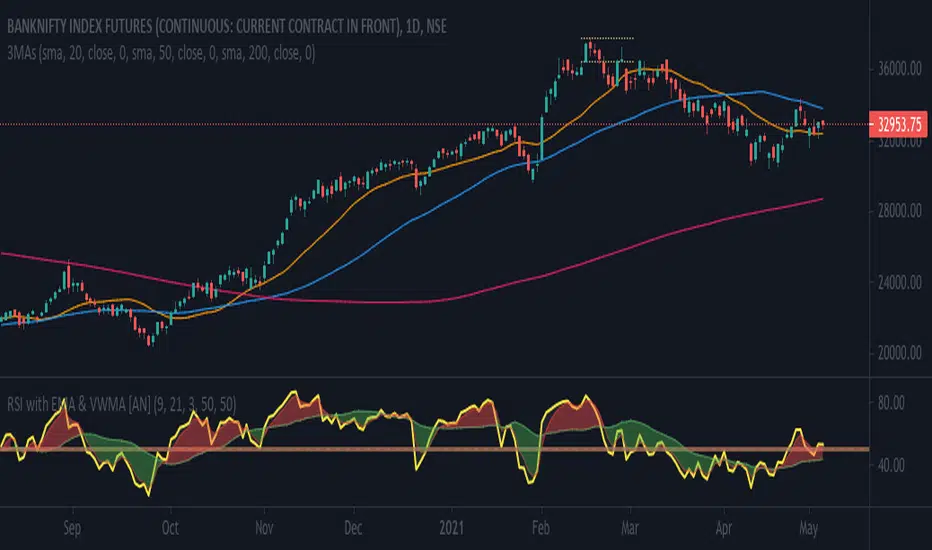
RSI with WMA & EMA [AN]Key Factors traced
- Price: EMA (Exponential Moving Average)
- Volume: WMA (Weighted Moving Avg.)
- Strength (Momentum): RSI (Relative Strength Indicator)
Default parameters
1. RSI at 9. Over brought & Under sold to 50 to be used as a median. This can be altered to the traditional 70:30 or 60:40
2. WMA at 21
3. EMA at 3, Exponential for Intraday trades
[blackcat] L1 Close Histogram OscillatorLevel: 1
Background
A histogram is a special chart that is applied to statistical data that is divided into numerically ordered groups. For example groups with close relationships in the vicinity like "Close-ref(Close ,1)", "Close-ref(Close,2)" and so on. A histogram provides a snapshot of all the data so that you can quickly get an overview of the historical data, especially its general shape.In a histogram, the bars are linked - in contrast to a bar chart for categorical data, in which the bars represent categories that are in no particular order and are separated. The height of each bar in a histogram indicates either the number of individuals (called the frequency) in each group or the percentage of individuals (the relative frequency) in each group. Each individual in the data set falls into exactly one bar.
Function
L2 Close Histogram Oscillator is a novel overbought and oversold indicator that estimate the trend state by counting a specific bar relationship nearby. Once nearby bars reach consensus, it may spread to global quickly. The reason why I got this inspiration is because I have been engaged in the research of blockchain consensus mechanism. The market is a complex system, and its consensus depends on the common human characteristics: greed and fear. The trend of the market often also conforms to sociological characteristics. Maybe it's a bit complicated for me to say that. However, if you understand the principle of the spread of rumors and viruses, you can understand the situation where some individuals in the market have local consensus and gradually spread to the overall situation. This is the process of trend formation.
Key Signal
fastcounter --> fast close histogram counters
slowcounter --> slow close histogram counters
attention --> bottom price appears, with height of 10 in white
readybuy --> a small position buy opportunity after first bottom detected, with height of 20 in yellow
buylow --> a small position buy at low price, with height of 30 in lime
longentry --> a confirmed long entry signal by close histogram counter, with height of 40 in green
risk --> oscillator top is reached and trend reversal may happen, with height drop from 100 to 80 in red
Pros and Cons
Pros:
1. since this is based on consensus formation principle, i think this is a leading indicator by spreading local consensus to global
2. it is an oscillator, overbought and oversold can be easily observed.
Cons:
1. the model is not complex enough to depict market behavior exactly.
2. sideways and chop market will make this indicator's output hard to read.
Remarks
This is rare! I combined my previous theory of developing cellular automata with the market to produce such a weird indicator. I hope to inspire everyone and study market behavior in a deeper level.
Readme
In real life, I am a prolific inventor. I have successfully applied for more than 60 international and regional patents in the past 12 years. But in the past two years or so, I have tried to transfer my creativity to the development of trading strategies. Tradingview is the ideal platform for me. I am selecting and contributing some of the hundreds of scripts to publish in Tradingview community. Welcome everyone to interact with me to discuss these interesting pine scripts.
The scripts posted are categorized into 5 levels according to my efforts or manhours put into these works.
Level 1 : interesting script snippets or distinctive improvement from classic indicators or strategy. Level 1 scripts can usually appear in more complex indicators as a function module or element.
Level 2 : composite indicator/strategy. By selecting or combining several independent or dependent functions or sub indicators in proper way, the composite script exhibits a resonance phenomenon which can filter out noise or fake trading signal to enhance trading confidence level.
Level 3 : comprehensive indicator/strategy. They are simple trading systems based on my strategies. They are commonly containing several or all of entry signal, close signal, stop loss, take profit, re-entry, risk management, and position sizing techniques. Even some interesting fundamental and mass psychological aspects are incorporated.
Level 4 : script snippets or functions that do not disclose source code. Interesting element that can reveal market laws and work as raw material for indicators and strategies. If you find Level 1~2 scripts are helpful, Level 4 is a private version that took me far more efforts to develop.
Level 5 : indicator/strategy that do not disclose source code. private version of Level 3 script with my accumulated script processing skills or a large number of custom functions. I had a private function library built in past two years. Level 5 scripts use many of them to achieve private trading strategy.

GMS: Mr. Yen's Color ZoneThis is Mr. Yen's color zone. I have also added an input to adjust the sizes of each box. Mainly targeted for MES and ES.
The default settings are as he describes:
white line is the previous day close
red zone = +/- 20 from the previous day close
yellow zone = +/- 40 from the previous day close
green zone = +/- 60 from the previous day close
blue zone = +/- 100 from the previous day close
The source code is open, so feel free to take a look and see whats up. This indicator is quite similar to his, however there is a gap at the cash close to overnight open on his chart that I'm not sure how to adjust for. In any case, this one is still pretty good!
I hope it helps,
Andre

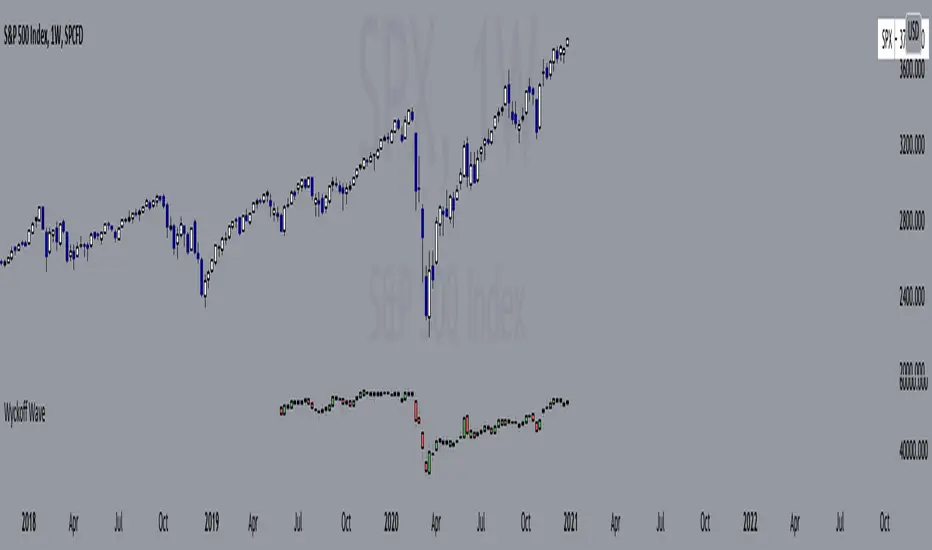
Wyckoff Wave"The Wyckoff Wave is a weighted index consisting of 12 stocks that are leaders in their perspective industries. It was introduced by the Stock Market Institute in 1931.
Made up of leaders in the important stock groups, the Wyckoff Wave represents the core of the American industrial complex.
The Wyckoff Wave has been a market indicator for Wyckoff students for over 50 years. While the stocks comprising the Wyckoff Wave have changed over time, it continues to be a sensitive leading market indicator. The Wyckoff Wave has consistently identified market trends.
The Wyckoff Wave is extremely helpful in predicting the stock market’s timing and the direction of the next market move.
The Wyckoff Wave is analyzed in five minute intervals and individual up and down iintra-day waves are created.
These individual waves, which include the price action and volume during those brief up and down market swings, also provide the data for other important Wyckoff Stock Market Institute indicators, including the Optimism-Pessimism volume index and the Trend Barometer.
These 12 stocks that make up the Wyckoff Wave. They are listed, along with their multipliers, below."
Wave Stock / Multiplier
AT&T / 79
Bank of America / 50
Boeing / 39
Bristol Myers / 119
Caterpillar / 35
DowDuPont / 72
Exxon Mobile / 32
IBM / 21
General Electric / 90
Ford / 25
Union Pacific / 60
WalMart / 43
In 2019, DowDuPont split into three companies: Dow, DuPont, and Corteva. Because TV limits the number of securities in a script to 40, only Dow and DuPont are factored into the Wave calculation (higher market caps than Corteva) with a multiplier of 36 each.
ADX with Color like MACD HistogramThis is a usual ADX Indicator but the colors change when the next bar falls or grows from the previous bar.
I think that the use of ADX can be maximized by seeing whether the movement is lower or higher than the previous like MACD Histogram.
The ADX indicator is very powerful for driving long-term trends and is effectively used for 4-hour or 1-hour Time Frames.
When ADX is above level 20, the color of the Bar will be blue or light blue. The blue bar means that the bar is higher than the previous bar. The light blue bar means the bar is lower than the previous one.
When ADX is below level 20, the color of the bar will be dark gray or light gray. The dark gray bar means that the bar is lower than the previous bar. The light gray bar means the bar is higher than the previous bar.
When the bar turns blue that's when we can add shares to our winning position.
When the price is above level 40, the background of the bars will be red, indicating that the price is in a very strong trend and will run out of its thrust soon. That's when we get ready to take profit, which is when the ADX Bar which is blue turns light blue.
-
FYI, I use ADX just for adding the shares to my winning position and exiting the market. I don't wait for ADX turns blue to enter the market.

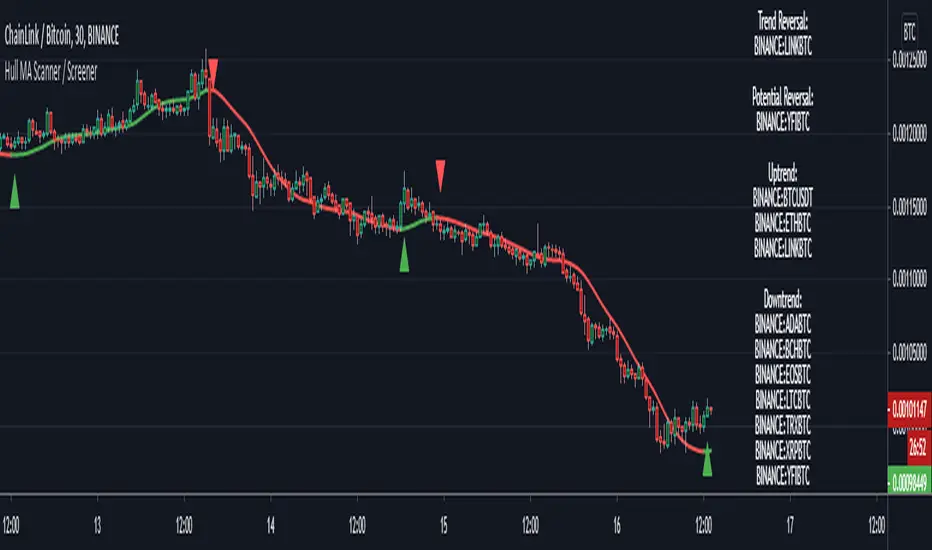
Hull MA Scanner / Screener LabelThis screens for Hull MA trend reversal's in 10 different securities. If the label color is not visible due to the text in it being white colored, then choose a different color from settings. Also added a simple HullMA to it. If want can increase it upto 40 securities in the code which is upto user to decide.
This was requested by soderstromkenan in comments and looked like a nice idea so decided to make it.
The Hull MA logic is from "Hull50" by u/RafaelZioni with his permission. Screener logic from u/Quantnomad with his permission.
SHARP PIVOTS (INTRADAY LEVELS) Hi friends,,
This indicator is based on modified fib levels.
Buy above 23.7% from recent low and sell below 72.7% from recent high.
15 mins close above or below the entry levels Recommended.
use Heiken Ashi candles for trend confirmation.
USE RSI 60/40(UNCONVENTIONAL) For additional conformation

21/55 EMA Cloud w/ Optional RibbonThis indicator behaves like a traditional EMA ribbon by using the 21, 25, 30, 35, 40, 45, 50, and 55 bar exponential moving averages. In this particular indicator, the traditional EMA ribbon lines are turned off by default leaving only a filled in area between the 21 and 55 bar averages. The filled in area is green when the 21 bar average is greater than the 55 and red otherwise. Additionally, the 9, 100, and 200 exponential moving averages are available for reference.

MA_CROSSOVER with SL & TPThis is the Moving Average Script Including the Stoploss and Target Levels. By Default it is working on 25 & 40 Parameters but it can change accordingly.
Volume Color Bars with SMA MACD & Linear RegressionVolume Bars colored to make it easy to read with Volume Spread Analysis Indicator.
1. Red - Volume less than Simple Moving Average
2. Blue - Volume higher than Simple Moving Average
3. Black - Maximum volume of last Max_Count bar (default = 40 bars)
Additionally, you can plot Moving Average, Linear Regression and MACD of volume.

Custom Screener with Alerts [QuantNomad]Some time ago I published an example of simple custom screener in PineScript:
The only thing this screener did is created a dynamic label with screener output.
Recently TradingView announced alerts from the strategy with the possibility to add custom messages to alerts.
So using it I was able to create a bit more advanced screener which sends results as alert messages. With tools like Alertatron, you can easily redirect them to Telegram if you want.
It works for 40 symbols (limitation of the number of security calls).
To create your own screener you need to change only screenerFunc. The logic of this function is very simple, it outputs value you want to display in screener and condition based on which your screener should filter your stocks.
To create alerts for this screener create an alert from strategy and use {{strategy.order.alert_message}} as alert message.
Do you know now how to make this screener better? Let me know.
Disclaimer
Please remember that past performance may not be indicative of future results.
Due to various factors, including changing market conditions, the strategy may no longer perform as good as in historical backtesting.
This post and the script don’t provide any financial advice.

Two Take Profits and Two Stop LossThis script is for research purposes only. I am not a financial advisor.
Entry Condition
This strategy is based on two take profit targets, two stop loss, and scaling out strategy. The entry rule is very simple. Whenever the EMA crossover WMA, the long trade is taken and vice versa.
Take Profit and Stop Loss
The first take profit is set at 20 pips above the long entry and the second take profit is set at 40 pips above the long entry. Meanwhile, the first stop loss is set at 20 pips below the long entry and the second stop loss is set at the long entry.
Money Management
When the first take profit is achieved, half of the position is closed and the first stop loss is moved to the entry-level. The rest of the position is open to achieve either second take profit or second stop loss.
There are three outcomes when using this strategy. Let's say you enter the trade with 200 lot size and you are risking 2% of your equity.
1. The first outcome is when the price hits stop loss, you lose the entire 2%.
2. The second outcome is when the price hits the first take profit and you close half of your position. Meaning that you have gained 1%. Then you let the trade running and eventually it hits the second stop loss. Remember your first stop loss has changed to the second stop loss when the first take profit is achieved. The total loss is 0% because the price is at your entry-level. You have gained the earlier 1% and then lost 0%. At this point, you are at 1% gained.
3. The third outcome is similar to the second out but instead of hitting the second stop loss, the trade is running to your favor and hits the second take profit.
Therefore, you gained 1% from the first take profit and you gained another 2% for the second take profit. Your total gained is 3%
Summary
The reason behind this strategy is to minimize risk. with normal strategy, you only have two outcomes which are either win or loss. With this strategy, you have three outcomes which win 3%, win 1%, or loss 2%.
This is my similar strategy but with single stop loss

Two Take Profit StrategyThis script is for research purposes only. I am not a financial advisor.
Entry Condition
This strategy is based on two take profit targets and scaling out strategy. The entry rule is very simple. Whenever the EMA crossover WMA, the long trade is taken and vice versa.
Take Profit and Stop Loss
The first take profit is set at 20 pips above the long entry and the second take profit is set at 40 pips above the long entry. Meanwhile, the stop loss is set at 20 pips below the long entry.
Money Management
When the first take profit is achieved, half of the position is closed. The rest of the position is open to achieve either second take profit or stop loss.
There are three outcomes when using this strategy. Let's say you enter the trade with 200 lot size and you are risking 2% of your equity.
1. The first outcome is when the price hits stop loss, you lose the entire 2%.
2. The second outcome is when the price hits the first take profit and you close half of your position. Meaning that you have gained 1%. Then you let the trade running and eventually it hits stop loss. The total loss is 0% because the remaining lot size which is 200/2=100 times by 20pips is 1%. You have gained the earlier 1% and then loss 1%. At this point, you are at break even.
3. The third outcome is similar to the second out but instead of hiring stop loss, the trade is running to your favor and hits the second take profit.
Therefore, you gained 1% from the first take profit and you gained another 2% for the second take profit. Your total gained is 3%
Summary
The reason behind this strategy is to minimize risk. with normal strategy, you only have two outcomes which are either win or loss. With this strategy, you have three outcomes which are win, loss or break even.

Probability: Bull/Bear Dominance | Ratio | Bar CountIntro
What's the probability of the next bar being red? How about green? Well, there are many ways to quantify the probability but I am presenting just one stupidly simple (but generally accurate) way to measure it.
Strangely... no one has done this before that I can find. I try to check if someone else has done it first (Pro Tip: Plz do this. We honestly don't need the 5 trillionth "MTF MAs" script.)
Indicator
Its a basic counting script, but the nice thing about this script is you choose the time range. It starts counting from a specified point of your choosing. It counts up the bull bars and bear bars separately.
Bull Bar = Close > Open
Bear Bar = Open > Close
You can look at them in sum or as a ratio of Green Bars : Red Bars
I know, it's almost too simple. But, here's some interesting food for thought from a layman to fellow laymen.
Analysis/Edge
Between the time of candle open and candle close, the price can do one of three things, close higher, close lower, or close equal to.
'Equal to' is rare on higher timeframes in liquid markets and it provides no useful information. Thus, we'll nix it for purposes of this conversation.
So boil it down. The next candle is going to be a red candle or a green candle.
It is popular to refer to the general probability of most candles as 50/50, with trader's mission in life being to seek an edge that tilts the probabilities slightly in their favor.
The truth is the odds are probably never actually 50/50, but knowing the precisely correct probability is unknowable, just like the accuracy of a weather forecast is inherently unknowable. What we're trying to do as traders is develop systems that give us predictive probabilistic outcomes that correspond with future realities based on various ways of measuring the market (most often heavily dependent on the past).
The reality is that the market can be measured in many, many different ways. The important thing is that you measure it in a way that is accurate, relevant, and universally applicable.
So look at this indicator here:
You start from a point in time on a chosen timeframe and you put red bars in the red column, green in the green column, and count them all up.
Then you make a ratio, in this case, Green : Red.
What the ratio shows you is the percentage of green bars compared to red bars . At the time of this screenshot, the 4h on the SPX starting from the 2020 bottom is showing a ratio of 1.2.
This means there have been 20% more green bars than there have been red bars.
Now there are 1,000 directions you can take this discussion. What is the overall volatility picture, the size of the red bars vs the green bars, what happens if you miss out on the 5 biggest green bars... so many more variables that you would need to take into account to develop a true edge from this idea. But, the bottom line fact (which is what I like about this) is that we can take this data and say with a certain level of confidence that on the SPX you have a 20% better shot at making money (otherwise stated there's a 60/40 chance) if you open a LONG trade at the beginning of a 4h candle than if you open a short.
That's useful information. One could argue that it's not a complete strategy in and of itself (although I bet it could be with a couple of additional parameters). But I can tell you, based on the 4h candles in the 2020 rally if you open a short, the deck is stacked against you from this perspective. And we can actually somewhat demonstrate this to be true for our dataset because we can look at the price history and see who likely made more money. The SPX is up 1000pts off the bottom. So, thus far, for this dataset, it rings true; Bulls have been doing way better in the latter part of 2020 than the bears.
Conclusion
Predictive systems with a small number of variables tend to be more robust than a system with many variables when applied to a complex system. I may keep updating this script if people like it and determine aspects like population vs sample size, confidence intervals, volatility, and exclusion of outliers. For now, this is just an opening foray into the basic idea of how we can establish an edge in the markets. It really can be this simple.
Thanks for Reading.

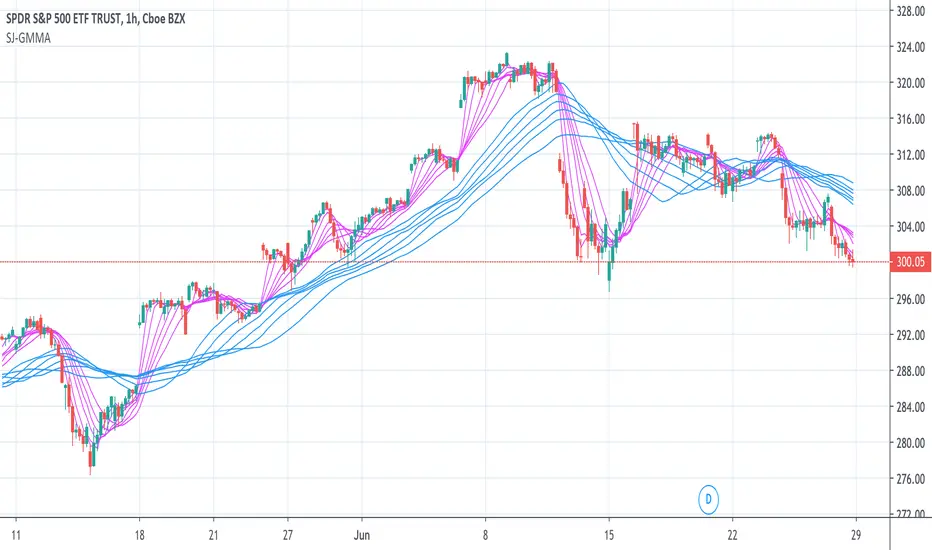
JSun - Guppy Multiple Moving AverAgeThe Guppy Multiple Moving Average (GMMA) is a technical indicator that identifies changing trends, breakouts, and trading opportunities in the price of an asset by combining two groups of moving averages (MA) with different time periods. There is a short-term group of MAs, and a long-term group of MA. Both contain six MAs, for a total of 12. The term gets its name from Daryl Guppy, an Australian trader who is credited with its development.
Key Takeaways:
1. The Gruppy Multiple Moving Average (GMMA) is applied as an overlay on the price chart of an asset.
2. The short-term MAs are typically set at 3, 5, 8, 10, 12, and 15 periods. The longer-term MAs are typically set at 30, 35, 40, 45, 50, and 60.
3. When the short-term group of averages moves above the longer-term group, it indicates a price uptrend in the asset could be emerging.
4. When the short-term group falls below the longer-term group of MAs, a price downtrend in the asset could be starting.
5. When there is lots of separation between the MAs, this helps confirm the price trend in the current direction.
6. If both groups become compressed with each other, or crisscross, it indicates the price has paused and a price trend reversal is possible.
7. Traders often trade in the direction the longer-term MA group is moving, and use the short-term group for trade signals to enter or exit.
多重平均线(Multi Moving Average)This is a Multi Moving Average indicator which redesign and translate for Chinese.
这是一个多重平均线(Multi Moving Average)指标。
本脚本的目的在于帮助使用中文的人了解该指标,特别是其用法。同时将该指标代码添加完整的中文注释,方便使用中文的人学习Pine语言。
平均线是最常用的技术分析方法之一。
本指标的特色
相对于官方提供的平均线,本版本平均线指标有两点特色:
1 可以在图表上一次显示多条(最多6条)移动平均线;
2 支持包括SMA、EMA、WMA、HMA、VWMA、RMA等多种平均线,可以根据自己的需求选择相应的平均线。
*注释
SMA:简单移动平均线
EMA:指数加权移动平均线
WMA:加权移动平均线
HMA:船体移动平均线
VWMA:成交量加权移动平均线
RMA:RSI指标中使用的移动平均线,也叫指数加权移动平均线
指标可调节参数
该指标有六个可设置的参数
1 MA1:默认为5;
2 MA2:默认为13;
3 MA3:默认为20;
4 MA4:默认为40;
5 MA5:默认为80;
6 MA6:默认为160。
本指标还有两项可选设置项
1 价格源:价格源默认使用收盘价,但是你还可以选择使用开盘价、最高价、最低价等其他的价格计算方式;
2 选择使用的MA类型;
