Simple Moving Averages (5, 10, 20, 60, 120, 200SMA for different time frames.
Covers 5, 10, 20, 60, 120, 200 sma units
Recherche dans les scripts pour "股价站上60月线"
MA 5-10-30-60-90-120 by MMCThis indicator only plots 6 moving average lines:
MA 5, MA 10, MA 30, MA 60, MA 90, MA 120
No ribbon, no fill, no clouds, no arrows, no alerts — completely clean and minimal.
Lines are thin (linewidth = 2) but colors are very bright/neon so they pop even on dark charts.
Two inputs:
MA Type → EMA (default, faster) or SMA (smoother but lags more)
Color Theme → 3 preset themes:
Canlı Kontrast → brightest and most visible (red-orange-yellow-green-blue-purple)
Gökkuşağı → classic rainbow order
Kırmızı-Yeşil → red/orange tones for short-term, green tones for long-term
Change the theme and colors update instantly.


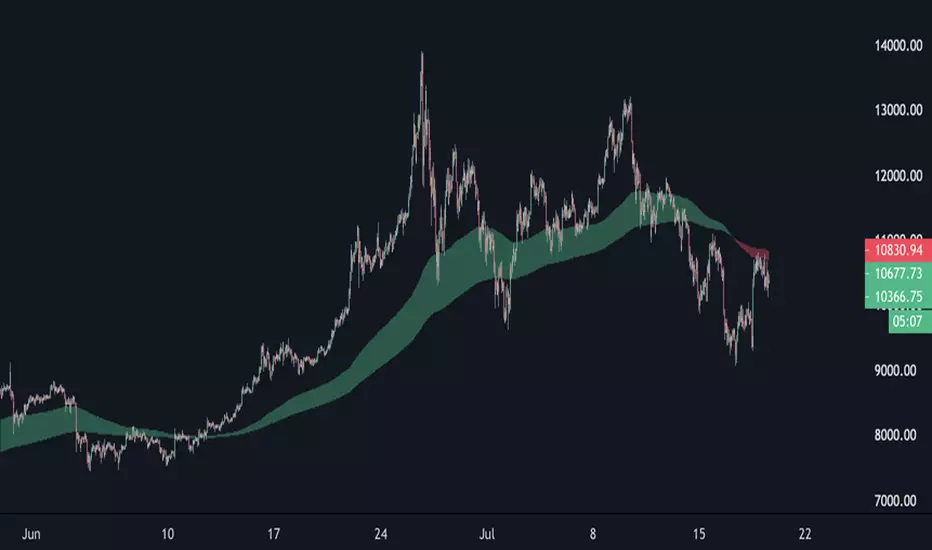
EMA Cloud 9/30/60 – Visual Trend Strength - CryptowitchThis indicator displays three Exponential Moving Averages (EMAs):
🔸 EMA 9 (short-term)
🔸 EMA 30 (mid-term)
🔸 EMA 60 (long-term)
A dynamic cloud is drawn between EMA 9 and EMA 30 to visually highlight trend momentum:
Green cloud = bullish momentum (EMA 9 above EMA 30)
Red cloud = bearish momentum (EMA 9 below EMA 30)
This cloud setup helps quickly identify trend direction, momentum shifts, consolidation zones, and potential entry/exit points.
Clean, visual, and effective – suitable for scalpers, swing traders, and trend followers alike.


Emre AOI Zonen Daily & Weekly (mit Alerts, max 60 Pips)This TradingView indicator automatically highlights Areas of Interest (AOI) for Forex or other markets on Daily and Weekly timeframes. It identifies zones based on the high and low of the previous period, but only includes zones with a width of 60 pips or less.
Features:
Daily AOI Zones in blue, Weekly AOI Zones in yellow with 20% opacity, so candlesticks remain visible.
Persistent zones: AOI boxes stay on the chart until the price breaks the zone.
Multiple zones: Supports storing multiple Daily and Weekly AOIs simultaneously.
Break Alerts: Sends alerts whenever a Daily or Weekly AOI is broken, helping traders spot key levels in real-time.
Fully automated: No manual drawing needed; zones are updated and extended automatically.
Use Case:
Ideal for traders using a top-down approach, combining Weekly trend analysis with Daily entry signals. Helps identify support/resistance, supply/demand zones, and critical price levels efficiently.

EMA band 12/60/150/200EMA band consisting of 12/60/150/200
Specifically for Indian stock market, can be used for other trading scripts after testing.
Best use case : on Daily TF.
Bull run entry criteria, Not bear market or Bottom catching.

15-Minute and 60-Minute ORB with Wicks15 and 60 minute ORBs for each trading day. Simple, yet effective.


EMA (10,20,60) + Bollinger BandsCombination of bollinger bands and exponential moving averages (10, 20, 60)
The coloring is optimized for dark background, and it is editable
This indicator combined 3 exponential moving average lines and bollinger bands . The EMA lines can be add or deleted in pine editor, and its parameters can be changed too. Same to the bollinger bands . Defaulted value for BB is 20SMA with 2 standard deviations.
Useful as a supplmentary indicators

EMA30,60,100 EMA 30 (orange),60(red),100(green)
Bullish: green below the other two
Bearish: green above other two
when lines cross, no clear trend.
When Price touches the orange = entry point
Thanks to CFXtrader for the basic script


[STRATEGY]EMA 30/60 Cross Strategystrategy based on EMA 30/60 cross
works best on 4hr timeframes & high-midcaps


120/60 Trend ModelCombination of 120 & 60 EMAs used to determine entries as well as the over all trend.
Guppy MMA 3, 5, 8, 10, 12, 15 and 30, 35, 40, 45, 50, 60Guppy Multiple Moving Average
Short Term EMA 3, 5, 8, 10, 12, 15
Long Term EMA 30, 35, 40, 45, 50, 60
Use for SFTS Class

Sideways & Breakout Detector + Forecast//@version=6
indicator("Sideways & Breakout Detector + Forecast", overlay=true, max_labels_count=500)
// Inputs
lengthATR = input.int(20, "ATR Länge")
lengthMA = input.int(50, "Trend MA Länge")
sqFactor = input.float(1.2, "Seitwärtsfaktor")
brkFactor = input.float(1.5, "Breakoutfaktor")
// ATR / Volatilität
atr = ta.atr(lengthATR)
atrSMA = ta.sma(atr, lengthATR)
// Basislinie / Trend
basis = ta.sma(close, lengthATR)
trendMA = ta.sma(close, lengthMA)
// Seitwärtsbedingung
isSideways = atr < atrSMA * sqFactor
// Breakouts
upperBreak = close > basis + atr * brkFactor
lowerBreak = close < basis - atr * brkFactor
// Vorhergesagter Ausbruch (Forecast)
// Wenn Seitwärtsphase + Kurs nahe obere oder untere Kanalgrenze
forecastBull = isSideways and (close > basis + 0.5 * atr)
forecastBear = isSideways and (close < basis - 0.5 * atr)
// Farben
barcolor(isSideways ? color.new(color.yellow, 40) : na)
barcolor(upperBreak ? color.green : na)
barcolor(lowerBreak ? color.red : na)
// Breakout-Bänder
plot(basis + atr * brkFactor, "Bull Break Zone", color=color.new(color.green, 60))
plot(basis - atr * brkFactor, "Bear Break Zone", color=color.new(color.red, 60))
// Labels (klein)
if isSideways
label.new(bar_index, close, "Seitwärts", color=color.yellow, style=label.style_label_center, size=size.tiny)
if upperBreak
label.new(bar_index, high, "Bull Breakout", color=color.green, style=label.style_label_up, size=size.tiny)
if lowerBreak
label.new(bar_index, low, "Bear Breakout", color=color.red, style=label.style_label_down, size=size.tiny)
// Vorhergesagte Ausbrüche markieren
plotshape(forecastBull, title="Forecast Bull", location=location.abovebar, color=color.new(color.green, 0), style=shape.triangleup, size=size.tiny)
plotshape(forecastBear, title="Forecast Bear", location=location.belowbar, color=color.new(color.red, 0), style=shape.triangledown, size=size.tiny)
// Alerts
alertcondition(isSideways, "Seitwärtsphase", "Der Markt läuft seitwärts.")
alertcondition(upperBreak, "Bull Breakout", "Ausbruch nach oben!")
alertcondition(lowerBreak, "Bear Breakout", "Ausbruch nach unten!")
alertcondition(forecastBull, "Forecast Bull", "Voraussichtlicher Bull-Ausbruch!")
alertcondition(forecastBear, "Forecast Bear", "Voraussichtlicher Bear-Ausbruch!")

Stratégie SMC V18.2 (BTC/EUR FINAL R3 - Tendance)This strategy is an automated implementation of Smart Money Concepts (SMC), designed to operate on the Bitcoin/Euro (BTC/EUR) chart using the 15-minute Timeframe (M15).It focuses on identifying high-probability zones (Order Blocks) after a confirmed Break of Structure (BOS) and a Liquidity Sweep, utilizing an H1/EMA 200 trend filter to only execute trades in the direction of the dominant market flow.Risk management is strict: every trade uses a fixed Risk-to-Reward Ratio (R:R) of 1:3.🧱 Core Logic Components
1. Trend Filter (H1/EMA 200)Objective: To avoid counter-trend entries, which has allowed the success rate to increase to nearly $65\%$ in backtests.Mechanism: A $200$-period EMA is plotted on a higher timeframe (Default: H1/60 minutes).Long (Buy): Entry is only permitted if the current price (M15) is above the trend EMA.Short (Sell): Entry is only permitted if the current price (M15) is below the trend EMA.
2. Order Block (OB) DetectionA potential Order Block is identified on the previous candle if it is
accompanied by an inefficiency (FVG - Fair Value Gap).
3. Advanced SMC ValidationBOS (Break of Structure): A recent BOS must be confirmed by breaking the swing high/low defined by the swing length (Default: 4 M15 candles).Liquidity (Liquidity Sweep): The Order Block zone must have swept recent liquidity (defined by the Liquidity Search Length) within a certain tolerance (Default: $0.1\%$).Point of Interest: The OB must form in a premium zone (for shorts) or a discount zone (for longs) relative to the current swing range (above or below the $50\%$ level of the range).
4. Execution and Risk ManagementEntry: The trade is triggered when the price touches the active Order Block (mitigation).Stop Loss (SL): The SL is fixed at the low of the OB (for longs) or the high of the OB (for shorts).Take Profit (TP): The TP is strictly set at a level corresponding to 3 times the SL distance (R:R 1:3).Lot Sizing: The trade quantity is calculated to risk a fixed amount (Default: 2.00 Euros) per transaction, capped by a Lot Max and Lot Min defined by the user.
Input Parameters (Optimized for BTC/EUR M15)Users can adjust these parameters to modify sensitivity and risk profile. The default values are those optimized for the high-performing backtest (Profit Factor $> 3$).ParameterDescriptionDefault Value (M15)Long. Swing (BOS)Candle length used to define the swing (and thus the BOS).4Long. Recherche Liq.Number of candles to scan to confirm a liquidity sweep.7Tolérance Liq. (%)Price tolerance to validate the liquidity sweep (as a percentage of price).0.1Timeframe TendanceChart timeframe used for the EMA filter (e.g., 60 = H1).60 (H1)Longueur EMA TendancePeriods used for the trend EMA.200Lot Max (Quantité Max BTC)Maximum quantity of BTC the strategy is allowed to trade.0.01Lot Min Réel (Exigence Broker)Minimum quantity required by the broker/exchange.0.00001
