McClellan Oscillator for DAX (GER30) [aftabmk modified]About McClellan Oscillator
Developed by Sherman and Marian McClellan, the McClellan Oscillator is a breadth indicator derived from Net Advances, the number of advancing issues less the number of declining issues. Subtracting the 39-day exponential moving average of Net Advances from the 19-day exponential moving average of Net Advances forms the oscillator.
As the formula reveals, the McClellan Oscillator is a momentum indicator that works similar to MACD .
McClellan Oscillator signals can be generated with breadth thrusts, centerline crossovers, overall levels and divergences.
About my version
This version here is a modification, though:
- It can only be used on the DAX index (DAX 30 or GER 30)
- It only considers the DAX 30 stocks
- The data window will provide a summary about rising and declining stocks
- The data window will output the last change for each of the 30 stocks
BUG
I am only publishing this version because I am not sure if my current version is saved when I leave tradingview.com without publishing the script.
This version still contains a bug - the if/else clauses do not correctly recognize declining stocks. So the oscillator should not be used as it is.
Working on it these days. Feel free to provide feedback!
Stuff I am working on
- Coloring the area green/red according to the value
- Fixing this bug/making this script more efficient
DISCLAIMER
This script was mainly written for educational purposes (training myself how to write custom indicatotors).
As you can see, the code is really messy.
Credits
Based on the simple version of aftabmk
You can find the original version by searching for McClellan Oscillator for nifty 50.
Recherche dans les scripts pour "重庆30天天气预报"

Gann RetracementThe indicator is based on W. D. Gann's method of retracement studies. Gann looked at stock retracement action in terms of Halves (1/2), Thirds (1/3, 2/3), Fifths (1/5, 2/5, 3/5, and 4/5) and more importantly the Eighths (1/8, 2/8, 3/8, 4/8, 5/8, 6/8, and 7/8). Needless to say, {2, 3, 5, 8} are the only Fibonacci numbers between 1 to 10. These ratios can easily be visualized in the form of division of a Circle as follows :
Divide the circle in 12 equal parts of 30 degree each to produce the Thirds :
30 x 4 = 120 is 1/3 of 360
30 x 8 = 240 is 2/3 of 360
The 30 degree retracement captures fundamental geometric shapes like a regular Triangle (120-240-360), a Square (90-180-270-360), and a regular Hexagon (60-120-180-240-300-360) inscribed inside of the circle.
Now, divide the circle in 10 equal parts of 36 degree each to produce the Fifths :
36 x 2 = 72 is 1/5 of 360
36 x 4 = 144 is 2/5 of 360
36 x 6 = 216 is 3/5 of 360
36 x 8 = 288 is 4/5 of 360
where, (72-144-216-288-360) is a regular Pentagon.
Finally, divide the circle in 8 equal parts of 45 degree each to produce the Eighths :
45 x 1 = 45 is 1/8 of 360
45 x 2 = 90 is 2/8 of 360
45 x 3 = 135 is 3/8 of 360
45 x 4 = 180 is 4/8 of 360
45 x 5 = 225 is 5/8 of 360
45 x 6 = 270 is 6/8 of 360
45 x 7 = 315 is 7/8 of 360
where, (45-90-135-180-225-270-315-360) is a regular Octagon.
How to Use this indicator ?
The indicator generates Gann retracement levels between any two significant price points, such as a high and a low.
Input :
Swing High (significant high price point, such as a top)
Swing Low (significant low price point, such as a bottom)
Degree (degree of retracement)
Output :
Gann retracement levels (color coded as follows) :
Swing High and Swing Low (BLUE)
50% retracement (ORANGE)
Retracements between Swing Low and 50% level (RED)
Retracements between 50% level and Swing High (LIME)

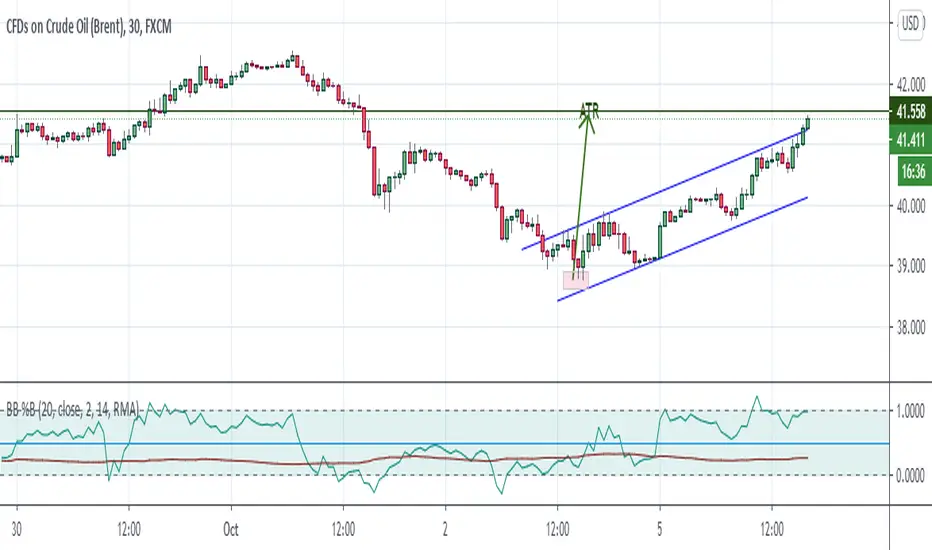
Bollinger Bands %B + ATR This indicator is best suitable for the 30-minutes interval OIL charts, due to ATR accuracy.
BB%B is great for showing oversold/overbought market conditions and offers excellent entry/exit opportunities for Day Trading (30 minutes chart), as well as reliable convergence/divergence patterns. ATR is conveniently combined and shows potential market volatility levels for the day when used in 30-minutes charts, thus demarcating your day trade exit point.
To use the ATR on this indicator: Just read the ATR value of the lowest (for a new bull trend) or the highest (for a new bear trend) candlestick of the newly formed trend leg. Let's suppose the ATR reads 0.2891, then you project a move of 2.891 points towards the given trend direction using the ruler tool (30-minutes charts). That's all, and there you have your take profit target!
Good Luck!!!
ADX strategy (considering ADX and +DI only )I have been checking the strategies on ADX indicator.
I have found that +DI crossing above ADX line under threshold 30 and exit on crossdown when ADX above 30 has better results than just following crossovers of +DI and -DI , ADX crossing above 30 .
BUY Rule
========
fast ema is above slow ema (default 13 and 55 , you can change these values in settings)
+DI cross above ADX well beloe threshold level (default 30)
Exit reule
========
when +DI cross down ADX , well above on threshold level
Stop Loss
=========
Default is set to 8%
Take a look and let me know how your symbol works with this strategy
Note : Bar color changes to yellow when the BUY condition is met.
Bar color and Background color shows to blue --- if Long position is active
fast ema and long ema doesnt print on the chart -- please add manually to the chart
Warning : for the use of educational purposes only

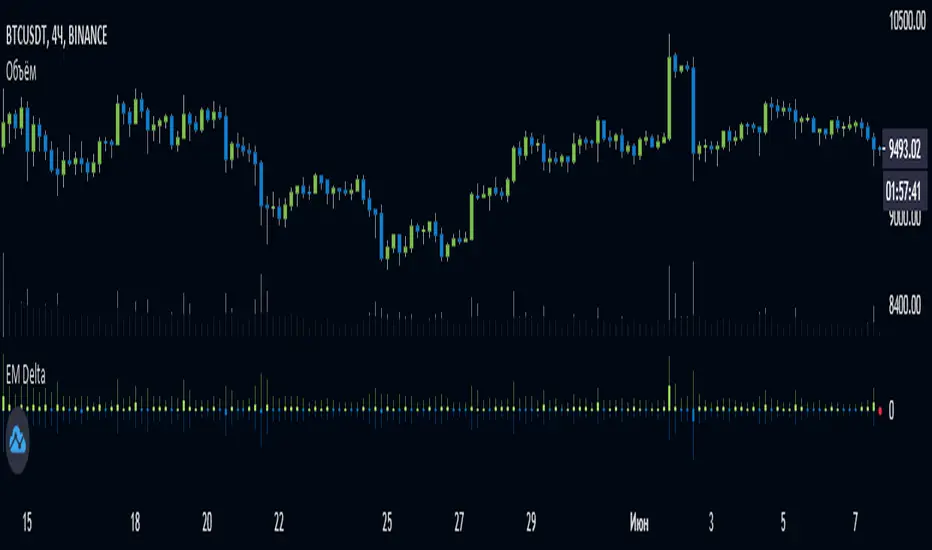
EulerMethod: DeltaEN
Shows the Integral Volume Delta (IVD)
It is a detailed OBV. Each bar sums up the volume for bars of a shorter timeframe.
For example, inside a 1M bar, every 12h bar is added up, and inside a 1h bar, every 1min bar is added. Thus, a conditional volume delta inside the bar is obtained.
The indicator for each bar shows the volume of purchases (positive), sales (negative) and the difference — IVD
The delta histogram is thicker than the volume histograms
Settings detalisation
M — 6 hours, 12 hours and 1 day for the M timeframe (720 by default)
W — 4 hours, 6 hours and 12 hours for the W timeframe (240 by default)
D — 30 minutes, 1 hour and 2 hours for the D timeframe (60 by default)
H — 1 minute, 5 minutes and 15 minutes for timeframes [1h, D) (default is 1)
For timeframes of 15m and less, the calculation is carried out by minute bars
VSA mode
The classic OBV adds volume to the cumulative sum under the condition Сlose (n) > Close (n-1) and subtracts it under the condition Close (n) < Close (n-1)
When VSA mode is disabled, all volumes are summed up under these conditions.
When the VSA approximation is turned on, the volume per bar of detail is divided by the factor (Close - Low) / (High - Low)
That is, it takes into account the spread per bar and closing relative to the spread. VSA is enabled by default
A/D mode
Shows the cumulative Accumulation / Distribution Index
The delta of the detail bar is multiplied by (High + Low + Close) / 3 bars, the result is added to the cumulative sum
No additional price conversions required due to integral summation
Index line view is customizable
EM Delta does not receive intermediate values in real time.
To see the result, wait until the bar closes or switch to a smaller timeframe
RU
Показывает Интегральную Дельту Объёма (ИДО)
Представляет собой детализированный OBV. В каждом баре суммируется объём за бары меньшего таймфрейма.
Например, внутри 1М-бара суммируется каждый 12h-бар, а внутри 1h — каждый 1m-бар. Таким образом получается условная дельта объёма внутри бара
Индикатор на каждый бар показывает объём покупок (положительный), объём продаж (отрицательный) и разницу — ИДО
Гистограмма дельты толще гистограмм объёмов
Настройки детализации внутри бара
M — 6 часов, 12 часов и 1 день для таймфрейма M (по-умолчанию 720)
W — 4 часа, 6 часов и 12 часов для таймфрейма W (по-умолчанию 240)
D — 30 минут, 1 час и 2 часа для таймфрейма D (по-умолчанию 60)
H — 1 минута, 5 минут и 15 минут для таймфреймов [1h, D) (по-умолчанию 1)
Для таймфреймов 15m и меньше расчёт ведётся по минутным барам
Режим VSA
Классический OBV прибавляет объём к кумулятивной сумме при условии Сlose(n) > Close(n-1) и отнимает при условии Close(n) < Close(n-1)
При отключении режима VSA все объёмы суммируются по этим условиям
При включённой VSA-аппроксимации объём за бар детализации делится по фактору (Close - Low) / (High - Low)
То есть учитывает спред за бар и закрытие относительно спреда. По-умолчанию режим VSA включен
Режим A/D
Показывает кумулятивный индекс Накопления/Распределения
Дельта бара детализации умножается на (High + Low + Close) / 3 бара, результат прибавляется к кумулятивной сумме
Дополнительные преобразования цены не требуются ввиду интегрального суммирования
Вид линии индекса настраивается
EM Delta не получает промежуточные значения в реальном времени.
Чтобы увидеть результат, дождитесь закрытия бара или перейдите на меньший таймфрейм
Crypto Trading Hours UTC based on Berlin time (UTC +2)Although crypto markets trade 24/7, there are spikes in volume according to the general hours at which different parts of the world do the majority of their trading.
This Script highlights the US, European and Asian markets when they are most active. The normal market hours are always from 08:00 to 16:30 local time.
US market opens at 8:00 Silicon Valley local time, and closes at 16:30 New York local time.
European market opens at 8:00 London local time, and closes at 16:30 Frankfurt local time.
Asian market opens at 8:00 Hong Kong local time, and closes at 16:30 Sydney local time.

Supertrend MTF LAG ISSUEThis script based on
we all use Super trend but it main issue is the lag as it buy too late or sell too late
using Deavaet study of Heat map MTF we can do a little trick
if you look on his study you can see that major signal for example will happen in the time frame before it happen at larger time frame
so in this example if signal at MTF 30 min and signal at MTF 60 min happen at the same time at 2 hours or 4 hours candles then this signal are more likely to be true then random signal at each time frame specific.
since we use shorter time frame on larger time frame we can remove the lag issue that make supertrend not so effective
In this example I set the signal to be MTF 30 +60 om 2 hour TF , can be good also for 4 hour candles..
So you get the signal to close inside the larger candle
now if you want to make on even shorter TF then change the code to 15 and 30 MTF on candles on 1 hour
or 1 and 5 min on 30 min or 15 min

Panchang Time//This indicator is required in NimblrTA and can be used to define timeslots for the trend confirmation
study("Panchang Time", overlay=true)
timeinrange(res, sess) => time(res, sess) != 0
premarket = #C0C0C0
regular = #0000FF
regularslot2 = #00CCFF
postmarket = #5000FF
notrading = na
sessioncolor = timeinrange("30", "0915-0930") ? premarket : timeinrange("30", "0915-0930") ? regular : timeinrange("30", "0931-1200") ? regularslot2 : timeinrange("30", "1201-1305") ? postmarket : notrading
bgcolor(sessioncolor, transp=90)

extended session - Regular Opening-Range- JayyOpening Range and some other scripts updated to plot correctly (see comments below.) There are three variations of the fibonacci expansion beyond the opening range and retracements within the opening range of the US Market session - I have not put in the script for the other markets yet.
The three scripts have different uses and strengths:
The extended session script (with the script here below) will plot the opening range whether you are using the extended session or the regular session. (that is to say whether "ext" in the lower right hand corner is highlighted or not.). While in the extended session the opening range has some plotting issues with periods like 13 minutes or any period that is not divisible into 330 mins with a round number outcome (eg 330/60 =5.5. Therefore an hour long opening range has problems in the extended session.
The pre session script is only for the premarket. You can select any opening range period you like. I have set the opening range to be the full premarket session. If you select a different session you will have to unselect "pre open to 9:30 EST for Opening Range?" in the format section. The script defaults to 15 minutes in the "period Of Pre Opening Range?". To go back to the 4 am to 9:30 pre opening range select "pre open to 9:30 EST for Opening Range?" there is no automatic 330 minute selection.
The past days offset script only works in 5 min or 15 minute period. It will show the opening range from up to 20 days past over the current days price action. Use this for the regular session only. 0 shows the current day's opening range. Use the positive integers for number of days back ie 1, 2, 3 etc not -1, -2, -3 etc. The script is preprogrammed to use the current day (0).
Scripts updated to plot correctly: One thing they all have in common is a way of they deal with a somewhat random problem that shifts the plots 4 hours in one direction or the other ie the plot started at 9:30 EST or 1:30PM EST. This issue started to occur approximately June 22, 2015 and impacts any script that tried to use "session" times to manage a plot in my scripts. The issue now seems to have been resolved during this past week.
Just in case the problem reoccurs I have added a "Switch session plot?" to each script. If the plot looks funny check or uncheck the "Switch session plot?" and see the difference. Of course if a new issue crops up it will likely require a different fix.
I have updated all of the scripts shown on this chart. If you are using a script of mine that suffers from the compiler issue then you will find an update on this chart. You can get any and all of the scripts by clicking on the small sideways wishbone on the left middle of the chart. You will see a dialogue box. Then click "make it mine". This will import all of the scripts to your computer and you can play around with them all to decide what you want and what you don't want. This is the easiest way to get all of the scripts in one fell swoop. It is also the easiest way for me to make all of the scripts available. I do not have all of the plots visible since it is too messy and one of the scripts (pre OR) is only for the regular session. To view the scripts click on the blue eye to the right of the script title to show it on this script. If you can only use the regular session. The scripts will all (with the exception of the pre OR) work fine.
If for any reason this script seems flakey refresh the page r try a slightly different period. I have noticed that sometimes randomly the script loves to return to the 5 min OR. This is a very new issue transient issue. As always if you see an issue please let me know.
Cheers Jayy

RSI (Custom Background) KDMThis code is a custom version of the RSI (Relative Strength Index) indicator.
Its main purpose is to compare recent price gains and losses to determine whether the market is in an overbought or oversold condition.
30–50 zone (purple tone): represents a weak or pullback area.
50–70 zone (green tone): represents a strengthening or dominant buying area.
Additionally, when the RSI line moves above 70, a green gradient background highlights the overbought region; when it moves below 30, a red gradient background emphasizes the oversold region.
Like the classic RSI, this version is a momentum indicator showing whether the price is losing or gaining strength.
The key difference is the colored background, which allows you to visually identify the RSI zones (e.g., 30–50 weak, 50–70 strong) much faster and more clearly.

SJ Fx Session RangeSJ Fx Session Range Indicator
A Professional Forex Session Tracking Tool with Opening Range Analysis
Overview
The SJ Fx Session Range indicator is a comprehensive tool designed to help forex traders visualize major trading sessions (Asia, Europe+London, and New York) along with their first 15-minute opening ranges. Built with Pine Script v5, this indicator provides clear session boundaries, high/low ranges, and customizable opening range analysis to enhance your trading decisions.
Key Features
1. Trading Session Boxes
- Three major forex sessions: Asia, Europe+London, and New York
- Color-coded session boxes with transparent backgrounds for easy visualization
- Automatic session high/low tracking
- Session labels displayed inside boxes for quick identification
- Displays up to 50 historical sessions for pattern analysis
2. Opening Range Analysis
- Tracks first 15-minute opening range for Europe, London, and NY sessions
- Plots high, low, and mid-range levels
- Customizable line colors for each session's opening range
- Background highlights during the first 15 minutes of each session
- Helps identify potential breakout or reversal zones
3. Daylight Saving Time Support
- Built-in DST toggle for easy seasonal adjustment
- Automatically adjusts all session timings by 1 hour when enabled
- Clear tooltip instructions for when to enable/disable DST
- Default timings configured for IST timezone (Asia/Kolkata)
4. User-Friendly Design
- Clean input interface organized by session categories
- Fixed optimal settings for boxes and lines (50-day history)
- All session times are easily customizable with helpful tooltips
- Warning tooltips to prevent accidental timing changes
Default Session Times (when DST is disabled)
- Asia Session: 04:00 - 12:30 IST
- Europe + London Session: 12:30 - 20:00 IST
- New York Session: 20:00 - 02:30 IST
How to Use
1. Add to Chart: Apply the indicator to any forex pair chart
2. Adjust DST: Enable the "Start Daylight Saving Time Change" checkbox on the second Sunday in March; disable on the first Sunday in November
3. Customize Sessions: Toggle individual sessions on/off based on your trading preference
4. Opening Range Colors: Customize the opening range line colors for better visibility
5. Session Times: Default times are optimized for IST; modify only if trading from a different timezone
Technical Specifications
- Version: Pine Script v5
- Overlay: Yes (draws directly on price chart)
- Maximum Objects: 500 boxes, 500 lines
- History: 50 days of session data
- Timezone: Asia/Kolkata (IST) - customizable in code
Use Cases
- Identify high-liquidity trading periods
- Track session volatility patterns
- Monitor opening range breakouts/breakdowns
- Analyze session-specific price action
- Plan entries around major session opens
- Avoid trading during low-liquidity periods
Performance
Optimized for efficient rendering with:
- Fixed 50-day history limit for optimal performance
- Automatic cleanup of old session boxes and lines
- Lightweight code structure for fast chart loading
Customization Options
Available Inputs:
- Enable/disable individual sessions
- Adjust session timings (with safety tooltips)
- Toggle DST on/off
- Show/hide opening range analysis
- Customize opening range line colors for each session
Fixed for Optimal Performance:
- Session box colors (Asia: Aqua, Europe: Green, NY: Red)
- 50-day historical display
- Line width and style
- Mid-range line always displayed
Educational Value
This indicator helps traders:
- Understand forex market structure and session overlaps
- Recognize high-probability trading times
- Develop session-based trading strategies
- Improve timing of trade entries and exits
Open Source License
This script is published under Mozilla Public License 2.0, allowing you to:
- Use freely for personal trading
- Modify and adapt to your needs
- Learn from the code structure
- Share improvements with the community
Credits
Developed by Shantanu Joshi
- Designed for forex traders focusing on session-based strategies
- Built with clean, well-documented Pine Script v5 code
- Regular updates and improvements based on user feedback
Support & Feedback
If you find this indicator useful:
- Give it a thumbs up
- Share your trading results in the comments
- Suggest improvements or new features
- Report any issues for quick resolution
Disclaimer
This indicator is for educational and informational purposes only. It does not constitute financial advice. Always conduct your own research and risk management before making trading decisions. Past performance does not guarantee future results.
Compatible with: CFDs of forex pairs, commodities, indices, and crypto.
Best used on: 5-minutes
Recommended chart type: Candlestick charts

RSI Regime: Continuation vs Reversal Indicator Description: RSI Regime (Continuation vs. Reversal)
This indicator uses the standard Relative Strength Index (RSI) to analyze market momentum and categorize it into three "regimes." Its primary goal is to help you determine if an overbought (OB) or oversold (OS) signal is likely to be a continuation of the current trend or a reversal point.
It also identifies "Fast Trend Starts," which are exceptionally fast and powerful moves from one extreme to the other.
Core Features & How to Read It
1. The Three RSI Regimes (Background Color) The script calculates a moving average (SMA) of the RSI to determine the dominant medium-term momentum. This is shown as the background color:
Bull Regime (Green Background): The RSI's average is high (e.g., above 55). The market is in a clear uptrend.
Bear Regime (Red Background): The RSI's average is low (e.g., below 45). The market is in a clear downtrend.
Range Regime (Orange Background): The RSI's average is in the middle. The market is consolidating or undecided.
2. Overbought (OB) & Oversold (OS) Signals
When the RSI line crosses into the overbought (e.g., >70) or oversold (e.g., <30) zones, the indicator generates one of two types of signals:
A) Continuation Signals (Small Triangles: ►)
These signals suggest an OB/OS reading is just a "pause" and the main trend will likely continue.
Orange ► (at the top): Appears when RSI becomes overbought while the market is already in a Bull Regime. This suggests the uptrend is strong, and this OB signal may not lead to a big drop.
Teal ► (at the bottom): Appears when RSI becomes oversold while the market is already in a Bear Regime. This suggests the downtrend is strong, and this OS signal may not lead to a big bounce.
(Note: An optional Price EMA filter can be enabled to make these signals more strict.)
B) Reversal Signals (Small Labels: "OS→>50" / "OB→<50")
These labels appear after an OB/OS signal to confirm that a reversal has actually occurred.
"OS→>50 Reversal" (Aqua Label): Appears if the RSI becomes oversold and then recovers back above the 50 midline within a set number of bars. This confirms the oversold dip was a reversal point.
"OB→<50 Reversal" (Orange Label): Appears if the RSI becomes overbought and then falls back below the 50 midline within a set number of bars. This confirms the overbought peak was a reversal point.
3. "Fast Trend Starts" (Large Labels)
This is a unique feature that identifies the fastest percentile of market moves. It measures how many bars it takes for the RSI to go from one extreme to the other and flags when a move is in the top 5% (default) of all historical moves.
"Long Pullbacks (Fast OS→BullRange)" (Large Green Label): This powerful signal appears when the RSI moves from oversold (<30) all the way up to the bull range (>60) exceptionally fast. It identifies a very strong, fast, and decisive bounce that could signal the start of a new uptrend.
"Short Pumps (Fast OB→BearRange)" (Large Red Label): This appears when the RSI moves from overbought (>70) all the way down to the bear range (<40) exceptionally fast. It identifies a very sharp, fast rejection or "pump-and-dump" that could signal the start of a new downtrend.
Key User Inputs
RSI Length (14): The lookback period for the main RSI calculation.
OB (70) / OS (30): The standard overbought and oversold levels.
Bull/Bear Range Threshold (60/40): These are the levels used to confirm the "Fast Trend Starts." They are separate from the OB/OS levels.
RSI Regime SMA Length (21): The lookback period for the moving average that determines the background regime.
Use Price EMA filter (true): If checked, the small "Continuation" triangles will only appear if the price is also above (for bulls) or below (for bears) its own 50-period EMA.
Fastest X% duration (5.0): This sets the percentile for the "Fast Trend Start" labels. 5.0 means it only flags moves that are in the fastest 5% of all recorded moves.

Algorithm Predator - ML-liteAlgorithm Predator - ML-lite
This indicator combines four specialized trading agents with an adaptive multi-armed bandit selection system to identify high-probability trade setups. It is designed for swing and intraday traders who want systematic signal generation based on institutional order flow patterns , momentum exhaustion , liquidity dynamics , and statistical mean reversion .
Core Architecture
Why These Components Are Combined:
The script addresses a fundamental challenge in algorithmic trading: no single detection method works consistently across all market conditions. By deploying four independent agents and using reinforcement learning algorithms to select or blend their outputs, the system adapts to changing market regimes without manual intervention.
The Four Trading Agents
1. Spoofing Detector Agent 🎭
Detects iceberg orders through persistent volume at similar price levels over 5 bars
Identifies spoofing patterns via asymmetric wick analysis (wicks exceeding 60% of bar range with volume >1.8× average)
Monitors order clustering using simplified Hawkes process intensity tracking (exponential decay model)
Signal Logic: Contrarian—fades false breakouts caused by institutional manipulation
Best Markets: Consolidations, institutional trading windows, low-liquidity hours
2. Exhaustion Detector Agent ⚡
Calculates RSI divergence between price movement and momentum indicator over 5-bar window
Detects VWAP exhaustion (price at 2σ bands with declining volume)
Uses VPIN reversals (volume-based toxic flow dissipation) to identify momentum failure
Signal Logic: Counter-trend—enters when momentum extreme shows weakness
Best Markets: Trending markets reaching climax points, over-extended moves
3. Liquidity Void Detector Agent 💧
Measures Bollinger Band squeeze (width <60% of 50-period average)
Identifies stop hunts via 20-bar high/low penetration with immediate reversal and volume spike
Detects hidden liquidity absorption (volume >2× average with range <0.3× ATR)
Signal Logic: Breakout anticipation—enters after liquidity grab but before main move
Best Markets: Range-bound pre-breakout, volatility compression zones
4. Mean Reversion Agent 📊
Calculates price z-scores relative to 50-period SMA and standard deviation (triggers at ±2σ)
Implements Ornstein-Uhlenbeck process scoring (mean-reverting stochastic model)
Uses entropy analysis to detect algorithmic trading patterns (low entropy <0.25 = high predictability)
Signal Logic: Statistical reversion—enters when price deviates significantly from statistical equilibrium
Best Markets: Range-bound, low-volatility, algorithmically-dominated instruments
Adaptive Selection: Multi-Armed Bandit System
The script implements four reinforcement learning algorithms to dynamically select or blend agents based on performance:
Thompson Sampling (Default - Recommended):
Uses Bayesian inference with beta distributions (tracks alpha/beta parameters per agent)
Balances exploration (trying underused agents) vs. exploitation (using proven winners)
Each agent's win/loss history informs its selection probability
Lite Approximation: Uses pseudo-random sampling from price/volume noise instead of true random number generation
UCB1 (Upper Confidence Bound):
Calculates confidence intervals using: average_reward + sqrt(2 × ln(total_pulls) / agent_pulls)
Deterministic algorithm favoring agents with high uncertainty (potential upside)
More conservative than Thompson Sampling
Epsilon-Greedy:
Exploits best-performing agent (1-ε)% of the time
Explores randomly ε% of the time (default 10%, configurable 1-50%)
Simple, transparent, easily tuned via epsilon parameter
Gradient Bandit:
Uses softmax probability distribution over agent preference weights
Updates weights via gradient ascent based on rewards
Best for Blend mode where all agents contribute
Selection Modes:
Switch Mode: Uses only the selected agent's signal (clean, decisive)
Blend Mode: Combines all agents using exponentially weighted confidence scores controlled by temperature parameter (smooth, diversified)
Lock Agent Feature:
Optional manual override to force one specific agent
Useful after identifying which agent dominates your specific instrument
Only applies in Switch mode
Four choices: Spoofing Detector, Exhaustion Detector, Liquidity Void, Mean Reversion
Memory System
Dual-Layer Architecture:
Short-Term Memory: Stores last 20 trade outcomes per agent (configurable 10-50)
Long-Term Memory: Stores episode averages when short-term reaches transfer threshold (configurable 5-20 bars)
Memory Boost Mechanism: Recent performance modulates agent scores by up to ±20%
Episode Transfer: When an agent accumulates sufficient results, averages are condensed into long-term storage
Persistence: Manual restoration of learned parameters via input fields (alpha, beta, weights, microstructure thresholds)
How Memory Works:
Agent generates signal → outcome tracked after 8 bars (performance horizon)
Result stored in short-term memory (win = 1.0, loss = 0.0)
Short-term average influences agent's future scores (positive feedback loop)
After threshold met (default 10 results), episode averaged into long-term storage
Long-term patterns (weighted 30%) + short-term patterns (weighted 70%) = total memory boost
Market Microstructure Analysis
These advanced metrics quantify institutional order flow dynamics:
Order Flow Toxicity (Simplified VPIN):
Measures buy/sell volume imbalance over 20 bars: |buy_vol - sell_vol| / (buy_vol + sell_vol)
Detects informed trading activity (institutional players with non-public information)
Values >0.4 indicate "toxic flow" (informed traders active)
Lite Approximation: Uses simple open/close heuristic instead of tick-by-tick trade classification
Price Impact Analysis (Simplified Kyle's Lambda):
Measures market impact efficiency: |price_change_10| / sqrt(volume_sum_10)
Low values = large orders with minimal price impact ( stealth accumulation )
High values = retail-dominated moves with high slippage
Lite Approximation: Uses simplified denominator instead of regression-based signed order flow
Market Randomness (Entropy Analysis):
Counts unique price changes over 20 bars / 20
Measures market predictability
High entropy (>0.6) = human-driven, chaotic price action
Low entropy (<0.25) = algorithmic trading dominance (predictable patterns)
Lite Approximation: Simple ratio instead of true Shannon entropy H(X) = -Σ p(x)·log₂(p(x))
Order Clustering (Simplified Hawkes Process):
Tracks self-exciting event intensity (coordinated order activity)
Decays at 0.9× per bar, spikes +1.0 when volume >1.5× average
High intensity (>0.7) indicates clustering (potential spoofing/accumulation)
Lite Approximation: Simple exponential decay instead of full λ(t) = μ + Σ α·exp(-β(t-tᵢ)) with MLE
Signal Generation Process
Multi-Stage Validation:
Stage 1: Agent Scoring
Each agent calculates internal score based on its detection criteria
Scores must exceed agent-specific threshold (adjusted by sensitivity multiplier)
Agent outputs: Signal direction (+1/-1/0) and Confidence level (0.0-1.0)
Stage 2: Memory Boost
Agent scores multiplied by memory boost factor (0.8-1.2 based on recent performance)
Successful agents get amplified, failing agents get dampened
Stage 3: Bandit Selection/Blending
If Adaptive Mode ON:
Switch: Bandit selects single best agent, uses only its signal
Blend: All agents combined using softmax-weighted confidence scores
If Adaptive Mode OFF:
Traditional consensus voting with confidence-squared weighting
Signal fires when consensus exceeds threshold (default 70%)
Stage 4: Confirmation Filter
Raw signal must repeat for consecutive bars (default 3, configurable 2-4)
Minimum confidence threshold: 0.25 (25%) enforced regardless of mode
Trend alignment check: Long signals require trend_score ≥ -2, Short signals require trend_score ≤ 2
Stage 5: Cooldown Enforcement
Minimum bars between signals (default 10, configurable 5-15)
Prevents over-trading during choppy conditions
Stage 6: Performance Tracking
After 8 bars (performance horizon), signal outcome evaluated
Win = price moved in signal direction, Loss = price moved against
Results fed back into memory and bandit statistics
Trading Modes (Presets)
Pre-configured parameter sets:
Conservative: 85% consensus, 4 confirmations, 15-bar cooldown
Expected: 60-70% win rate, 3-8 signals/week
Best for: Swing trading, capital preservation, beginners
Balanced: 70% consensus, 3 confirmations, 10-bar cooldown
Expected: 55-65% win rate, 8-15 signals/week
Best for: Day trading, most traders, general use
Aggressive: 60% consensus, 2 confirmations, 5-bar cooldown
Expected: 50-58% win rate, 15-30 signals/week
Best for: Scalping, high-frequency trading, active management
Elite: 75% consensus, 3 confirmations, 12-bar cooldown
Expected: 58-68% win rate, 5-12 signals/week
Best for: Selective trading, high-conviction setups
Adaptive: 65% consensus, 2 confirmations, 8-bar cooldown
Expected: Varies based on learning
Best for: Experienced users leveraging bandit system
How to Use
1. Initial Setup (5 Minutes):
Select Trading Mode matching your style (start with Balanced)
Enable Adaptive Learning (recommended for automatic agent selection)
Choose Thompson Sampling algorithm (best all-around performance)
Keep Microstructure Metrics enabled for liquid instruments (>100k daily volume)
2. Agent Tuning (Optional):
Adjust Agent Sensitivity multipliers (0.5-2.0):
<0.8 = Highly selective (fewer signals, higher quality)
0.9-1.2 = Balanced (recommended starting point)
1.3 = Aggressive (more signals, lower individual quality)
Monitor dashboard for 20-30 signals to identify dominant agent
If one agent consistently outperforms, consider using Lock Agent feature
3. Bandit Configuration (Advanced):
Blend Temperature (0.1-2.0):
0.3 = Sharp decisions (best agent dominates)
0.5 = Balanced (default)
1.0+ = Smooth (equal weighting, democratic)
Memory Decay (0.8-0.99):
0.90 = Fast adaptation (volatile markets)
0.95 = Balanced (most instruments)
0.97+ = Long memory (stable trends)
4. Signal Interpretation:
Green triangle (▲): Long signal confirmed
Red triangle (▼): Short signal confirmed
Dashboard shows:
Active agent (highlighted row with ► marker)
Win rate per agent (green >60%, yellow 40-60%, red <40%)
Confidence bars (█████ = maximum confidence)
Memory size (short-term buffer count)
Colored zones display:
Entry level (current close)
Stop-loss (1.5× ATR)
Take-profit 1 (2.0× ATR)
Take-profit 2 (3.5× ATR)
5. Risk Management:
Never risk >1-2% per signal (use ATR-based stops)
Signals are entry triggers, not complete strategies
Combine with your own market context analysis
Consider fundamental catalysts and news events
Use "Confirming" status to prepare entries (not to enter early)
6. Memory Persistence (Optional):
After 50-100 trades, check Memory Export Panel
Record displayed alpha/beta/weight values for each agent
Record VPIN and Kyle threshold values
Enable "Restore From Memory" and input saved values to continue learning
Useful when switching timeframes or restarting indicator
Visual Components
On-Chart Elements:
Spectral Layers: EMA8 ± 0.5 ATR bands (dynamic support/resistance, colored by trend)
Energy Radiance: Multi-layer glow boxes at signal points (intensity scales with confidence, configurable 1-5 layers)
Probability Cones: Projected price paths with uncertainty wedges (15-bar projection, width = confidence × ATR)
Connection Lines: Links sequential signals (solid = same direction continuation, dotted = reversal)
Kill Zones: Risk/reward boxes showing entry, stop-loss, and dual take-profit targets
Signal Markers: Triangle up/down at validated entry points
Dashboard (Configurable Position & Size):
Regime Indicator: 4-level trend classification (Strong Bull/Bear, Weak Bull/Bear)
Mode Status: Shows active system (Adaptive Blend, Locked Agent, or Consensus)
Agent Performance Table: Real-time win%, confidence, and memory stats
Order Flow Metrics: Toxicity and impact indicators (when microstructure enabled)
Signal Status: Current state (Long/Short/Confirming/Waiting) with confirmation progress
Memory Panel (Configurable Position & Size):
Live Parameter Export: Alpha, beta, and weight values per agent
Adaptive Thresholds: Current VPIN sensitivity and Kyle threshold
Save Reminder: Visual indicator if parameters should be recorded
What Makes This Original
This script's originality lies in three key innovations:
1. Genuine Meta-Learning Framework:
Unlike traditional indicator mashups that simply display multiple signals, this implements authentic reinforcement learning (multi-armed bandits) to learn which detection method works best in current conditions. The Thompson Sampling implementation with beta distribution tracking (alpha for successes, beta for failures) is statistically rigorous and adapts continuously. This is not post-hoc optimization—it's real-time learning.
2. Episodic Memory Architecture with Transfer Learning:
The dual-layer memory system mimics human learning patterns:
Short-term memory captures recent performance (recency bias)
Long-term memory preserves historical patterns (experience)
Automatic transfer mechanism consolidates knowledge
Memory boost creates positive feedback loops (successful strategies become stronger)
This architecture allows the system to adapt without retraining , unlike static ML models that require batch updates.
3. Institutional Microstructure Integration:
Combines retail-focused technical analysis (RSI, Bollinger Bands, VWAP) with institutional-grade microstructure metrics (VPIN, Kyle's Lambda, Hawkes processes) typically found in academic finance literature and professional trading systems, not standard retail platforms. While simplified for Pine Script constraints, these metrics provide insight into informed vs. uninformed trading , a dimension entirely absent from traditional technical analysis.
Mashup Justification:
The four agents are combined specifically for risk diversification across failure modes:
Spoofing Detector: Prevents false breakout losses from manipulation
Exhaustion Detector: Prevents chasing extended trends into reversals
Liquidity Void: Exploits volatility compression (different regime than trending)
Mean Reversion: Provides mathematical anchoring when patterns fail
The bandit system ensures the optimal tool is automatically selected for each market situation, rather than requiring manual interpretation of conflicting signals.
Why "ML-lite"? Simplifications and Approximations
This is the "lite" version due to necessary simplifications for Pine Script execution:
1. Simplified VPIN Calculation:
Academic Implementation: True VPIN uses volume bucketing (fixed-volume bars) and tick-by-tick buy/sell classification via Lee-Ready algorithm or exchange-provided trade direction flags
This Implementation: 20-bar rolling window with simple open/close heuristic (close > open = buy volume)
Impact: May misclassify volume during ranging/choppy markets; works best in directional moves
2. Pseudo-Random Sampling:
Academic Implementation: Thompson Sampling requires true random number generation from beta distributions using inverse transform sampling or acceptance-rejection methods
This Implementation: Deterministic pseudo-randomness derived from price and volume decimal digits: (close × 100 - floor(close × 100)) + (volume % 100) / 100
Impact: Not cryptographically random; may have subtle biases in specific price ranges; provides sufficient variation for agent selection
3. Hawkes Process Approximation:
Academic Implementation: Full Hawkes process uses maximum likelihood estimation with exponential kernels: λ(t) = μ + Σ α·exp(-β(t-tᵢ)) fitted via iterative optimization
This Implementation: Simple exponential decay (0.9 multiplier) with binary event triggers (volume spike = event)
Impact: Captures self-exciting property but lacks parameter optimization; fixed decay rate may not suit all instruments
4. Kyle's Lambda Simplification:
Academic Implementation: Estimated via regression of price impact on signed order flow over multiple time intervals: Δp = λ × Δv + ε
This Implementation: Simplified ratio: price_change / sqrt(volume_sum) without proper signed order flow or regression
Impact: Provides directional indicator of impact but not true market depth measurement; no statistical confidence intervals
5. Entropy Calculation:
Academic Implementation: True Shannon entropy requires probability distribution: H(X) = -Σ p(x)·log₂(p(x)) where p(x) is probability of each price change magnitude
This Implementation: Simple ratio of unique price changes to total observations (variety measure)
Impact: Measures diversity but not true information entropy with probability weighting; less sensitive to distribution shape
6. Memory System Constraints:
Full ML Implementation: Neural networks with backpropagation, experience replay buffers (storing state-action-reward tuples), gradient descent optimization, and eligibility traces
This Implementation: Fixed-size array queues with simple averaging; no gradient-based learning, no state representation beyond raw scores
Impact: Cannot learn complex non-linear patterns; limited to linear performance tracking
7. Limited Feature Engineering:
Advanced Implementation: Dozens of engineered features, polynomial interactions (x², x³), dimensionality reduction (PCA, autoencoders), feature selection algorithms
This Implementation: Raw agent scores and basic market metrics (RSI, ATR, volume ratio); minimal transformation
Impact: May miss subtle cross-feature interactions; relies on agent-level intelligence rather than feature combinations
8. Single-Instrument Data:
Full Implementation: Multi-asset correlation analysis (sector ETFs, currency pairs, volatility indices like VIX), lead-lag relationships, risk-on/risk-off regimes
This Implementation: Only OHLCV data from displayed instrument
Impact: Cannot incorporate broader market context; vulnerable to correlated moves across assets
9. Fixed Performance Horizon:
Full Implementation: Adaptive horizon based on trade duration, volatility regime, or profit target achievement
This Implementation: Fixed 8-bar evaluation window
Impact: May evaluate too early in slow markets or too late in fast markets; one-size-fits-all approach
Performance Impact Summary:
These simplifications make the script:
✅ Faster: Executes in milliseconds vs. seconds (or minutes) for full academic implementations
✅ More Accessible: Runs on any TradingView plan without external data feeds, APIs, or compute servers
✅ More Transparent: All calculations visible in Pine Script (no black-box compiled models)
✅ Lower Resource Usage: <500 bars lookback, minimal memory footprint
⚠️ Less Precise: Approximations may reduce statistical edge by 5-15% vs. academic implementations
⚠️ Limited Scope: Cannot capture tick-level dynamics, multi-order-book interactions, or cross-asset flows
⚠️ Fixed Parameters: Some thresholds hardcoded rather than dynamically optimized
When to Upgrade to Full Implementation:
Consider professional Python/C++ versions with institutional data feeds if:
Trading with >$100K capital where precision differences materially impact returns
Operating in microsecond-competitive environments (HFT, market making)
Requiring regulatory-grade audit trails and reproducibility
Backtesting with tick-level precision for strategy validation
Need true real-time adaptation with neural network-based learning
For retail swing/day trading and position management, these approximations provide sufficient signal quality while maintaining usability, transparency, and accessibility. The core logic—multi-agent detection with adaptive selection—remains intact.
Technical Notes
All calculations use standard Pine Script built-in functions ( ta.ema, ta.atr, ta.rsi, ta.bb, ta.sma, ta.stdev, ta.vwap )
VPIN and Kyle's Lambda use simplified formulas optimized for OHLCV data (see "Lite" section above)
Thompson Sampling uses pseudo-random noise from price/volume decimal digits for beta distribution sampling
No repainting: All calculations use confirmed bar data (no forward-looking)
Maximum lookback: 500 bars (set via max_bars_back parameter)
Performance evaluation: 8-bar forward-looking window for reward calculation (clearly disclosed)
Confidence threshold: Minimum 0.25 (25%) enforced on all signals
Memory arrays: Dynamic sizing with FIFO queue management
Limitations and Disclaimers
Not Predictive: This indicator identifies patterns in historical data. It cannot predict future price movements with certainty.
Requires Human Judgment: Signals are entry triggers, not complete trading strategies. Must be confirmed with your own analysis, risk management rules, and market context.
Learning Period Required: The adaptive system requires 50-100 bars minimum to build statistically meaningful performance data for bandit algorithms.
Overfitting Risk: Restoring memory parameters from one market regime to a drastically different regime (e.g., low volatility to high volatility) may cause poor initial performance until system re-adapts.
Approximation Limitations: Simplified calculations (see "Lite" section) may underperform academic implementations by 5-15% in highly efficient markets.
No Guarantee of Profit: Past performance, whether backtested or live-traded, does not guarantee future performance. All trading involves risk of loss.
Forward-Looking Bias: Performance evaluation uses 8-bar forward window—this creates slight look-ahead for learning (though not for signals). Real-time performance may differ from indicator's internal statistics.
Single-Instrument Limitation: Does not account for correlations with related assets or broader market regime changes.
Recommended Settings
Timeframe: 15-minute to 4-hour charts (sufficient volatility for ATR-based stops; adequate bar volume for learning)
Assets: Liquid instruments with >100k daily volume (forex majors, large-cap stocks, BTC/ETH, major indices)
Not Recommended: Illiquid small-caps, penny stocks, low-volume altcoins (microstructure metrics unreliable)
Complementary Tools: Volume profile, order book depth, market breadth indicators, fundamental catalysts
Position Sizing: Risk no more than 1-2% of capital per signal using ATR-based stop-loss
Signal Filtering: Consider external confluence (support/resistance, trendlines, round numbers, session opens)
Start With: Balanced mode, Thompson Sampling, Blend mode, default agent sensitivities (1.0)
After 30+ Signals: Review agent win rates, consider increasing sensitivity of top performers or locking to dominant agent
Alert Configuration
The script includes built-in alert conditions:
Long Signal: Fires when validated long entry confirmed
Short Signal: Fires when validated short entry confirmed
Alerts fire once per bar (after confirmation requirements met)
Set alert to "Once Per Bar Close" for reliability
Taking you to school. — Dskyz, Trade with insight. Trade with anticipation.

MTF EMA Trading SystemHere's a comprehensive description and usage guide for publishing your MTF EMA Trading System indicator on TradingView:
MTF EMA Trading System - Pro Edition
📊 Indicator Overview
The MTF EMA Trading System is an advanced multi-timeframe exponential moving average indicator designed for traders seeking high-probability setups with multiple confirmations. Unlike simple EMA crossover systems, this indicator combines trend alignment, momentum, volume analysis, and previous day confluence to generate reliable long and short signals with optimal risk-reward ratios.
✨ Key Features
1. Multi-Timeframe EMA Analysis
Configure 5 independent EMAs (default: 9, 21, 50, 100, 200)
Each EMA can pull data from ANY timeframe (5m, 15m, 1H, 4H, 1D, etc.)
Color-coded lines with customizable widths
End-of-line labels showing EMA period and timeframe (e.g., "EMA200 ")
Perfect for analyzing higher timeframe trends on lower timeframe charts
2. Advanced Signal Generation (Beyond Simple Crosses)
The system requires MULTIPLE confirmations before generating a signal:
LONG Signals Require:
✅ Price action trigger (EMA cross, bounce from key EMA, or pullback setup)
✅ Bullish EMA alignment (EMAs in proper ascending order)
✅ Volume spike confirmation (configurable threshold)
✅ RSI momentum confirmation (bullish but not overbought)
✅ Sufficient EMA separation (avoids choppy/whipsaw conditions)
✅ Price above previous day's low (confluence with support)
SHORT Signals Require:
✅ Price action trigger (EMA cross, rejection from key EMA, or pullback setup)
✅ Bearish EMA alignment (EMAs in proper descending order)
✅ Volume spike confirmation
✅ RSI momentum confirmation (bearish but not oversold)
✅ Sufficient EMA separation
✅ Price below previous day's high (confluence with resistance)
3. Real-Time Dashboard
Displays critical market conditions at a glance:
Overall trend direction (Bullish/Bearish/Neutral)
Price position relative to all EMAs
Volume status (spike or normal)
RSI momentum reading
EMA confluence strength
EMA separation quality
Current ATR value
Previous day high/low levels
Current signal status (LONG/SHORT/WAIT)
Risk-reward ratio
4. Clean Visual Design
Large, clear trade signal markers (green triangles for LONG, red triangles for SHORT)
No chart clutter - only essential information displayed
Customizable signal sizes
Professional color-coded dashboard
5. Built-In Risk Management
ATR-based calculations for stop loss placement
1:2 risk-reward ratio by default
All levels displayed in dashboard for easy reference
🎯 How to Use This Indicator
Step 1: Initial Setup
Add the indicator to your TradingView chart
Configure your preferred timeframes for each EMA:
EMA 9: Leave blank (uses chart timeframe) - Fast reaction to price
EMA 21: Leave blank or set to 15m - Key pivot level
EMA 50: Set to 1H - Intermediate trend
EMA 100: Set to 4H - Major trend filter
EMA 200: Set to 1D - Overall market bias
Adjust signal settings based on your trading style:
Conservative: Keep all confirmations enabled
Aggressive: Disable volume or momentum requirements
Scalping: Reduce min EMA separation to 0.2-0.3%
Step 2: Reading the Dashboard
Before taking any trade, check the dashboard:
Trend: Only take LONG signals in bullish trends, SHORT signals in bearish trends
Position: Confirm price is on the correct side of EMAs
Volume: Green spike = strong confirmation
RSI: Avoid extremes (>70 or <30)
Confluence: "Strong" = high probability setup
Separation: "Good" = trending market, avoid "Low" separation
Step 3: Trade Entry
For LONG Trades:
Wait for green triangle to appear below price
Verify dashboard shows:
Bullish or Neutral trend
Volume spike (preferred)
RSI between 50-70
Good separation
Enter at market or on next bar
Set stop loss at: Entry - (ATR × 2)
Set target at: Entry + (ATR × 4)
For SHORT Trades:
Wait for red triangle to appear above price
Verify dashboard shows:
Bearish or Neutral trend
Volume spike (preferred)
RSI between 30-50
Good separation
Enter at market or on next bar
Set stop loss at: Entry + (ATR × 2)
Set target at: Entry - (ATR × 4)
Step 4: Trade Management
Use the ATR values from dashboard for position sizing
Trail stops using the fastest EMA (EMA 9) as price moves in your favor
Exit partial position at 1:1 risk-reward, let remainder run to target
Exit immediately if dashboard trend changes against your position
💡 Best Practices
Timeframe Recommendations:
Scalping: 1m-5m chart with 5m, 15m, 1H, 4H, 1D EMAs
Day Trading: 5m-15m chart with 15m, 1H, 4H, 1D EMAs
Swing Trading: 1H-4H chart with 4H, 1D, 1W EMAs
Position Trading: 1D chart with 1D, 1W, 1M EMAs
Market Conditions:
Best in: Trending markets with clear direction
Avoid: Tight consolidation, low volume periods, major news events
Filter trades: Only take signals aligned with higher timeframe trend
Risk Management:
Never risk more than 1-2% per trade
Use ATR from dashboard to calculate position size
Respect the stop loss levels
Don't force trades when dashboard shows weak conditions
⚙️ Customization Options
EMA Settings (for each of 5 EMAs):
Length (period)
Timeframe (multi-timeframe capability)
Color
Line width
Show/hide toggle
Signal Settings:
Volume confirmation (on/off)
Volume spike threshold (1.0-3.0x)
Momentum confirmation (on/off)
RSI overbought/oversold levels
Minimum EMA separation percentage
ATR period and stop multiplier
Display Settings:
Show/hide EMA labels
Show/hide trade signals
Signal marker size (tiny/small/normal/large)
Show/hide dashboard
🔔 Alert Setup
The indicator includes 4 alert conditions:
LONG Signal - Fires when all long confirmations are met
SHORT Signal - Fires when all short confirmations are met
Bullish Setup - Early warning when trend aligns bullish with volume
Bearish Setup - Early warning when trend aligns bearish with volume
To set up alerts:
Right-click on chart → Add Alert
Select "MTF EMA Trading System"
Choose your desired alert condition
Configure notification method (popup, email, SMS, webhook)
📈 Performance Tips
Increase Win Rate:
Only trade in direction of higher timeframe trend
Wait for volume spike confirmation
Avoid trades during first 30 minutes and last 15 minutes of session
Skip trades when separation is "Low"
Reduce False Signals:
Increase minimum EMA separation to 0.7-1.0%
Enable all confirmation requirements
Only trade when confluence shows "Strong"
Combine with support/resistance levels
Optimize for Your Market:
Stocks: Use 9, 21, 50, 100, 200 EMAs
Forex: Consider 8, 13, 21, 55, 89 EMAs (Fibonacci)
Crypto: May need wider ATR multiplier (2.5-3.0x) for volatility
⚠️ Important Notes
This indicator is designed to reduce false signals by requiring multiple confirmations
No indicator is 100% accurate - always use proper risk management
Backtesting recommended before live trading
Market conditions change - adjust settings as needed
Works best in liquid markets with clear price action
🎓 Conclusion
The MTF EMA Trading System transforms simple moving average analysis into a sophisticated, multi-confirmation trading strategy. By combining trend alignment, momentum, volume, and confluence, it helps traders identify high-probability setups while filtering out noise and false signals. The clean interface and comprehensive dashboard make it suitable for both beginners and experienced traders across all markets and timeframes.

Dual EMA Status Table (15m & 30m)It checks whether the 9 EMA is above or below the 21 EMA on:
the 15-minute chart, and
the 30-minute chart,
and then displays their alignment in a table:
Timeframe 9 vs 21 Status
15 min 9 > 21 Bullish
30 min 9 > 21 Bullish
CONFIRM ✅ Bullish
✅ “Bullish Confirm” → 9 EMA > 21 EMA on both → uptrend bias
❌ “Bearish Confirm” → 9 EMA < 21 EMA on both → downtrend bias
⚠️ “Mixed” → 15 m and 30 m disagree → stay neutral or wait
💡 How to Use It as a Trading Signal
You can treat it as a buy/sell framework with confirmation rules:
🔹 Buy (Long) bias
Table shows ✅ Bullish confirmation
9 EMA > 21 EMA on both timeframes
Ideally, price pulls back near one of the EMAs and then bounces
You could enter after a bullish candle close above the EMAs
📍 Example entry rule:
Enter long when “✅ Bullish” appears and price closes above both EMAs on the 15 min chart.
Stop-loss below the 21 EMA or recent swing low.
🔹 Sell (Short) bias
Table shows ❌ Bearish confirmation
9 EMA < 21 EMA on both timeframes
Price retraces upward and rejects near EMAs
📍 Example entry rule:
Enter short when “❌ Bearish” appears and price closes below both EMAs on the 15 min chart.
Stop-loss above 21 EMA or recent swing high.

Moving Averages DTMoving Averages Combo: SMA 30-50-100-200 + EMA 5-8-21 (Golden & Death Cross Ready)
This clean and lightweight indicator plots the most used simple and exponential moving averages in one single script — perfect for swing traders, position traders, and scalpers.
— Simple Moving Averages (Daily timeframe focus):
• SMA 30 (Red) — Early trend detection
• SMA 50 (Blue) — Classic medium-term trend
• SMA 100 (Green) — Institutional reference
• SMA 200 (Orange) — The legendary Golden/Death Cross line
— Fast Exponential Moving Averages (Perfect for pullbacks & entries):
• EMA 5 (Purple) — Ultra-fast reaction
• EMA 8 (Yellow) — Fibonacci-based favorite
• EMA 21 (Black) — 21-day cycle + Fibonacci
Why this combination works so well:
• EMA 8 + EMA 21 = Powerful short-term trend filter (used by thousands of crypto & forex traders)
• SMA 50/200 = Classic Golden & Death Cross signals
• SMA 30/100 = Extra confirmation layers used by banks and funds
Features:
✓ All MAs on a single indicator (no chart clutter)
✓ Clean colors with perfect contrast on light/dark themes
✓ Ready for alerts: set alert on EMA 8 crossing EMA 21 or SMA 50 crossing SMA 200
✓ Works on all markets & timeframes (stocks, forex, crypto, futures)
How to use:
• Bullish signal: Price above SMA 200 + EMA 8 > EMA 21 + SMA 50 > SMA 200
• Bearish signal: Price below SMA 200 + EMA 8 < EMA 21
• Pullback entries: Wait for price to touch EMA 21 in uptrend
IKZ MAX# 📊 RSI + Volume Profile Integrated Indicator
## 🎯 **General Description**
An integrated indicator that combines the power of **RSI (Relative Strength Index)** and **Volume Profile** in one technical analysis tool. It blends momentum analysis with volume distribution to provide more accurate and reliable trading signals.
## 📈 **Main Components**
### 1. **RSI (Relative Strength Index)**
- **Function**: Measures the speed and magnitude of price changes
- **Levels**:
- 🟥 **Overbought (70)**: Potential selling area
- 🟩 **Oversold (30)**: Potential buying area
- ⚪ **Midline (50)**: Balance line
### 2. **Volume Profile**
- **Function**: Analyzes trading volume distribution across price levels
- **Components**:
- 🟡 **POC (Point of Control)**: Price level with highest trading volume
- 🔵 **Value Area**: Area containing 68% of trading volume around POC
## ⚡ **Trading Signals**
### 📊 **Traditional RSI Signals**
- 🟢 **RSI Buy Signal**: When RSI crosses above 30 level (oversold)
- 🔴 **RSI Sell Signal**: When RSI crosses below 70 level (overbought)
### 💪 **Strong Integrated Signals**
- 💚 **Strong Buy**: RSI in oversold + Price near POC
- 🖤 **Strong Sell**: RSI in overbought + Price near POC
## 🛠 **Adjustable Settings**
### ⚙️ **RSI Settings**
- `rsi_length`: Calculation period (default: 14)
- `rsi_overbought`: Overbought level (default: 70)
- `rsi_oversold`: Oversold level (default: 30)
- `rsi_src`: Data source (default: close price)
### 📊 **Volume Profile Settings**
- `vp_lookback`: Lookback period (number of candles)
- `vp_rows`: Number of rows (distribution precision)
- `show_vp_histogram`: Show volume histogram
- `show_poc`: Show Point of Control
- `show_value_area`: Show Value Area
## 🎨 **Visual Elements**
### 📉 **Chart Display**
- RSI line in blue color
- Colored areas for extremes (red/green)
- POC line with label
- Buy/sell signals as colored triangles
### 📋 **Information Table**
- Current RSI value and status
- Current POC price
- Value Area range
- Current active signal
- Current active volume
## 🔔 **Alert Systems**
- Alerts for traditional RSI signals
- Alerts for integrated strong signals
- Updates once per bar
## 💡 **Trading Applications**
### 1. **Support and Resistance Identification**
- POC forms strongest support/resistance levels
- Value Area defines main trading range
### 2. **Momentum and Trend Analysis**
- RSI determines current momentum strength
- Volume Profile confirms level strength
### 3. **Entry Timing**
- Enter when integrated signals converge
- Confirm momentum alignment with volume distribution
## 🚀 **Unique Features**
### ✅ **Smart Integration**
- Combines two powerful indicators in one interface
- Integrated signals provide stronger confirmation
### ✅ **Flexibility**
- Fully customizable settings
- Suitable for all timeframes
### ✅ **User-Friendly**
- Clear visual interface
- Direct and easy-to-read signals
## 📊 **Result Interpretation**
### 🟢 **Ideal Buy Scenario**
- RSI below 40 (potential upward momentum)
- Price near POC (strong support)
- Buy signal from both indicators
### 🔴 **Ideal Sell Scenario**
- RSI above 60 (potential downward momentum)
- Price near POC (strong resistance)
- Sell signal from both indicators
## ⚠️ **Important Notes**
### 🔧 For Daily Timeframe:
- `vp_lookback = 50` (lookback period)
- `rsi_length = 14` (RSI period)
### 🔧 For Hourly Timeframe:
- `vp_lookback = 100` (lookback period)
- `rsi_length = 14` (RSI period)
## 📝 **Usage Tips**
1. **Strong Signals**: Wait for confirmation from both indicators before entering trades
2. **Risk Management**: Use POC as support/resistance for stop-loss placement
3. **Timing**: Best signals occur when RSI crosses critical levels with Volume Profile confirmation
## ⚠️ **Warning**
This indicator is for educational and analytical purposes only, not financial advice. Always practice risk management and never trade more than you can afford to lose.
---
**📈 Enjoy Smart Trading!** 🚀

Trend Meter [MMT]The Trend Meter is a dynamic Pine Script indicator designed to provide traders with a clear, multi-dimensional view of market trends and momentum across different timeframes and metrics. By integrating Exponential Moving Averages (EMAs), Volume-Weighted Average Price (VWAP), higher timeframe (HTF) analysis, and Regular Trading Hours (RTH) breakouts, this indicator offers a comprehensive tool for identifying bullish, bearish, or neutral market conditions. Its customizable visual display and label system make it ideal for traders seeking actionable insights for trend-following, breakout, or reversal strategies.
Key Features:
1. Multi-Metric Trend Analysis:
- Trend Meter : Compares a Fast EMA (default: 9) and Slow EMA (default: 21) to determine short-term trend direction.
- Bias Meter : Uses a longer-term Bias EMA (default: 35) to assess the overall market bias based on the close price.
- VWAP Meter : Evaluates price position relative to the VWAP for dynamic support/resistance insights.
- HTF Meter : Analyzes higher timeframe (default: 60-minute) price action, detecting breakouts of previous highs/lows and candle direction.
- RTH Meter : Tracks price breakouts above/below the US Regular Trading Hours (09:30–16:00 EST) 15m opening range (09:30–09:45 EST).
2. Color-Coded Visuals:
- Each metric is displayed as a horizontal line with customizable colors (green for bullish, red for bearish, gray for neutral).
- Visual style options (dotted, dashed, or solid lines) allow for personalized chart clarity.
3. Dynamic Labels:
- Optional labels for each metric (Trend, Bias, VWAP, HTF, RTH) with customizable text, size (tiny to huge), and color.
- Labels update in real-time, providing clear identification of each meter’s role and current state.
4. Flexible Metric Selection:
- Toggle individual metrics (EMA, VWAP, HTF, RTH) on/off to focus on relevant indicators for your trading style.
- Option to use the previous bar’s close price for calculations, reducing noise in volatile markets.
5. RTH and Opening Range Analysis:
- Calculates the high/low of the opening range (09:30–09:45 EST) during RTH sessions.
- Signals bullish or bearish conditions when the price breaks above/below the opening range outside the initial 15-minute window.
6. Higher Timeframe Breakout Detection:
- Monitors HTF price action to identify breakouts of the previous candle’s high or low, combined with the HTF candle’s direction for trend confirmation.
How to Use:
- Trend Confirmation : Use the Trend and Bias Meters to confirm short-term and long-term market direction.
- Breakout Trading : Leverage the RTH Meter for breakout setups above/below the opening range during US trading hours.
- Support/Resistance : Utilize the VWAP Meter to identify dynamic price levels for entries or exits.
- Higher Timeframe Context : Monitor the HTF Meter for broader market trend alignment, ideal for swing or position trading.
- Customization : Adjust EMA lengths, toggle metrics, and customize visual styles and labels to suit your chart preferences.
Settings:
- Bias Settings :
- Fast EMA (default: 9), Slow EMA (default: 21), Bias EMA (default: 35).
- Higher Timeframe (default: 60-minute).
- Option to use previous close price for calculations.
- Enable/disable individual metrics (EMA, VWAP, HTF, RTH).
- Visual Settings :
- Bullish (green), bearish (red), and neutral (gray) colors.
- Line style (dotted, dashed, solid).
- Label Settings :
- Enable/disable labels.
- Customize label size (tiny, small, normal, large, huge) and text color.
- Custom text for each meter’s label (Trend, Bias, VWAP, HTF, RTH).
Notes:
- Optimized for intraday trading (e.g., 1m, 5m, 15m) but adaptable to any timeframe.
- RTH and opening range calculations are tailored for US markets (EST timezone); adjust session times in the code for other markets.
- Higher timeframe analysis enhances context for multi-timeframe strategies.
Ideal For:
- Intraday traders targeting RTH breakout opportunities.
- Swing traders aligning with higher timeframe trends.
- Traders using VWAP and EMA-based strategies for trend and momentum analysis.
- Those seeking a clean, customizable dashboard for multi-metric market analysis.

ADX Trend Strength Filter + TRAMA [DotGain]Summary
Are you tired of trading trend signals, only to get stopped out in volatile, sideways chop?
The ADX Trend Strength Filter (ADX TSF) is designed to solve this exact problem. It is a comprehensive trend-following system that only generates signals when a trend not only has the right direction and momentum, but also sufficient strength.
This indicator filters out weak or indecisive market phases (the "chop") and will only color the bars Green or Red when all conditions for a strong, confirmed trend are met.
⚙️ Core Components and Logic
The ADX TSF relies on a triple-filter logic to generate a clear trade signal:
Trend Filter (TRAMA): A TRAMA (Trending Adaptive Moving Average) is used as the main trendline. This adaptive average automatically adjusts to market volatility, acting as a dynamic support/resistance level.
Price > TRAMA = Bullish
Price < TRAMA = Bearish
Momentum Filter (RSI Crossover): Momentum is measured by a crossover of two moving averages of the RSI (a fast EMA and a slow SMA). This confirms whether the momentum is pointing in the same direction as the trend.
Strength Filter (ADX): This is the most important filter. A signal is only considered valid if the ADX (Average Directional Index) is above a defined threshold (Default: 30). This ensures the trend has sufficient strength.
🚦 How to Read the Indicator
The indicator has three states, displayed directly as bar colors on your chart:
🟩 GREEN BARS (Strong Uptrend) All three conditions are met:
Price is above the TRAMA.
RSI momentum is bullish (Fast MA > Slow MA).
ADX is above 30 (Strong trend is present).
🟥 RED BARS (Strong Downtrend) All three conditions are met:
Price is below the TRAMA.
RSI momentum is bearish (Fast MA < Slow MA).
ADX is above 30 (Strong trend is present).
🟧 ORANGE BARS (Neutral / Caution) This state appears if any of the following conditions are true:
Weak Trend: The ADX is below 30. The market is in consolidation or a sideways phase. (This is the primary filter!)
Indecision: The price is caught in the "Neutral Zone" between the TRAMA and the 200 SMA.
Visual Elements
Bar Colors: (Green/Red/Orange) Show the current trend status.
TRAMA (Orange Line): Your primary adaptive trendline.
200 SMA (White Line): Serves as a reference for the long-term trend.
Orange Background (Fill): Fills the area between the TRAMA and SMA to visually highlight the "Neutral Zone."
Key Benefit
The goal of the ADX TSF is to keep traders out of weak, unpredictable markets and help them participate only in strong, momentum-confirmed trends.
Have fun :)
Disclaimer
This "Buy The F*cking Dip" (BTFD) indicator is provided for informational and educational purposes only. It does not, and should not be construed as, financial, investment, or trading advice.
The signals generated by this tool (both "Buy" and "Sell") are the result of a specific set of algorithmic conditions. They are not a direct recommendation to buy or sell any asset. All trading and investing in financial markets involves substantial risk of loss. You can lose all of your invested capital.
Past performance is not indicative of future results. The signals generated may produce false or losing trades. The creator (© DotGain) assumes no liability for any financial losses or damages you may incur as a result of using this indicator.
You are solely responsible for your own trading and investment decisions. Always conduct your own research (DYOR) and consider your personal risk tolerance before making any trades.

Trend & Strength Detector TSDTrend Strength Detector (TSD)
*Objective Trend Quality Measurement for Educational Market Analysis*
Note: This mathematical framework is a proprietary quantitative model developed by Ario Pinelab, inspired by classical EMA, ADX, RSI and MACD principles, yet not documented in any public technical or academic publication.
## 🎯 Purpose & Design Philosophy
The ** Trend Strength Detector- TSD ** is an educational research tool that provides **quantitative measurement of trend quality** through two independent scoring systems (0-100 scale). It answers the analytical question: *"How strong and aligned is the current market trend environment?"*
This indicator is designed with a **modular, complementary approach** to work alongside various analysis methodologies, particularly pattern-based recognition systems.
## 🔗 Complementary Research Framework
### Designed to Work With Pattern Detection Systems
This indicator provides **environmental context measurement** that complements qualitative pattern recognition tools. It works particularly well alongside systems like:
- **RMBS Smart Detector - Multi-Factor Momentum System**
- Traditional chart pattern analyzers
- Any momentum-based pattern identification tools
🔍 **To find RMBS Smart Detector:**
- Search in TradingView Indicators Library: `" RMBS Smart Detector - Multi-Factor Momentum System"`
- Look for: *Multi-Factor Momentum System*
- By author: ` `
### Why This Complementary Approach?
**Trend Quality Measurement** (TSD - this tool) provides:
- ✅ Structural trend alignment (0-100 score)
- ✅ Momentum intensity levels (0-100 score)
- ✅ Environment classification (Strong/Moderate/Weak)
- 📌 **Answers:** *"HOW STRONG is the underlying trend environment?"*
### Educational Research Value
When used together in a research context, these tools enable systematic study of questions like:
- How do reversal patterns behave when Strength Score is above 70 vs below 30?
- Do continuation patterns in weakening environments (declining scores) show different characteristics?
- What is the correlation between high Alignment Scores and pattern "success rates"?
- Can environment classification help identify genuine trend initiation vs false starts?
⚠️ **Important Note:** Both tools are **independent and work standalone**. TSD provides value whether used alone or with other analysis methods. The relationship with RMBS (or any pattern tool) is **complementary for research purposes**, not dependent.
---
###Mathematical Foundation
##TSA Formula: scoring method developed by Ario
-Trend Model (0 – 100)
TAS = EMA Alignment (0–40) + Price Position (0–30) + Trend Consistency (0–30)
EMA Alignment checks EMA_fast vs EMA_slow vs EMA_trend structure.
Price Position evaluates if Close is above/below all EMAs.
Consistency = 3 × max(bullish,bearish bars within 10 candles).
-Strength Model (0 – 100)
Strength = ADX (0–50) + EMA Slope (0–25) + RSI (0–15) + MACD (0–10)
ADX measures trend energy; Slope shows EMA momentum %;
RSI assesses zone positioning; MACD confirms directional agreement.
Note: This formula represents a proprietary quantitative model by Ario_Pinelab, inspired by classical technical concepts but not published in any external reference.________________________________________
📊 Environment Classification
Based on Total Strength Score:
🟢 Strong Environment: Score ≥ 60
→ Well-defined momentum, clear directional bias
🟡 Moderate Environment: 40 ≤ Score < 60
→ Mixed signals, transitional conditions
🔴 Weak Environment: Score < 40
→ Ranging, choppy, low conviction movement
Color Coding:
• Green background: Strong (≥60)
• Yellow background: Moderate (40-59)
• Red background: Weak (<40)
________________________________________
📈 Visual Components
Main Chart Display
Score Labels (Top-Right Corner):
┌─────────────────────────────────┐
│ 📊 Alignment: 75 | Strength: 82 │
│ Environment: Strong 🟢 │
└─────────────────────────────────┘
Color-Coded Background:
• Environment strength visually indicated via background color
• Helps quick identification of market regime
• Customizable transparency (default: 90%)
Reference Lines:
• Dotted line at 60: Strong/Moderate threshold
• Dotted line at 40: Moderate/Weak threshold
• Mid-line at 50: Neutral reference
________________________________________
🔧 Customization Settings
Input Parameters
The best setting is the default mode.
🚫 Important Disclaimers & Limitations
What This Indicator IS:
✅ Educational measurement tool for trend quality research
✅ Quantitative assessment of current market environment
✅ Complementary analysis tool for pattern-based systems
✅ Historical data analyzer for systematic study
✅ Multi-factor scoring system based on technical calculations
What This Indicator IS NOT:
❌ NOT a trading system or signal generator
❌ NOT financial advice or trade recommendations
❌ NOT predictive of future price movements
❌ NOT a guarantee of pattern success/failure
❌ NOT a substitute for comprehensive risk management
________________________________________
Known Limitations
1. Lagging Nature:
⚠️ All components (EMA, ADX, RSI, MACD) are calculated
from historical price data
→ Scores reflect CURRENT and RECENT conditions
→ Cannot predict sudden reversals or black swan events
→ Trend measurements lag actual price turning points
2. Whipsaw Risk:
⚠️ In choppy/ranging markets, scores may fluctuate rapidly
→ Moderate zone (40-60) can see frequent transitions
→ Low timeframes more susceptible to noise
→ Consider higher timeframes for stable measurements
3. Component Conflicts:
⚠️ Individual components may disagree
→ Example: Strong ADX but weak RSI alignment
→ Scores average these conflicts (may hide nuance)
→ Check individual components for deeper insight
4. Not Predictive:
⚠️ High scores do NOT guarantee continuation
⚠️ Low scores do NOT guarantee reversal
→ Measurement ≠ Prediction
→ Use for CONTEXT, not SIGNALS
→ Combine with comprehensive analysis
________________________________________
Risk Acknowledgments
Market Risk:
• All trading involves substantial risk of loss
• Past performance (even systematic studies) does not guarantee future results
• No indicator, system, or methodology can eliminate market risk
Measurement Limitations:
• Scores are mathematical calculations, not market predictions
• Environmental classification is descriptive, not prescriptive
• Strong measurements can deteriorate rapidly without warning
Educational Purpose:
• This tool is designed for LEARNING about market structure
• Not designed, tested, or validated as a standalone trading system
• Any trading decisions are user’s sole responsibility
No Warranty:
• Indicator provided “as-is” for educational purposes
• No guarantee of accuracy, reliability, or profitability
• Users must verify calculations and apply critical thinking
Open Source
Full Pine Script code available for educational study and modification. Feedback and improvement suggestions welcome.
“All logic is presented for research and educational visualization.”
---

Directional Strength and Momentum Index█ OVERVIEW
“Directional Strength and Momentum Index” (DSMI) is a technical analysis indicator inspired by DMI, but due to different source data, it produces distinct results. DSMI combines direction measurement, trend strength, and overheat levels into a single index, enhanced with gradient fills, extreme zones, entry signals, candle coloring, and a summary table.
█ CONCEPT
The classic DMI, despite its relatively simple logic, can seem somewhat chaotic due to separate +DI and -DI lines and the need for manual interpretation of their relationships. The DSMI indicator was created to increase clarity and speed up results, consolidating key information into a single index from 0 to 100 that simultaneously:
- Indicates trend direction (bullish/bearish)
- Measures movement strength
- Identifies overheat levels
- Generates ready entry signals
DMI (ADX + +DI / -DI) measures trend direction and strength, but does so based solely on comparing price movements between candles. ADX shows whether the trend is orderly and growing (e.g., above 20–30), but does not assess how dynamic the movement is.
DSMI, on the other hand, takes into account candle size and actual market aggression, thus showing directional momentum — whether the trend has real “fuel” to sustain or accelerate, not just whether it is orderly.
The main calculation difference involves replacing True Range with candle size (high-low) and using directional EMA instead of Wilder smoothing. This allows DSMI to react faster to momentum changes, eliminating delays typical of classic DMI based on TR.
This gives the trader an immediate picture of the market situation without analyzing multiple lines.
█ FEATURES
DSMI Main Line:
- EMA(Directional Index) based on +DS and -DS
- Scale 0–100, smooth color gradient depending on strength
+DS / -DS:
- Positive and Negative Directional Strength
- Gradient fill between lines — more intense with stronger trend
Extreme Zones:
- Default 20 and 80
- Gradient fill outside zones
Trend Strength Levels:
- Weak (<10) → neutral
- Moderate (up to 35)
- Strong (up to 45)
- Overheated (up to 55)
- Extreme (>55)
All levels editable
Entry Signals:
- Activated on crossing entry level (default 20)
Or on direction change when DSMI already ≥ entry level
- Highlighted background (green/red)
Candle Coloring:
- According to current trend
Trend Strength Table:
- Top-right corner
- Shows current strength (WEAK/STRONG etc.) + DSMI value
Alerts:
- DSMI Bullish Entry
- DSMI Bearish Entry
█ HOW TO USE
Add to Chart: Paste code in Pine Editor or find in indicator library.
Settings:
DSMI Parameters:
- DSMI Period → default 20
- Show DSMI Line → on/off
Extreme Zones:
- Lower Level → default 20
- Upper Level → default 80
Trend Strength Levels:
- Weak, Moderate, Strong, Overheated → adjust to strategy
Trend Colors:
- BULLISH → default green
- BEARISH → default red
- NEUTRAL → gray
Entry Signals:
- Show Highlight → on/off
- DSMI Entry Level → default 20
Signal Interpretation:
- DSMI Line: Main strength indicator.
- Gradient between +DS and -DS: Visualizes side dominance.
- Crossing 18 with direction confirmation → entry signal.
- Extreme Zones: Potential reversal or continuation points after correction.
- Table: Quick overview of current trend condition.
█ APPLICATIONS
The indicator works well in:
- Trend-following: Enter on signal, exit on direction change or overheat. When a new trend appears, consider entering a position, preferably with a rising trend strength indicator.
- Scalping/daytrading: Shorter period (7–10), lower entry level.
- Swing/position: Longer period (20–30), higher entry level, extreme zones as filters.
- Noise filtering: Ignores consolidation below “Weak” – increasing value e.g. to 15 highlights consolidation zones, but no signals appear there.
Style Adjustment:
- Aggressive strategies → shorten period and entry level
- Conservative → extend period, raise entry level (25–30), watch “Overheated”
“Weak” level (<10 default) → neutral; increasing it e.g. to 15 gives fewer but higher-quality signals. The Weak zone value controls the level below which no signals appear, and the gradient turns gray (often aligned with consolidation zones).
Combine with:
- Support/resistance levels
- Fair Value Gaps (FVG)
- Volume (Volume Profile, VWAP)
- Other oscillators (RSI, Stochastic)
█ NOTES
- Works on all markets and timeframes.
- Adjust period and levels to instrument volatility.
- Higher entry level → fewer signals, higher quality.
- Neutral color below “Weak” – avoids trading in consolidation.
- Gradient and table enable quick assessment without line analysis.

ORB + Liquidity Sweeps**Title:** ORB + Liquidity Sweeps
**Description:**
The **“ORB + Liquidity Sweeps”** indicator combines the *Opening Range Breakout (ORB)* model with dynamic *liquidity sweep detection* to identify high-probability reversal or continuation setups during key session periods. This script visually maps where price sweeps liquidity at highs/lows and tracks how those sweeps interact with the defined ORB range — offering clear, data-driven confluence zones for professional intraday execution.
---
### 🔹 FEATURES OVERVIEW
**1. Liquidity Sweeps **
* Detects **bullish** and **bearish liquidity grabs** using swing highs/lows based on user-defined pivot length.
* Supports three detection modes:
* **Only Wicks:** Marks when price pierces a level with a wick and rejects.
* **Only Outbreaks & Retest:** Confirms full breaks and retests.
* **Wicks + Outbreaks & Retest:** Combines both behaviors for full context.
* Automatically shades sweep zones and extends them until price mitigates or breaks through.
* Visuals:
* 🟩 **Bullish sweeps** = green wick/zone
* 🟥 **Bearish sweeps** = red wick/zone
* Configurable color transparency, max bar extension, and style options.
* Generates real-time **alerts** for each sweep:
* `🔼 Bullish Wick Sweep detected`
* `🔽 Bearish Wick Sweep detected`
---
**2. Opening Range Breakout (ORB)**
* Automatically defines the **Opening Range** using a customizable session window (default: *09:30–09:45 EST*).
* Tracks **ORB High** and **ORB Low** in real time.
* Displays the range only on intraday charts within the selected time window.
* Sends breakout alerts:
* `ORB Breakout Up` → Price crosses above ORB high.
* `ORB Breakout Down` → Price crosses below ORB low.
* Ideal for identifying initial volatility expansion zones and potential directional bias for the session.
---
**3. ORB–Liquidity Sweep Interaction**
* Highlights when **liquidity sweep zones overlap or touch the ORB range**, signaling a high-interest confluence zone.
* Issues alerts when interaction occurs:
* `Bull Sweep interacts with ORB`
* `Bear Sweep interacts with ORB`
* Useful for traders looking to align **liquidity events with session structure** to time entries.
---
**4. Built-in Alert System**
All alerts are pre-configured and can be activated directly from the TradingView “Add Alert” menu:
* **Bullish Wick Sweep**
* **Bearish Wick Sweep**
* **ORB Breakout Up**
* **ORB Breakout Down**
* **Bull Sweep interacts with ORB**
* **Bear Sweep interacts with ORB**
---
### ⚙️ HOW TO USE
1. **Add to Chart:** Apply on any intraday timeframe (preferably 1–15 min).
2. **Configure ORB Window:** Set the session start and duration (e.g., `09:30–09:45`options , 08:30 -08:45 futures ) for your trading region.
3. **Select Sweep Mode:** Choose from “Only Wicks,” “Only Outbreaks & Retest,” or “Wicks + Outbreaks & Retest.”
4. **Watch for Confluence:**
* A **sweep near ORB levels** often signals exhaustion or potential reversal.
* A **breakout through ORB following a sweep** suggests momentum continuation.
5. **Set Alerts:** Enable relevant alerts for automatic notifications when sweeps or ORB breaks occur.
---
### 📊 TRADING APPLICATIONS
* Identify **stop hunts** and **liquidity grabs** around ORB levels.
* Combine with volume, delta, or order flow indicators for confirmation.
* Use confluence zones (Sweep + ORB overlap) as **entry or take-profit** points.
* Excellent for **index futures**, **forex**, and **high-volume equities** during the opening session.
---
**Developed by:** SB
**Category:** Price Action / Liquidity / Session Structure
**Compatible Timeframes:** Intraday (1m–5m recommended)
**Alerts Included:** ✅
**Overlay:** Yes
**Version:** v6
---
*This tool is designed for advanced price-action traders who study liquidity behavior, ORB structure, and intraday expansion patterns.*
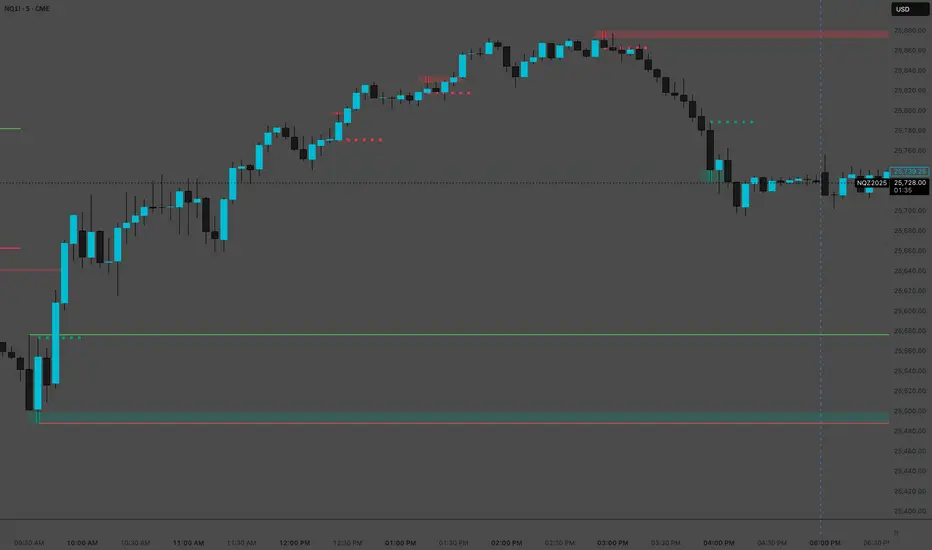
X Tail that Wagsintraday session-framework and ETH-anchored VWAP tool for TradingView. It draws today’s OVN (ETH) high/mid/low, today’s RTH-day open, previous day open/high/low, and a carried ETH VWAP handle (yesterday’s 4:00 PM NY VWAP, projected forward) to give you a clean, non-repainting scaffold for bias, structure, and execution. All timestamps are New York–local with DST handled explicitly, so historical sessions align correctly across time changes.
Key Capabilities
ETH OVN Range (18:00 → 09:30 NY)
Captures the rolling overnight high/low and computes the mid; at 09:30 NY it locks those levels and extends them to 16:00 NY (same day).
Optional labels (size/color configurable) placed slightly to the right of the 4 PM timestamp for readability.
Daily Handles (Today & Previous Day)
Today’s open line starts at the ETH open (anchor preserved) and extends toward 4 PM NY (or up to the “current bar + 5 bars” cap), with label control.
Previous day open/high/low plotted as discrete reference lines for carry-over structure.
ETH-Anchored VWAP (Live) + Bands
ETH-anchored VWAP runs only during the active ETH session (DST-aware).
Optional VWAP bands (0.5×, 1.0×, 2.0× multipliers) plotted as line-break series.
Carried ETH VWAP Handle (PD 4 PM Snapshot)
At 16:00 NY, the script snapshots the final ETH VWAP value.
On the next ETH open, it projects that value as a static dashed line through the session (non-mutating, non-repainting), with optional label.
Labeling & Styling
Single-toggle label system with color and five sizes.
Per-line color/width controls for quick visual hierarchy.
Internal “tail” logic keeps right endpoints near price (open-anchored lines extend to min(4 PM, now + 5 bars)), avoiding chart-wide overdraw.
Robust Session Logic
All session boundaries computed in NY local time; DST rules applied for historical bars.
Cross-midnight windows handled safely (no gaps or misalignment around day rolls).
Primary Use Cases
Session Bias & Context
Use OVN H/M/L and today’s open to define structural bias zones before RTH begins. A break-and-hold above OVN mid, for example, can filter long ideas; conversely, rejection at OVN high can warn of mean reversion.
Carry-Forward Mean/Value Reference
The carried ETH VWAP (PD 4 PM) acts as a “value memory” line for the next day. Traders can:
Fade tests away from it in balanced conditions,
Use it as a pullback/acceptance gauge during trends,
Track liquidity grabs when price spikes through and reclaims.
Execution Planning & Risk
Anchor stops/targets around PD H/L and OVN H/M/L for well-defined invalidation.
Combine with your entry model (order-flow, momentum, or pattern) to time fades at range extremes or momentum breaks from OVN mid.
Confluence Mapping
Layer the tool with opening range tools, HTF zones, or profile/VWAPs (weekly/daily) to spot high-quality confluence where multiple references cluster.
Regime & Day-Type Read
Quickly see whether RTH accepts/rejects the OVN range or gravitates to PD VWAP handle, helping classify the day (trend, balanced, double-distribution, etc.).
Quick Start
Apply to your intraday chart (any instrument supported by TradingView; best on ≤15m for live intraday context).
In Current Day group, keep Open and OVN HL on; optionally display the mid.
In Previous Day group, enable PD Open/HL for carry-over levels.
Enable AVWAP if you want live ETH-anchored VWAP and its Bands for distance context.
Keep PD VWAP on to project yesterday’s 4 PM ETH VWAP as a static dashed line into today.
Use the Label group to size/color the on-chart tags.
Settings Overview (Plain-English)
Label: Toggle labels on/off; choose label text color and size.
Current Day:
Open (color/width) — daily open line anchored at ETH open.
OVN HL (and Mid) — overnight high/low and midpoint, locked at 09:30 and extended to 16:00.
AVWAP + Bands — ETH-anchored VWAP with optional 0.5×/1×/2× bands.
Previous Day:
PD Open/HL — yesterday’s daily handles.
PD VWAP — the carried snapshot of yesterday’s 4 PM ETH VWAP projected forward (dashed).
Notes & Best Practices
Time Zone: All session logic is hard-coded to America/New_York and DST-robust. No manual DST tweaks required.
Non-Repainting: The carried PD VWAP line is a snapshot; once drawn, it does not back-fill or mutate.
Intraday Use: Designed for intraday execution. It will display on higher TFs, but the session granularity is most informative at ≤15m.
Performance: Script caps lines/labels (500) and uses short “tails” to keep charts responsive.
Compatibility: Uses request.security(..., "D", series, lookahead_on) intentionally to lock daily handles early for planning; this is by design.
Typical Playbook Examples
Fade Extremes in Balance: As RTH opens inside OVN, look for rejection wicks at OVN High with confluence from PD VWAP handle overhead; risk above OVN High.
Trend Continuation: In directional sessions, acceptances above OVN Mid with price pulling back to the live ETH VWAP can offer continuation entries.
Reversion to Value: Sharp extensions away from the carried PD VWAP that quickly stall often revert to that handle; use it as a target or as an acceptance test.
