7EMA_5MA (G/D + Bias + 12/26 Signal)This script alow you to survey multiple crossing signals as Golden/Death cross (MA50/200), Institutional Bias (EMA9/18), or EMA 12/26 crossing. You can show/hide all EMAs/MAs and show/hide all signals. Default config displays EMA 50/100/200 and MA 20. Full script includes display of EMA 9/18/12/26/50/100/200 and MA 20/21/50/100/200.
Recherche dans les scripts pour "200亿美元是多少人民币"

Sequentially Filtered Moving AverageThe previously proposed sequential filter aimed to filter variations lower than a certain period, this allowed to remove noisy variations and retain only the closing price values that occurred after a consecutive up/down, however because of the noisy nature of the closing price large filtering was impossible, in order to tackle to this problem the same indicator using a simple moving average as input is proposed, this allow for smoother results.
We will see that the proposed indicator can provide an alternative moving average that could be used as slow moving average in crossover systems.
The Indicator
The length parameter as the same function as the one described in the sequential filter post, however here length also control the period of the moving average used input, in short larger values of length will return a smoother but less reactive output.
In blue the moving average with length = 200, and in red the moving average with length = 50.
It is interesting to see how the moving average remain flat during ranging/flat market periods
Unfortunately like the sequential filter the sequentially filtered moving average (SFMA) is not affected by large short term variations such as gaps or short term volatile events. This is because of the nature of the sequential filter to ignore movements amplitude and only focus on the variation period.
Moving Average Crossover System
The SFMA is equal to a simple moving average of period length when a consecutive up/down sequence of size length has occurred, else the SFMA is equal to its precedent value, therefore we could expect less crosses between a fast moving average and the SFMA as slow moving average.
We can see on the figure above that the fast moving average of period 50 (in green) cross more with the slow moving average of period 200 (in red) than with the SFMA of period 200 (in blue).
Crosses can occur at the same time as with the classical slow moving average (in red) or a bit later.
Conclusion
A new moving average based on the recently proposed sequential filter has been proposed, it can be seen that under a moving average crossover system the proposed moving average seems to be more effective at producing less crosses without necessarily doing it with an excessive lag, in fact the moving average has either lag (length-1)/2 or lag length .
In the future it could be interesting to provide an hybrid alternative that take into account volatility as well as variations period.
Thanks for reading !

Multicolor Bollinger Bands - Market PhasesHi everyone
Hope you're all doing well 😘
Today I feel gracious and decided to give to the community. And giving not only an indicator but also a trading method
This trading method shows how a convergence based on moving averages is tremendous
Multicolour Bollinger Bands indicator that indicates market phases.
It plots on the price chart, thanks to different color zones between the bands, a breakdown of the different phases that the price operates during a trend.
The different zones are identified as follows:
- red color zone: trend is bearish, price is below the 200 periods moving average
- orange color zone: price operate a technical rebound below the 200 periods moving average
- yellow color zone: (phase 1 which indicate a new bearish cycle)
- light green zone: (phase 2 which indicate a new bullish cycle)
- dark green zone: trend is bullish, price is above the 200 periods moving average
- grey color zone: calm phase of price
- dark blue color zone: price is consolidating in either bullish or bearish trend
- light blue zones: price will revert to a new opposite trend (either long or short new trend)
By identifying clearly the different market phases with the multicolor Bollinger bands, the market entries by either a the beginning of a new trend or just after a rebound or a consolidating phase is easier to spot on.
Trade well and trade safe
Dave

EMA - Baby WhaleThis script will show you the 8, 13, 21, 55, 100 and 200 EMA .
You can change the colors yourself if you want.
You can use the EMA to define the trend.
A good strategy that traders use is a 55 EMA crossover.
This means that when the 8, 13 and 21 all cross the 55 EMA you place a buy or sell order.
You close your position when the same thing happens on the other side.
Another great way that traders use these EMA's is to spot a Golden or Death cross.
When the 55 and 200 EMA cross and the 200 becomes support it means we're in a uptrend and vice versa.
If you want access, just send a message please.
Much love from Baby Whale!!
🙏❤️🐳

BTC 1D Alerts V1This script contains a variety of key indicator for bitcoin all-in-one and they can be activated individually in the menu. These are meant to be used on the 1D chart for Bitcoin.
1457 Day Moving Average: the bottom of the bitcoin price and arguably the rock bottom price target.
Ichimoku Cloud: a common useful indicator for bitcoin support and resistance.
350ma fibs (21 8 5 3 2 and 1.6) : Signify the tops of each logarthmic rise in bitcoin price. They are generally curving higher over the long term. For halvening #3, the predicted market crash would be after hitting the 350ma x3 fib. Also the 350 ma / 111 ma cross signifies bull market top within about 3 days as well. Using the combination of the 350ma fibs and the 350/111 crosses, reasonably identify when market top is about to occur.
50,120,200 ma: Common moving averages that bitcoin retests during bull market runs. Also, the 50/200 golden and death crosses.
1D EMA Superguppy Ribbons: green = bull market, gray is indeterminate, red = bear market. Very high specificity indicator of bull runs, especially for bitcoin. You can change to 3D candle for even more specificity for a bull market start. Use the 1W for even more specificity. 1D Superguppy is recommended for decisionmaking.
1W EMA21: a very good moving average programmed to be shown on both the daily and weekly candle time. Bitcoin commonly corrects to this repeatedly during past bull runs. Acts as support during bull run and resistance during a bear market.
Steps to identifying a bull market:
1. 50/200 golden cross
2. 1D EMA superguppy green
3. 3D EMA superguppy green (if you prefer more certainty than step 2).
4. Hitting the 1W EMA21 and bouncing off during the bull run signifies corrections.
Once a bull market is identified,
Additional recommended buying and selling techniques:
Indicators:
- Fiblines - to determine retracements from peaks (such as all time high or recent highs)
- Stochastic RSI - 1d, 3d, and 1W SRSI are great time to buy, especially the 1W SRSI which comes much less frequently.
- volumen consolidado - for multi exchange volumes compiled into a single line. I prefer buying on the lowest volume days which generally coincide with dips.
- MACD - somewhat dubious utility but many algorithms are programmed to buy or sell based on this.
Check out the Alerts for golden crosses and 350ma Fib crosses which are invaluable for long term buying planning.
I left this open source so that all the formulas can be understood and verified. Much of it hacked together from other sources but all indicators that are fundamental to bitcoin. I apologize in advance for not attributing all the articles and references... but then again I am making no money off of this anyway.

Ultimate Moving Average Package (17 MA's)Included is the:
VWAP
Current time frame 10 EMA
Current time frame 20 EMA
Current time frame 50 EMA
Current time frame 10 SMA
Current time frame 20 SMA
Current time frame 50 SMA
Daily 10 EMA
Daily 20 EMA
Daily 50 EMA
Daily 50 SMA
Daily 100 SMA
Daily 200 SMA
Weekly 100 SMA
Weekly 200 SMA
Monthly 100 SMA
Monthly 200 SMA
All Daily/Weekly/Monthly MA's can be seen on intraday charts. Current time frame MA's change depending on your time frame. Obviously you dont need all 17 on your chart but you can pick the ones you like and disable the rest.

Fischy Bands (multiple periods)Just a quick way to have multiple periods. Coded at (14,50,100,200,400,600,800). Feel free to tweak it. Default is all on, obviously not as usable! Try just using 14, and 50.
This was generated with javascript for easy templating.
Source:
```
const periods = ;
const generate = (period) => {
const template = `
= bandFor(${period})
plot(b${period}, color=colorFor(${period}, b${period}), linewidth=${periods.indexOf(period)+1}, title="BB ${period} Basis", transp=show${period}TransparencyLine)
pb${period}Upper = plot(b${period}Upper, color=colorFor(${period}, b${period}), linewidth=${periods.indexOf(period)+1}, title="BB ${period} Upper", transp=show${period}TransparencyLine)
pb${period}Lower = plot(b${period}Lower, color=colorFor(${period}, b${period}), linewidth=${periods.indexOf(period)+1}, title="BB ${period} Lower", transp=show${period}TransparencyLine)
fill(pb${period}Upper, pb${period}Lower, color=colorFor(${period}, b${period}), transp=show${period}TransparencyFill)`
console.log(template);
}
console.log(`//@version=4
study(shorttitle="Fischy BB", title="Fischy Bands", overlay=true)
stdm = input(1.25, title="stdev")
bandFor(length) =>
src = hlc3
mult = stdm
basis = sma(src, length)
dev = mult * stdev(src, length)
upper = basis + dev
lower = basis - dev
`);
periods.forEach(e => console.log(`show${e} = input(title="Show ${e}?", type=input.bool, defval=true)`));
periods.forEach(e => console.log(`show${e}TransparencyLine = show${e} ? 20 : 100`));
periods.forEach(e => console.log(`show${e}TransparencyFill = show${e} ? 80 : 100`));
console.log('\n');
console.log(`colorFor(period, series) =>
c = period == 14 ? color.white :
period == 50 ? color.aqua :
period == 100 ? color.orange :
period == 200 ? color.purple :
period == 400 ? color.lime :
period == 600 ? color.yellow :
period == 800 ? color.orange :
color.black
c
`);
periods.forEach(e => generate(e))
```

MACD/EMA Long StrategyThis incredibly simple strategy uses a combination of the 20 EMA and bullish/bearish MACD crosses as a low risk method of getting in and out of markets.
Depending on whether the market is above or below the 200 SMA, the script determines if the market is in bullish or bearish territory. Above the 200 SMA, the script will ignore the 20 EMA as a buy condition and buy solely on the confirmation of a bullish MACD cross upon the close of a candle. In this bullish market, the script will only enable the sell condition if both the MACD is bearish AND a close below the 20 EMA occurs. This is to reduce the chances of the script selling prematurely in the event of a bearish MACD cross, if the market is still in overall bullish territory.
When the market is below the 200 SMA, the confirmation occurs in the opposite direction. The buy condition will only be met if both the MACD is bullish AND a close above the 20 EMA occurs. However, the sell condition ignores the 20 EMA and will sell solely on the confirmation of a bearish MACD cross upon the close of the candle.
This strategy can be used in both bullish and bearish markets. This conservative strategy will slightly underperform in a bull market, with the sell condition occasionally being met and then potentially buying back higher. However, it will successfully get you out of a turning market and automatically switch into a more 'risk-off' mentality during a bear market. This strategy is not recommended for sideways markets, as trading around the 20 EMA coupled with a relatively flat MACD profile can cause the strategy to buy the peaks and sell troughs easily.

market phases - JDThis indicator shows the relation of price against different period ma's.
When put in daily Timeframe it gives the 1400 Day (= 200 Weekly) and the 200 ,100 an 50 Daily.
The lines show the 200,100 and 50 ma in relation to the 1400 ma.
JD.
#NotTradingAdvice #DYOR

Trend Lines and MoreMulti-Indicator consisting of several useful indicators in a single package.
TREND LINES
-By default the 20 SMA and 50 SMA are shown.
-Use "MOVING AVERAGE TYPE" to select SMA, EMA, Double-EMA, Triple-EMA, or Hull.
-Use "50 MA TREND COLOR" to have the 50 turn green/red for uptrend/downtrend.
-Use "DAILY SOURCE ONLY" to always show daily averages regardless of timeframe.
-Use "SHOW LONG MA" to also include 100, 150, and 200 moving averages.
-Use "SHOW MARKERS" to show a small colored marker identifying which line is which.
OTHER INDICATORS
-You can show Bollinger Bands and Parabolic SAR.
-You can highlight key reversal times (9:50-10:10 and 14:40-15:00).
-You can show price offset markers, where was the price "n" periods ago.
That last one is useful to show the level of prices which are about to "fall off" the moving average
and be replaced with current price. So for example, if current price is significantly below the
200-days-ago price, you can gauge the difficulty for the 200 MA to start climbing again.

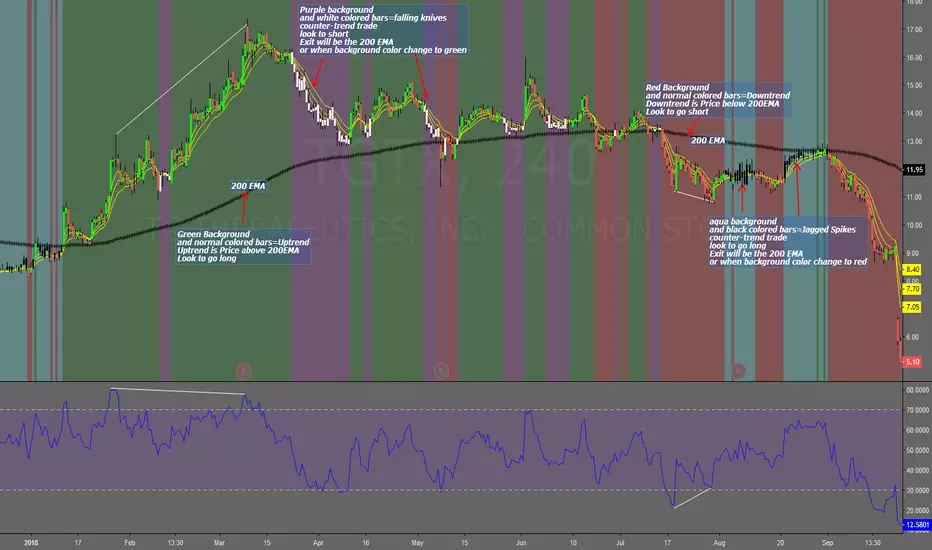
Falling Knives Jagged SpikesThe purpose of this script is to trade with the trend, trade trend continuation, and counter-trend trades.
Uptrend is price above 200 ema: Background is green and the bar colors are normal
Downtrend is price below 200 ema: Background is red and the bar colors are normal
Counter-trend to uptrend--Bar colors are white and the background is purple
counter-trend to downtrend--Bar colors are black and the background is aqua.
How to use:
Uptrend (green background): Only go long
Downtrend (red background): only go short
Counter-trend to uptrend/downtrend (white bars/black bars): Take counter-trend trade when price is a substantial distance from the 200 EMA. Best if there was a divergence with an oscillator. A lot of times these are just deep pullbacks or rallies.
trend continuation: In uptrend, after falling knives, and trend continues up (background turns to green) look to buy, you are getting a great price on the asset. Same for downtrend.
Keep in mind that nothing is perfect, and to of-course test everything.
Best of luck in all you do. Get money.
3 EMAS strategy to define trendsBasic script that allows you to have 3 scripts all in one EMA (exponential moving averages). They are useful to know the general trends of your chart: current long-term trend, short-term (or immediately) and general.
1 ° EMA 36 serves to define or mark action of the market trend price.
At the moment of crossing EMA 36 with EMA 200 upwards it indicates continuation to level 2 ...
2 ° EMA 200 serves as support or resistance according to the case, confirms continuation of trend in medium or long term when crossing with EMA 500, upward trend probability level 3 confirmed. As the case may be, cross up or down.
3 ° EMA 500 serves as support or resistance of the price action.
EMAS 200 and 500 give you a probability of Starting Area ...
Confirming with support or resistance.
Complementation with Stochastics ..
MACD
Note: Remember that "exponential" means that these indicators give more weight to the most recent data, making them more reactive to price changes (react faster to changes in recent prices than simple moving averages)
GROWINGS CRYPTOTRADERS

Mayer Multiple @ Current PriceThough this script is by me, the original idea comes from a podcast I heard where Trace Mayer talks about how he does crypto valuation. It is based on current price against the 200 day moving average. This indicator script will simply plot that value as a label overlayed on your trading view chart. Best long term results occur when acquiring BTC when the multiple is 2.4 or less. For more info, google "mayer multiple" This script/indicator is strictly for educational purposes. It is not exclusive to bitcoin.
To get the best look out of your charts I make the following changes.
1.Apply the indicator to your chart.
2. In the tools palette of trading view, when looking at a chart, click "Show Objects Tree" the icon displayed above the trash can.
In the objects tree panel, click the preferences icon for "Mayer Multiple @ Current Price"
Switch "scale" to "scale Left"
3. Then for your chart preferences (right click on chart background and select "Properties", and be sure the following are checked on the "Scales" tab
Left Axis
Right Axis
Indicator Last Value
Indicator Labels
Screenshots are not allowed in this view, so I can't post screenshots, but the view above is what it should look like when you are done.
For anyone who wants to see the code, here is the code of the script:
Use at will, and at your own risk.
//@version=3
// Created By Timothy Luce, inspired by Trace Mayer's 200 Day SMA cryptocurrency valuation method
study("Mayer Multiple @ Current Price", overlay=true)
currentPrice = close
currentDay = security(tickerid, "D", sma(close, 200))
mayerMultiple = currentPrice/currentDay
plot(mayerMultiple, color=#00ffaa, transp=100)
If you want to change the color, change this line: #00ffaa

Multiple Moving AveragesThis is really simple. But useful for me as I don't have a paid account. No-pro users can only use 3 indicators at once and because I rely heavily on simple moving averages it can be a real pain.
This one indicator features:
20 MA
50 MA
100 MA
200 MA
which I find are the most useful overall. The 20 and 50 over all time frame but in particular < 1 day, the 100 and 200 at > 4 hr time frames. In general I don't use the 100 MA that much. The daily 200 MA is a critical support for many assets like stocks and cryptos. I'm by no means a pro and if you are learning I recommend becoming familiar with moving averages right at the beginning.
If you want to deactivate some of the lines, you can do it via the indicator's settings icon.

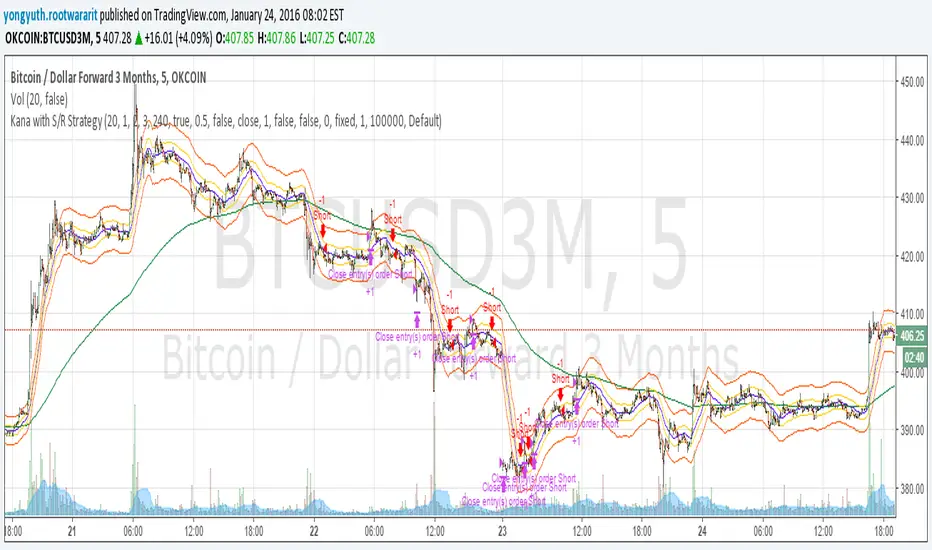
Yuthavithi Kana with S/R StrategyI have got the idea from this page iwongsakorn.com and wrote my own kana scalper. This strategy draws 3 200 ATR level along side with the sma. It uses 200 ema as trend. Once the price approaches the 20 ema. it will place orders according to trend and take profit and stop loss quickly using the 200 ATR lines.
This is a quick scalper strategy with winrate over 50%
3-Daumen-RegelThis indicator evaluates three key market conditions and summarizes them in a compact table using simple thumbs-up / thumbs-down signals. It’s designed specifically for daily timeframes and helps you quickly assess whether a market is showing technical strength or weakness.
The Three Checks
Price Above the 200-Day SMA
Indicates the long-term trend direction. A thumbs-up means the price is trading above the 200-day moving average.
Positive Performance During the First 5 Trading Days of the Year (YTD Start)
Measures early-year strength. If not enough bars are available, a warning is shown.
Price Above the YTD Level
Compares the current price to the first trading day’s close of the year.
Color Coding for Instant Clarity
Green: Condition met
Red: Condition not met
This creates a compact “thumbs check” that gives you a quick read on the market’s technical health.
Note
The indicator is intended for daily charts. A message appears if a different timeframe is used.

Daily Oversold Swing ScreenerThat script is a **Pine Script Indicator** designed to identify potential **swing trade entry points** on a daily timeframe by looking for stocks that are **oversold** but still in a **healthy long-term uptrend**.
It screens for a high-probability reversal setup by combining four specific technical conditions.
Here is a detailed breakdown of the script's purpose and logic:
---
## 📝 Script Description: Daily Oversold Swing Screener
This Pine Script indicator serves as a **momentum and trend confirmation tool** for active traders seeking short-to-intermediate-term long entries. It uses data calculated on the **Daily** timeframe to generate signals, regardless of the chart resolution you are currently viewing.
The indicator is designed to filter out stocks that are in a strong downtrend ("falling knives") and only signal pullbacks within an established uptrend, which significantly increases the probability of a successful swing trade bounce.
### 🔑 Key Conditions for a Signal:
The indicator generates a buy signal when **all four** of the following conditions are met on the Daily timeframe:
#### 1. Oversold Momentum
* **Condition:** `rsiD < rsiOS` (Daily RSI is below the oversold level, typically **30**).
* **Purpose:** Confirms that the selling pressure has been extreme and the stock is temporarily out of favor, setting up a potential bounce.
#### 2. Momentum Turning Up
* **Condition:** `rsiD > rsiPrev` (Current Daily RSI value is greater than the previous day's Daily RSI value).
* **Purpose:** This is the most crucial filter. It confirms that the momentum has **just started to shift upward**, indicating that the low may be in and the stock is turning away from the oversold region.
#### 3. Established Uptrend (No Falling Knives)
* **Condition:** `sma50 > sma200 and closeD > sma50` (50-day SMA is above the 200-day SMA, AND the current daily close is above the 50-day SMA).
* **Purpose:** This is a **long-term trend filter**. It ensures that the current oversold condition is just a **pullback** within a larger, structurally bullish market (50 > 200), and that the price is still holding above the short-term trend line (Close > 50 SMA). This effectively screens out weak stocks in continuous downtrends.
#### 4. Price at Support (Bollinger Bands)
* **Condition:** `closeD <= lowerBB` (Daily Close is less than or equal to the lower Bollinger Band).
* **Purpose:** Provides a secondary measure of extreme price deviation. When the price touches or breaches the lower band, it suggests a significant move away from the mean (basis), often signaling strong statistical support where price is likely to revert.
### 📌 Summary of Signal
The final signal (`signal`) is triggered only when the market is confirmed to be **in a healthy long-term trend (Condition 3)**, the price is at an **extreme support level (Condition 4)**, the momentum is **oversold (Condition 1)**, and most importantly, the **momentum has begun to reverse (Condition 2)**.

Mean Reversion — BB + Z-Score + RSI + EMA200 (TP at Opposite Z)This is a systematic mean-reversion framework for index futures and other liquid assets.
This strategy combines Bollinger Bands, Z-Score dislocation, RSI extremes, and a trend-filtering EMA200 to capture short-term mean-reversion inefficiencies in NQ1!. It is designed for high-volatility conditions and uses a precise exit model based on opposite-side Z-Score targets and dynamic mid-band failure detection.
🔍 Entry Logic (Mean Reversion) :
The strategy enters trades only when multiple confluence signals align:
Long Setup
Price at or below the lower Bollinger Band
Z-Score ≤ –Threshold (deep statistical deviation)
RSI ≤ oversold level
Price below the EMA-200 (countertrend mean-reversion only)
Cooldown must be completed
No open position
Short Setup
Price at or above the upper Bollinger Band
Z-Score ≥ Threshold
RSI ≥ overbought level
Price above the EMA-200
Cooldown complete
No open position
This multi-signal gate filters out weak reversions and focuses on mature dislocations.
🎯 Take-Profit Model: Opposite-Side Z-Score Target :
Once in a trade, take-profit is set by solving for the price where the Z-Score reaches the opposite side:
Long TP = Z = +Threshold
Short TP = Z = –Threshold
This creates a symmetric statistical exit based on reverting to equilibrium plus overshoot.
🛡️ Stop-Loss System (Volatility-Aware) :
Stop losses combine:
A fixed base stop (points)
A standard-deviation volatility component
This adapts the SL to regime changes and avoids being shaken out during rare volatility spikes.
⏳ Half-Life Exit :
If a trade has not reverted within a fixed number of bars, it automatically closes.
This prevents “mean-reversion traps” during trending periods.
📉 Advanced Mid-Band Exit Logic (BB Basis Failure) :
This is the unique feature of the system.
After entry:
Wait for price to cross the Bollinger Basis (middle band) in the direction of the mean.
Start a 5-bar delay timer.
After 5 bars, the strategy becomes “armed.”
Once armed:
If price fails back through the mean, exit immediately.
Intrabar exits trigger precisely (with tick-level precision if Bar Magnifier is enabled).
This protects profits and exits trades at the first sign of mean-failure.
⏱️ Cooldown System :
After each closed trade, a cooldown period prevents immediate re-entry.
This avoids clustering and improves statistical independence of trades.
🖥️ What This Strategy Is Best For :
High-volatility intraday NQ conditions
Statistical mean reversion with structured confluence
Traders who want clean, rule-based entries
Avoiding trend-day traps using EMA and half-life logic
📊 Included Visual Elements :
Bollinger Bands (Upper, Basis, Lower)
BUY/SELL markers at signal generation
Optional alerts for automated monitoring
🚀 Summary :
This is a precision mean-reversion system built around volatility bands, statistical dislocation, and price-behavior confirmation. By combining Z-Score, RSI, EMA200 filtering, and a sophisticated mid-band failure exit, this model captures high-probability reversions while avoiding the common pitfalls of naive band-touch systems.

Sequential Exhaustion 9/13 [Crypto Filter] - PyraTimeConcept: The Exhaustion Meter
This indicator is a customized version of the Sequential count, a powerful tool used by institutional traders to measure buyer and seller exhaustion. It looks for a sequence of 9 (Setup) or 13 (Countdown) consecutive candles that satisfy specific price criteria.
The purpose is simple: To tell you when a trend has run out of fuel.
Key Differentiators (The Value)
Due to the high volatility of the crypto market, standard Sequential indicators print too many false signals ("13s") during a strong trend. This custom version solves that problem with two core filters:
1. Trend Filter (EMA 200): If enabled, the indicator will automatically hide all Sell signals when the price is above the 200 EMA, protecting the user from shorting an uptrend (and vice-versa).
2. Color Confirmation: It will not print a signal unless the closing candle color matches the direction (e.g., no Red 13 sell signals on Green Candles). This drastically cleans up the chart.
Understanding the Numbers
The numbers appearing above and below the candles are your exhaustion meter.
* The "9" (Setup): Indicates a short-term trend is nearing exhaustion.
* The "13" (Countdown): Indicates the trend is statistically complete and a reversal is highly probable.
The Actionable Strategy (The PyraTime Rule)
This indicator is designed to be your Exit Tool. Use it to determine when to take profit from an existing trade.
* Example: You enter Long at the GPM Time Line. When the PyraTD prints a Red 9 or Red 13, you take profit immediately.
Final Note
Use the integrated visibility settings to turn off signals (e.g., hide 9s or Sells) to customize the view to your preferred trading style.
Disclaimer: This tool measures mathematical exhaustion and is part of the PyraTime system. It is not financial advice.

Expected Move BandsExpected move is the amount that an asset is predicted to increase or decrease from its current price, based on the current levels of volatility.
In this model, we assume asset price follows a log-normal distribution and the log return follows a normal distribution.
Note: Normal distribution is just an assumption, it's not the real distribution of return
Settings:
"Estimation Period Selection" is for selecting the period we want to construct the prediction interval.
For "Current Bar", the interval is calculated based on the data of the previous bar close. Therefore changes in the current price will have little effect on the range. What current bar means is that the estimated range is for when this bar close. E.g., If the Timeframe on 4 hours and 1 hour has passed, the interval is for how much time this bar has left, in this case, 3 hours.
For "Future Bars", the interval is calculated based on the current close. Therefore the range will be very much affected by the change in the current price. If the current price moves up, the range will also move up, vice versa. Future Bars is estimating the range for the period at least one bar ahead.
There are also other source selections based on high low.
Time setting is used when "Future Bars" is chosen for the period. The value in time means how many bars ahead of the current bar the range is estimating. When time = 1, it means the interval is constructing for 1 bar head. E.g., If the timeframe is on 4 hours, then it's estimating the next 4 hours range no matter how much time has passed in the current bar.
Note: It's probably better to use "probability cone" for visual presentation when time > 1
Volatility Models :
Sample SD: traditional sample standard deviation, most commonly used, use (n-1) period to adjust the bias
Parkinson: Uses High/ Low to estimate volatility, assumes continuous no gap, zero mean no drift, 5 times more efficient than Close to Close
Garman Klass: Uses OHLC volatility, zero drift, no jumps, about 7 times more efficient
Yangzhang Garman Klass Extension: Added jump calculation in Garman Klass, has the same value as Garman Klass on markets with no gaps.
about 8 x efficient
Rogers: Uses OHLC, Assume non-zero mean volatility, handles drift, does not handle jump 8 x efficient
EWMA: Exponentially Weighted Volatility. Weight recently volatility more, more reactive volatility better in taking account of volatility autocorrelation and cluster.
YangZhang: Uses OHLC, combines Rogers and Garmand Klass, handles both drift and jump, 14 times efficient, alpha is the constant to weight rogers volatility to minimize variance.
Median absolute deviation: It's a more direct way of measuring volatility. It measures volatility without using Standard deviation. The MAD used here is adjusted to be an unbiased estimator.
Volatility Period is the sample size for variance estimation. A longer period makes the estimation range more stable less reactive to recent price. Distribution is more significant on a larger sample size. A short period makes the range more responsive to recent price. Might be better for high volatility clusters.
Standard deviations:
Standard Deviation One shows the estimated range where the closing price will be about 68% of the time.
Standard Deviation two shows the estimated range where the closing price will be about 95% of the time.
Standard Deviation three shows the estimated range where the closing price will be about 99.7% of the time.
Note: All these probabilities are based on the normal distribution assumption for returns. It's the estimated probability, not the actual probability.
Manually Entered Standard Deviation shows the range of any entered standard deviation. The probability of that range will be presented on the panel.
People usually assume the mean of returns to be zero. To be more accurate, we can consider the drift in price from calculating the geometric mean of returns. Drift happens in the long run, so short lookback periods are not recommended. Assuming zero mean is recommended when time is not greater than 1.
When we are estimating the future range for time > 1, we typically assume constant volatility and the returns to be independent and identically distributed. We scale the volatility in term of time to get future range. However, when there's autocorrelation in returns( when returns are not independent), the assumption fails to take account of this effect. Volatility scaled with autocorrelation is required when returns are not iid. We use an AR(1) model to scale the first-order autocorrelation to adjust the effect. Returns typically don't have significant autocorrelation. Adjustment for autocorrelation is not usually needed. A long length is recommended in Autocorrelation calculation.
Note: The significance of autocorrelation can be checked on an ACF indicator.
ACF
The multimeframe option enables people to use higher period expected move on the lower time frame. People should only use time frame higher than the current time frame for the input. An error warning will appear when input Tf is lower. The input format is multiplier * time unit. E.g. : 1D
Unit: M for months, W for Weeks, D for Days, integers with no unit for minutes (E.g. 240 = 240 minutes). S for Seconds.
Smoothing option is using a filter to smooth out the range. The filter used here is John Ehler's supersmoother. It's an advance smoothing technique that gets rid of aliasing noise. It affects is similar to a simple moving average with half the lookback length but smoother and has less lag.
Note: The range here after smooth no long represent the probability
Panel positions can be adjusted in the settings.
X position adjusts the horizontal position of the panel. Higher X moves panel to the right and lower X moves panel to the left.
Y position adjusts the vertical position of the panel. Higher Y moves panel up and lower Y moves panel down.
Step line display changes the style of the bands from line to step line. Step line is recommended because it gets rid of the directional bias of slope of expected move when displaying the bands.
Warnings:
People should not blindly trust the probability. They should be aware of the risk evolves by using the normal distribution assumption. The real return has skewness and high kurtosis. While skewness is not very significant, the high kurtosis should be noticed. The Real returns have much fatter tails than the normal distribution, which also makes the peak higher. This property makes the tail ranges such as range more than 2SD highly underestimate the actual range and the body such as 1 SD slightly overestimate the actual range. For ranges more than 2SD, people shouldn't trust them. They should beware of extreme events in the tails.
Different volatility models provide different properties if people are interested in the accuracy and the fit of expected move, they can try expected move occurrence indicator. (The result also demonstrate the previous point about the drawback of using normal distribution assumption).
Expected move Occurrence Test
The prediction interval is only for the closing price, not wicks. It only estimates the probability of the price closing at this level, not in between. E.g., If 1 SD range is 100 - 200, the price can go to 80 or 230 intrabar, but if the bar close within 100 - 200 in the end. It's still considered a 68% one standard deviation move.

Single AHR DCA (HM) — AHR Pane (customized quantile)Customized note
The log-regression window LR length controls how long a long-term fair value path is estimated from historical data.
The AHR window AHR window length controls over which historical regime you measure whether the coin is “cheap / expensive”.
When you choose a log-regression window of length L (years) and an AHR window of length A (years), you can intuitively read the indicator as:
“Within the last A years of this regime, relative to the long-term trend estimated over the same A years, the current price is cheap / neutral / expensive.”
Guidelines:
In general, set the AHR window equal to or slightly longer than the LR window:
If the AHR window is much longer than LR, you mix different baselines (different LR regimes) into one distribution.
If the AHR window is much shorter than LR, quantiles mostly reflect a very local slice of history.
For BTC / ETH and other BTC-like assets, you can use relatively long horizons (e.g. LR ≈ 3–5 years, AHR window ≈ 3–8 years).
For major altcoins (BNB / SOL / XRP and similar high-beta assets), it is recommended to use equal or slightly shorter horizons, e.g. LR ≈ 2–3 years, AHR window ≈ 2–3 years.
1. Price series & windows
Working timeframe: daily (1D).
Let the daily close of the current symbol on day t be P_t .
Main length parameters:
HM window: L_HM = maLen (default 200 days)
Log-regression window: L_LR = lrLen (default 1095 days ≈ 3 years)
AHR window (regime window): W = windowLen (default 1095 days ≈ 3 years)
2. Harmonic moving average (HM)
On a window of length L_HM, define the harmonic mean:
HM_t = ^(-1)
Here eps = 1e-10 is used to avoid division by zero.
Intuition: HM is more sensitive to low prices – an extremely low price inside the window will drag HM down significantly.
3. Log-regression baseline (LR)
On a window of length L_LR, perform a linear regression on log price:
Over the last L_LR bars, build the series
x_k = log( max(P_k, eps) ), for k = t-L_LR+1 ... t, and fit
x_k ≈ a + b * k.
The fitted value at the current index t is
log_P_hat_t = a + b * t.
Exponentiate to get the log-regression baseline:
LR_t = exp( log_P_hat_t ).
Interpretation: LR_t is the long-term trend / fair value path of the current regime over the past L_LR days.
4. HM-based AHR (valuation ratio)
At each time t, build an HM-based AHR (valuation multiple):
AHR_t = ( P_t / HM_t ) * ( P_t / LR_t )
Interpretation:
P_t / HM_t : deviation of price from the mid-term HM (e.g. 200-day harmonic mean).
P_t / LR_t : deviation of price from the long-term log-regression trend.
Multiplying them means:
if price is above both HM and LR, “expensiveness” is amplified;
if price is below both, “cheapness” is amplified.
Typical reading:
AHR_t < 1 : price is below both mid-term mean and long-term trend → statistically cheaper.
AHR_t > 1 : price is above both mid-term mean and long-term trend → statistically more expensive.
5. Empirical quantile thresholds (Opp / Risk)
On each new day, whenever AHR_t is valid, add it into a rolling array:
A_t_window = { AHR_{t-W+1}, ..., AHR_t } (at most W = windowLen elements)
On this empirical distribution, define two quantiles:
Opportunity quantile: q_opp (default 15%)
Risk quantile: q_risk (default 65%)
Using standard percentile computation (order statistics + linear interpolation), we get:
Opp threshold:
theta_opp = Percentile( A_t_window, q_opp )
Risk threshold:
theta_risk = Percentile( A_t_window, q_risk )
We also compute the percentile rank of the current AHR inside the same history:
q_now = PercentileRank( A_t_window, AHR_t ) ∈
This yields three valuation zones:
Opportunity zone: AHR_t <= theta_opp
(corresponds to roughly the cheapest ~q_opp% of historical states in the last W days.)
Neutral zone: theta_opp < AHR_t < theta_risk
Risk zone: AHR_t >= theta_risk
(corresponds to roughly the most expensive ~(100 - q_risk)% of historical states in the last W days.)
All quantiles are purely empirical and symbol-specific: they are computed only from the current asset’s own history, without reusing BTC thresholds or assuming cross-asset similarity.
6. DCA simulation (lightweight, rolling window)
Given:
a daily budget B (input: budgetPerDay), and
a DCA simulation window H (input: dcaWindowLen, default 900 days ≈ 2.5 years),
The script applies the following rule on each new day t:
If thresholds are unavailable or AHR_t > theta_risk
→ classify as Risk zone → buy = 0
If AHR_t <= theta_opp
→ classify as Opportunity zone → buy = 2B (double size)
Otherwise (Neutral zone)
→ buy = B (normal DCA)
Daily invested cash:
C_t ∈ {0, B, 2B}
Daily bought quantity:
DeltaQ_t = C_t / P_t
The script keeps rolling sums over the last H days:
Cumulative position:
Q_H = sum_{k=t-H+1..t} DeltaQ_k
Cumulative invested cash:
C_H = sum_{k=t-H+1..t} C_k
Current portfolio value:
PortVal_t = Q_H * P_t
Cumulative P&L:
PnL_t = PortVal_t - C_H
Active days:
number of days in the last H with C_k > 0.
These results are only used to visualize how this AHR-quantile-driven DCA rule would have behaved over the recent regime, and do not constitute financial advice.

Trend Breakout & Ratchet Stop System [Market Filter]Description:
This strategy implements a robust trend-following system designed to capture momentum moves while strictly managing downside risk through a multi-stage "Ratchet" exit mechanism and broad market filters.
It is designed for swing traders who want to align individual stock entries with the overall market direction.
How it works:
1. Market Regime Filters (The "Safety Check") Before taking any position, the strategy checks the health of the broader market to avoid "catching falling knives."
Broad Market Filter: By default, it checks NASDAQ:QQQ (adjustable). If the benchmark is trading below its SMA 200, the strategy assumes a Bear Market and suppresses all new long entries.
Volatility Filter (VIX): Uses CBOE:VIX to gauge fear. If the VIX is above a specific threshold (Default: 32), entries are paused, and existing positions can optionally be closed to preserve capital.
2. Entry Logic Entries are based on Momentum and Trend confirmation. A position is opened if filters are clear AND one of the following occurs:
Golden Cross: SMA 25 crosses over SMA 50.
SMA Breakouts: A "Three-Bar-Break" logic confirms a breakout above the SMA 50, 100, or 200 (price must establish itself above the moving average).
3. The "Ratchet" Exit System The exit logic evolves as the trade progresses, tightening risk like a ratchet:
Stage 0 (Initial Risk): Starts with a standard percentage Stop Loss from the entry price.
Stage 1 (Breakeven/Lock): Once the price rises by Profit Step 1 (e.g., +10%), the Stop Loss jumps to a tighter level and locks there. This secures the initial move.
Stage 2 (Trailing Mode): If the price continues to rise to Profit Step 2 (e.g., +15%), the Stop Loss converts into a dynamic Trailing Stop relative to the Highest High. This allows the trade to run as long as the trend persists.
Additional Exits:
Dead Cross: Closes position if SMA 25 crosses under SMA 50.
VIX Panic: Emergency exit if volatility spikes above the threshold.
Settings & Customization:
SMAs: Adjustable lengths for all Moving Averages.
Filters: Toggle Market/VIX filters on/off and choose your benchmark ticker (e.g., SPY or QQQ).
Risk Management: Fully customizable percentages for the Ratchet steps (Initial SL, Stage 1 Trigger, Trailing distance).

Ratchet Exit Trend Strategy with VIX FilterThis strategy is a trend-following system designed specifically for volatile markets. Instead of focusing solely on the "perfect entry," this script emphasizes intelligent trade management using a custom **"Ratchet Exit System."**
Additionally, it integrates a volatility filter based on the CBOE Volatility Index (VIX) to minimize risk during extreme market phases.
### 🎯 The Concept: Ratchet Exit
The "Ratchet" system operates like a mechanical ratchet tool: the Stop Loss can only move in one direction (up, for long trades) and "locks" into specific stages. The goal is to give the trade "room to breathe" initially to avoid being stopped out by noise, then aggressively reduce risk as the trade moves into profit.
The exit logic moves through 3 distinct phases:
1. **Phase 0 (Initial Risk):** At the start of the trade, a wide Stop Loss is set (Default: 10%) to tolerate normal market volatility.
2. **Phase 1 (Risk Reduction):** Once the trade reaches a specific floating profit (Default: +10%), the Stop Loss is raised and "pinned" to a fixed value (Default: -8% from entry). This drastically reduces risk while keeping the trade alive.
3. **Phase 2 (Trailing Mode):** If the trend extends to a higher profit zone (Default: +15%), the Stop switches to a dynamic Trailing Mode. It follows the **Highest High** at a fixed percentage distance (Default: 8%).
### 🛡️ VIX Filter & Panic Exit
High volatility is often the enemy of trend-following strategies.
* **Entry Filter:** The system will not enter new positions if the VIX is above a user-defined threshold (Default: 32). This helps avoid entering "falling knife" markets.
* **Panic Exit:** If the VIX spikes above the threshold (32) while a trade is open, the position is closed immediately to protect capital (Emergency Exit).
### 📈 Entry Signals
The strategy trades **LONG only** and uses Simple Moving Averages (SMAs) to identify trends:
* **Golden Cross:** SMA 25 crosses over SMA 50.
* **3-Bar Breakouts:** A confirmation logic where the price must close above the SMA 50, 100, or 200 for 3 consecutive bars.
### ⚙️ Settings (Inputs)
All parameters are fully customizable via the settings menu:
* **SMAs:** Lengths for the trend indicators (Default: 25, 50, 100, 200).
* **VIX Filter:** Toggle the filter on/off and adjust the panic threshold.
* **Ratchet Settings:** Percentages for Initial Stop, Trigger Levels for Stages 1 & 2, and the Trailing Distance.
### ⚠️ Technical Note & Risk Warning
This script uses `request.security` to fetch VIX data. Please ensure you understand the risks associated with trading leveraged or volatile assets. Past performance is not indicative of future results.
