WSTF RSI2 IndicatorThis is the Indicator replicating the basic RSI(2) created by Wilders.
Buy condition:
(RSI(2) crossed under 10) & (close > EMA(200)) & (EMA(5) > close)
Sell condition:
(RSI(2) crossed over 90) & (close < EMA(200)) & (EMA(5) < close)
You can play around with the script by adjusting the RSI Values, EMA values and crossover & crossunder threshold.
We will update the script with new features in the futures.
Please don't hesitate to share some Ideas or Feedbacks, we would be happy to improve the script for you !
Have fun !
WS TradingFactory
Recherche dans les scripts pour "200元+股票大盘"

Diversified Investment EMA Cross Strategy SimulatorThis simulating indicator proves that even if you use a simple strategy, you can reduce your risk by diversifying your investments.
The strategy itself is simple.(only long)
Buy when 50 days EMA crosses over 200 days EMA.
Sell when 50 days EMA crosses under 200 days EMA.
Or, stop loss when the asset falls by 2% (eg).
Using this simple strategy on an asset is just a test of your luck.
However, this capital change graph shows that risk can be reduced by diversifying investment into eight assets rather than one asset.
Options
Total Assets Capital Change represents the sum of capital changes for 8 assets. The gray line is the initial capital.
Each Asset Capital Change represents all eight asset capital changes. In this case, the gray line is displayed as the initial capital divided by 8.
The rest of the options show a graph of capital change for each asset, showing when buys and sells occurred.
And set the start date, initial capital, stop loss %, and commission.
And select the 8 assets you want to invest in and you are ready to go. To effectively reduce risk, uncoupled assets would be better if possible.
The table in the lower right shows the selected asset and color.
Please enjoy the simulation.

EMA 50 HIGH LOW BANDHi
This indicator displays a band of EMA 50 having high and low of the same ema.
This script works well on 5 min chart or lower time frames in intraday.
When any price is above this band, you may consider a buy position and whenever any price is below this band, you may consider a sell position.
You may also take help of EMA 200, which is shown in red color. Whenever price is above EMA200, it is considered bullish and when ever it is below EMA 200, it is considered bearish.
This will remove a lot of noise from your chart.
I hope it helps.
Thanks

Sherry on cryptoIf the price is above the 200 EMA, you are allowed to open only long positions and avoid shorts.
If the price is below the 200 EMA, you are allowed to open only short position and avoid longs. Don't use this indicator alone, use RSI, Stochastic RSI etc. Do not use this indicator like a bot, do TA and FA as well. This is just an indicator, do not always rely on it. It requires experience. This indicator has different winrate in different timeframes. Set its value accordingly.
Multiple EMAAn exponentially weighted moving average reacts more significantly to recent price changes than a simple moving average (SMA), which applies an equal weight to all observations in the period.
Here, i have merged multiple EMA into one indicator. traders would find it very convenient as multiple widely used EMA`s are merged into 1 indicator. one can also change the time and color from its settings as per their convenience.
About the practicality of this EMA`s:
Every EMA suggests the sentiments in a period of time.
The longer-day EMAs (i.e. 50 and 200-day) tend to be used more by long-term investors, while short-term investors tend to use 8 and 20 day EMAs.
One may prefer to short or to hedge their position when 200 day moving average is broken downside. vise-versa for long. Normally in one may expect around 2-3% move on either side when broken with volumes supporting it.

CCI and ADX_by RMCCI and ADX
ENTRY:
Buy: When CCI crosses -100 level from -200 level(1hr/15min Time Frame)
Short: When CCI crosses 100 level from 200 level (1hr/15min Time Frame)
Closing of Position : 1:1 OR 1:2 (Or As per Value Zone)

Booz StrategyBooz Backtesting : Booz Backtesting is a method for analyzing the performance of your current trading strategy . Booz Backtesting aims to help you generate results and evaluate risk and return without risking real capital.
The Booz Backtesting is the Booz Super Swing Indicator equivalent but gives you the ability to backtest data on different charts.
This is an Indicator created for the purpose of identifying trends in Multiple Markets, it is based on Moving Average Crossover and extra features.
Swing Trading: This function allows you to navigate the entire trend until it is not strong enough, so you can compare it with fixed parameters such as Take Profit and Stop Loss.
Take Profit and Stop Loss function: With this function you will be able to choose the most optimal parameters and see in real time the results in order to choose the best combination of parameters.
Leverage : We have this function for the futures markets where you can check which is the most appropriate leverage for your operation.
Trend Filter: allows you to take multiple entries in the same direction of the market.
If the market crosses below the 200 moving average, it will take only short entries.
If the market crosses above the 200 moving average, it will take only long entries.
Timeframes
Charting from 1 Hour, 4 Hour, Daily, Weekly, Weekly
Markets :Booz Backtesting can be tested in Cryptocurrency, Stocks and Futures markets.
Background Color : at a glance, you can see what cycle the market is in.
Green background : Shows that the market is in a bullish cycle.
Red background: Shows that the market is in a bearish cycle.

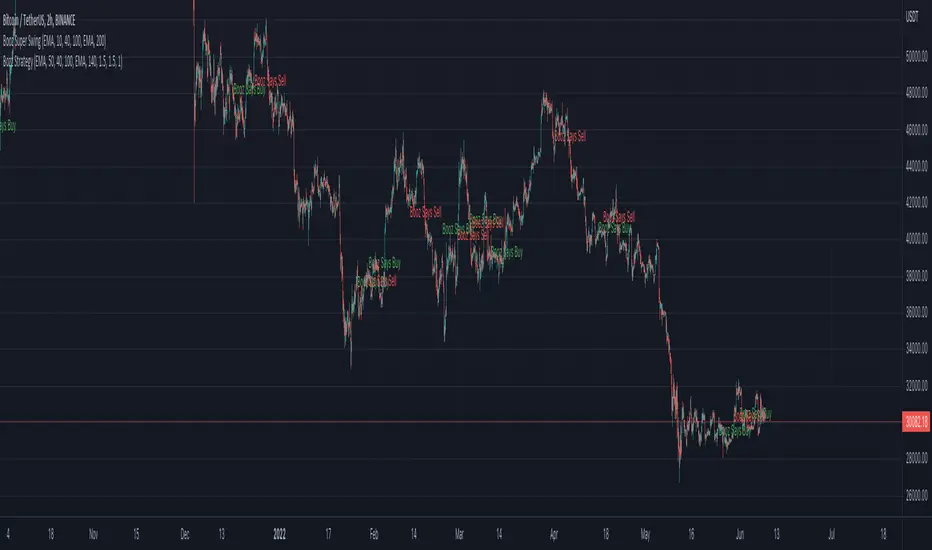
Booz Super SwingBooz Super Swing is an Indicator created for the purpose of identifying trends in Multiple Markets, it is based on Moving Average Crossover and extra features.
Trend Filter: allows you to take multiple entries in the same direction of the market.
If the market crosses below the 200 moving average it will take only short entries.
If the market crosses above the 200 moving average it will take only long entries.
Background Color : at a glance, you can see what cycle the market is in.
Green background : Shows that the market is in a bullish cycle.
Red background: Shows that the market is in a bearish cycle.
Markets : Booz Super Swing can be used and has been tested in Cryptocurrency, Stocks and Futures markets.
Timeframes
Charting from 1 Hour, 4 Hour, Daily, Weekly, Weekly
Weak Point :
Are Sideways Markets
Alarms :
Buy : Allows you to notify and automate entries based on market detection.
Sell : Allows you to notify and automate entries based on market detection.
Bozz Strategy
Booz Backtesting : Booz Backtesting is a method for analyzing the performance of your current trading strategy . Booz Backtesting aims to help you generate results and evaluate risk and return without risking real capital.
The Booz Backtesting is the Booz Super Swing Indicator equivalent but gives you the ability to backtest data on different charts.
This is an Indicator created for the purpose of identifying trends in Multiple Markets, it is based on Moving Average Crossover and extra features.
Swing Trading: This function allows you to navigate the entire trend until it is not strong enough, so you can compare it with fixed parameters such as Take Profit and Stop Loss.
Take Profit and Stop Loss function: With this function you will be able to choose the most optimal parameters and see in real time the results in order to choose the best combination of parameters.
Leverage : We have this function for the futures markets where you can check which is the most appropriate leverage for your operation.
Trend Filter: allows you to take multiple entries in the same direction of the market.
If the market crosses below the 200 moving average, it will take only short entries.
If the market crosses above the 200 moving average, it will take only long entries.
Timeframes
Charting from 1 Hour, 4 Hour, Daily, Weekly, Weekly
Markets :Booz Backtesting can be tested in Cryptocurrency, Stocks and Futures markets.
Background Color : at a glance, you can see what cycle the market is in.
Green background : Shows that the market is in a bullish cycle.
Red background: Shows that the market is in a bearish cycle.
Twitter
Website

Bitcoin Bottom Detector: W TimeframeUse this indicator in the weekly time frame:
One of the most widely used indicators for identifying the Bitcoin market bottom is the 200-week moving average. This indicator works based on the ratio of price to the value of the 200-week moving average. When the indicator enters the lower blue part (overflow area), it indicates the bitcoin is in the bottom of the market.

Bollinger Bands + Keltner Channel Refurbished█ Goals
This is an indicator that brings together Bollinger Bands and Keltner's Channels in one thing.
Both are very similar, so I decided to make a merge of the best features I found out there.
Here there is the possibility of choosing one of these two as needed.
In addition, I added the following resources:
1. Pre-Defined intermediate bands with Fibonacci values;
2. Detachment of the bands in which the price was present;
3. Choice of Moving Average:
"Simple", "Exponential", "Regularized Exponential", "Hull", "Arnaud Legoux", "Weighted Moving Average", "Least Squares Moving Average (Linear Regression)", "Volume Weighted Moving Average", "Smoothed Moving Average", "Median", "VWAP");
4. Statistics: bars count within the bands.
█ Concepts
Keltner Channels vs. Bollinger Bands
"These two indicators are quite similar.
Keltner Channels use ATR to calculate the upper and lower bands while Bollinger Bands use standard deviation instead.
The interpretation of the indicators is similar, although since the calculations are different the two indicators may provide slightly different information or trade signals."
(Investopedia)
Bollinger Bands (BB)
"Bollinger Bands (BB) are a widely popular technical analysis instrument created by John Bollinger in the early 1980’s.
Bollinger Bands consist of a band of three lines which are plotted in relation to security prices.
The line in the middle is usually a Simple Moving Average (SMA) set to a period of 20 days (the type of trend line and period can be changed by the trader; however a 20 day moving average is by far the most popular).
The SMA then serves as a base for the Upper and Lower Bands which are used as a way to measure volatility by observing the relationship between the Bands and price.
Typically the Upper and Lower Bands are set to two standard deviations away from the SMA (The Middle Line); however the number of standard deviations can also be adjusted by the trader."
(TradingView)
Keltner Channels (KC)
"The Keltner Channels (KC) indicator is a banded indicator similar to Bollinger Bands and Moving Average Envelopes.
They consist of an Upper Envelope above a Middle Line as well as a Lower Envelope below the Middle Line.
The Middle Line is a moving average of price over a user-defined time period.
Either a simple moving average or an exponential moving average are typically used. The Upper and Lower Envelopes (user defined) are set a range away from the Middle Line.
This can be a multiple of the daily high/low range, or more commonly a multiple of the Average True Range."
(TradingView)
█ Examples
Bollinger Bands with 200 REMA:
Keltner Channel with 200 REMA:
Bollinger Bands with 55 ALMA:
Keltner Channel with 55 ALMA:
Bollinger Bands with 55 Least Squares Moving Average:
█ Thanks
- TradingView (BB, KC, ATR, MA's)
- everget (Regularized Exponential Moving Average)
- TimeFliesBuy ("Triple Bollinger Bands")
- Rashad ("Fibonacci Bollinger Bands")
- Dicargo_Beam ("Is the Bollinger Bands assumption wrong?")

Timeframed Moving Average RibbonAdded timeframe inputs for each of the moving averages in the stock TradingView Moving Average Ribbon indicator.
Now one can use a combination of different moving averages such as the following without readjusting the indicator's settings when switching the chart's timeframes:
- 390 period 5 minute (5 day equivalent) SMA
- 150 period 1 day (30 week equivalent) EMA
- 200 period 1 week (50 month equivalent) SMA
- 50 period chart timeframe SMA
- 100 period chart timeframe SMA
- 200 period chart timeframe SMA

Price Spread Indicator v2Version 2 of this script. Looks at the spread of current price to two prior MA's. Defaults to 200 and 90 however 20 and 58 provide some nice results. A -1.3% spread ratio is used to trigger alerts ie -1.3% spread on 200 and 90. This has been derived from backtesting what optimised P&L.
Ideal for investors rather than traders. Out performs simple buy and hold by 5-6 times.

Simple Moving Averages - XfactorUsing this script in 2 minutes chart. When 20 SMA crosses over 200 sma, it's a buy signal. Also, using 9 and 50 sma as a signal to take profit and cut loss.
For example 20 SMA crosses up 200 SMA it's a buy then if the candle closes under 9 SMA we can cut.

USFuturesInvestments Moving Averages - Exponencia and SimpleThis indicator contains the main exponential moving averages (9, 21 and 80) and the simple moving averages (200, 305 and 610), which I use in my operational.
It was developed by my friend Giovani, who is a 10 note guy!
I hope he can help you on your journey to becoming a Professional Trader.
You can modify it the way you prefer, it is very simple.
Neste indicador estão reunidas as principais médias móveis exponenciais (9, 21 e 80) e as médias móveis simples (200, 305 e 610), que uso em meu operacional.
Ele foi desenvolvido por meu amigo Giovani, que é um cara nota 10!
Espero que ele possa ajudar a você na jornada para se tornar um Trader Profissional.
Você pode modifica-la do jeito que preferir, é muito simples.

BB Order BlocksUsing the Bollinger Band to mark areas of Support and Resistance
The scrip finds the highest and lowest levels of the bands to mark up futures areas of interest.
If the High/Lows are being broken on the Bollinger band, or if the look back range has expired without finding new levels, the script will stop plotting them until new levels are found
I have found many combinations which work well
Changing the band length to to levels 20,50,100 or 200 seem to give interesting results
Aswell as this changing the standard deviation to 3 instead of 2 marks up key levels.
The look back range seems to show better levels on 50,100 and 200
Let me know any changes or updates you think you could make an impact , this was just a quick basic script I wanted to share.
