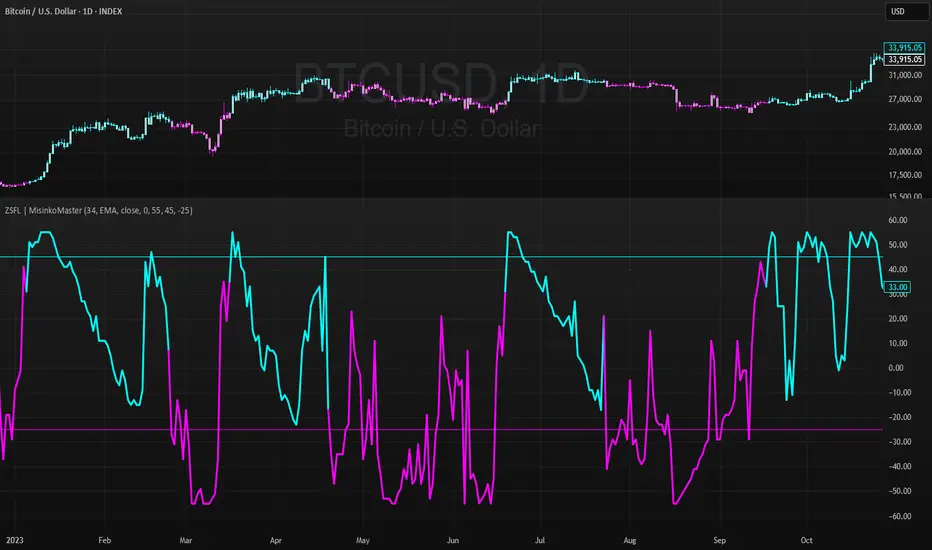
Z-Score For Loop | MisinkoMasterThe Z-Score For Loop (ZSFL) is a unique trend-following oscillator designed to detect potential reversals and momentum shifts earlier than traditional tools, providing traders with fast, adaptive, and reliable signals.
Unlike common smoothing techniques (moving averages, medians, or modes), the ZSFL introduces a for-loop comparison method that balances speed and noise reduction, resulting in a powerful reversal-detection system.
🔎 Methodology
The indicator is built in two main stages:
Z-Score Calculation
Formula:
Z=(Source−Mean)/Standard Deviation
Z=
Standard Deviation
(Source−Mean)
The user can select the averaging method for the mean: SMA, EMA, WMA, HMA, DEMA, or TEMA.
Recommended: EMA, SMA, or WMA for balanced accuracy.
The choice of biased (sample) or unbiased (population) standard deviation is also available.
➝ On its own, the raw Z-score is fast but noisy, requiring additional filtering.
For Loop Logic (Noise Reduction)
Instead of using traditional smoothing (which adds lag), the indicator applies a for loop comparison.
The current Z-score is compared against previous values over a user-defined range (start → end).
Each comparison adds or subtracts “points”:
+1 point if the current Z-score is higher than a past Z-score.
-1 point if it is lower.
The final value is the cumulative score, reflecting whether the Z-score is generally stronger or weaker than its historical context.
➝ This approach keeps speed intact while removing much of the false noise that raw Z-scores generate.
📈 Trend Logic
Bullish Signal (Cyan) → Triggered when the score crosses above the upper threshold (default +45).
Bearish Signal (Magenta) → Triggered when the score crosses below the lower threshold (default -25).
Neutral → When the score remains between the thresholds.
Thresholds are adjustable, making the tool flexible for different assets and timeframes.
🎨 Visualization
The ZSFL score is plotted as a main oscillator line.
Upper and lower thresholds are plotted as static reference levels.
The price chart can also be color-coded with trend signals (cyan for bullish, magenta for bearish) to provide immediate visual confirmation.
⚡ Features
Adjustable Z-score length (len).
Multiple average types for the mean (SMA, EMA, WMA, HMA, DEMA, TEMA).
Toggle between biased vs. unbiased SD calculations.
Adjustable For Loop range (start, end).
Adjustable upper and lower thresholds for signal generation.
Works as both an oscillator and a price overlay tool.
✅ Use Cases
Reversal Detection → Spot early shifts before price confirms them.
Trend Confirmation → Use thresholds to filter false reversals.
System Filter → Combine with trend indicators to refine entries.
Multi-Timeframe Setup → Works well across different timeframes for swing, day, or intraday trading.
⚠️ Limitations
As with all oscillators, the ZSFL will generate false signals in sideways/choppy markets.
Optimal parameters (length, loop size, thresholds) may differ across assets.
It is not a standalone trading system — use alongside other forms of analysis (trend filters, volume, higher timeframe confluence).
Recherche dans les scripts pour "45美元兑换人民币+最新汇率"
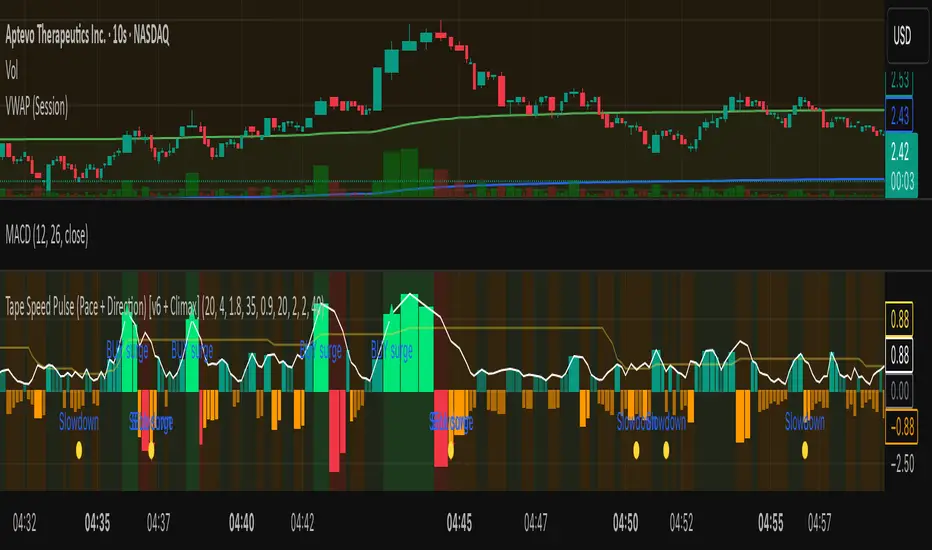
Tape Speed Pulse (Pace + Direction) [v6 + Climax]Tape Speed Pulse (Pace + Direction)
One-liner:
A lightweight “tape pulse” that turns intraday bursts of buying/selling into an easy-to-read histogram, with surge, slowdown, and climax (exhaustion) markers for fast decision-making. Use on sec and min charts.
What it measures
Pace (RVOL): current bar volume vs the recent average (smoothed).
Direction proxy: uptick/downtick by comparing close to close .
Pulse (histogram): direction × pace, so you see who’s pushing and how fast.
Colors
- Lime = Buy surge (pace ≥ threshold & upticking)
- Red = Sell surge (pace ≥ threshold & downticking)
- Teal = Buy pressure, sub-threshold
- Orange = Sell pressure, sub-threshold
- Faded/gray = Near-neutral pace (below the Neutral Band)
Lines (toggleable)
-White = Pace (RVOL)
- Yellow = Slowdown line = a drop of X% from the last 30-bar peak pace
Background tint mirrors the current state so you can glance risk: greenish for buy pressure, reddish for sell pressure.
Signals & alerts
- BUY surge – fires when pace crosses above the surge threshold with uptick direction (optional acceleration & uptick streak filters; cooldown prevents spam).
- SELL surge – mirror logic to downside.
- Slowdown – fires when pace crosses below the yellow slowdown line while direction ≤ 0 (early fade warning).
Climax (exhaustion)
- Buy Climax: previous bar was a buy surge with a large upper wick; current bar slows (below slowdown line) and direction ≤ 0.
- Sell Climax: mirror (large lower wick → slowdown → direction ≥ 0).
- Great for trimming/tight stops or fade setups at obvious spikes.
- Create alerts via Add alert → Condition: this indicator → choose the specific alert (BUY surge, SELL surge, Slowdown, Buy Climax, Sell Climax).
How to use it (playbook)
- Longs (e.g., VWAP reclaim / micro pullback)
- Only take entries when the pulse is teal→lime (buy pressure to buy surge).
- Into prior highs/VWAP bands, take partials on lime spikes.
- If you get a Slowdown dot and bars turn orange/red, tighten or exit.
Shorts (failed reclaim / lower-high)
- Look for teal→orange→red with rising pace at a level.
- Add confidence if a Buy Climax printed right before (exhaustion).
- Risk above the spike; don’t fight true ignitions out of bases.
Simple guardrails
- Avoid new longs when the histogram is orange/red; avoid new shorts when teal/lime.
- Use with VWAP + 9/20 EMA or your levels. The pulse is confirmation, not the whole thesis.
Inputs (what they do & when to tweak)
- Pace lookback (bars) – window for average volume. Lower = faster; higher = steadier.
Too jumpy? raise it. Missing quick bursts? lower it.
- Smoothing EMA (bars) – smooths pace. Higher = calmer.
Use 4–6 during the open; 3–4 midday.
- Surge threshold (× RVOL) – how fast counts as a surge.
Too many surges? raise it. Too late? lower it slightly.
- Slowdown drop from 30-bar max (%) – how far below the recent peak pace to call a slowdown.
Higher % = later slowdown; lower % = earlier warning.
- Neutral band (× RVOL) – paces below this fade to gray.
Raise to clean up noise; lower to see subtle pressure.
- Min seconds between signals – cooldown to prevent spam.
Increase in chop; reduce if you want more pings.
- BUY/SELL: min consecutive upticks/downticks – tiny streak filter.
Raise to avoid wiggles; lower for earlier signals.
Require pace accelerating into signal – ON = avoid stall breakouts; OFF = earlier pings.
Climax options: wick % threshold & “require slowdown cross”.
Raise wick% / require cross to be stricter; lower to catch more fades.
Quick presets
- Low-float runner, 5–10s chart
- Lookback 20, Smoothing 3–4, Surge 2.2–2.8, Slowdown 35–45, Neutral 1.0–1.2, Cooldown 15–25s, Streaks 2–3, Accel ON.
- Thick large-cap, 1-min
- Lookback 20–30, Smoothing 5–7, Surge 1.5–1.9, Slowdown 25–35, Neutral 0.8–1.0, Cooldown 30–60s, Streaks 2, Accel ON.
- Open vs Midday vs Power Hour
- Open: higher Surge, more Smoothing, longer Cooldown.
- Midday: lower Surge, less Smoothing to catch subtler pushes.
- Power hour: moderate Surge; keep Slowdown on for exits.
Reading common patterns
- Ignition (likely continuation): lime spike out of a base that holds above a level while pace stays above yellow.
- Exhaustion (likely fade): lime spike late in a run with upper wick → Slowdown → orange/red. The Buy Climax diamond is your tell.
Limits / notes
This is an OHLCV-based proxy (TradingView Pine can’t read raw tape/DOM). It won’t match Bookmap/Jigsaw tick-for-tick, but it’s fast and objective.
Use with levels and a risk plan. Past performance ≠ future results. Educational only.
MAxRSI Signals [KedArc Quant]Description:
MAxRSI Indicator Marks LONG/SHORT signals from a Moving Average crossover and (optionally) confirms them with RSI. Includes repaint-safe confirmation, optional higher-timeframe (HTF) smoothing, bar coloring, and alert conditions.
Why combine MA + RSI
* The MA crossover is the primary trend signal (fast trend vs slow trend).
* RSI is a gate, not a second, separate signal. A crossover only becomes a trade signal if momentum agrees (e.g., RSI ≥ level for LONG, ≤ level for SHORT). This reduces weak crosses in ranging markets.
* The parts are integrated in one rule: *Crossover AND RSI condition (if enabled)* → plot signal/alert. No duplicated outputs or unrelated indicators.
How it works (logic)
* MA types: SMA / EMA / WMA / HMA (HMA is built via WMA of `len/2` and `len`, then WMA with `sqrt(len)`).
* Signals:
* LONG when *Fast MA crosses above Slow MA* and (if enabled) *RSI ≥ Long Min*.
* SHORT when *Fast MA crosses below Slow MA* and (if enabled) *RSI ≤ Short Max*.
* Repaint-safe (optional): confirms crosses on closed bars to avoid intrabar repaint.
* HTF (optional): computes MA/RSI on a higher timeframe to smooth noise on lower charts.
* Alerts: crossover alerts + state-flip (bull↔bear) alerts.
How to use (step-by-step)
1. Add to chart. Set MA Type, Fast and Slow (keep Fast < Slow).
2. Turn Use RSI Filter ON for confirmation (default: RSI 14 with 50/50 levels).
3. (Optional) Turn Repaint-Safe ON for close-confirmed signals.
4. (Optional) Turn HTF ON (e.g., 60 = 1h) for smoother signals on low TFs.
5. Enable alerts: pick “MAxRSI Long/Short” or “Bullish/Bearish State”.
Timeframe guidance
* Intraday (1–15m): EMA 9–20 fast vs EMA 50 slow, RSI filter at 50/50.
* Swing (1h–D): EMA 20 fast vs EMA 200 slow, RSI 50/50 (55/45 for stricter).
What makes it original
* Repaint-safe cross confirmation (previous-bar check) for reliable signals/alerts.
* HTF gating (doesn’t compute both branches) for speed and clarity.
* Warning-free MA helper (precomputes SMA/EMA/WMA/HMA each bar), HMA built from built-ins only.
* State-flip alerts and optional RSI overlay on price pane.
Built-ins used
`ta.sma`, `ta.ema`, `ta.wma`, (HMA built from these), `ta.rsi`, `ta.crossover`, `ta.crossunder`, `request.security`, `plot`, `plotshape`, `barcolor`, `alertcondition`, `input.*`, `math.*`.
Note: Indicator only (no orders). Test settings per symbol. Not financial advice.
⚠️ Disclaimer
This script is provided for educational purposes only.
Past performance does not guarantee future results.
Trading involves risk, and users should exercise caution and use proper risk management when applying this strategy.

The Maker StrategyDESCRIPTION
The Maker Strategy is a trend-following system built around exponential moving averages (EMAs). By analyzing the alignment of multiple EMAs, the strategy identifies strong bullish or bearish momentum and generates precise entry signals. This method is designed to capture sustained trends while filtering out sideways or noisy market conditions.
USER INPUTS :
• EMA 1 Length (Default: 30)
• EMA 2 Length (Default: 35)
• EMA 3 Length (Default: 40)
• EMA 4 Length (Default: 45)
• EMA 5 Length (Default: 50)
• EMA 6 Length (Default: 60)
LONG CONDITION :
A long signal is triggered when all EMAs are perfectly aligned in ascending order:
EMA1 > EMA2 > EMA3 > EMA4 > EMA5 > EMA6
SHORT CONDITION :
A short signal is triggered when all EMAs are perfectly aligned in descending order:
EMA1 < EMA2 < EMA3 < EMA4 < EMA5 < EMA6
WHY IT IS UNIQUE:
Unlike traditional EMA crossover systems that rely on just 2 or 3 moving averages, The Maker Strategy uses 6 EMAs in sequence. This ensures that trades are only taken when there is clear and strong market momentum. The approach minimizes false signals in ranging markets and focuses on capturing trends with higher probability setups.
HOW USER CAN BENEFIT FROM IT :
• Clear entry alerts for both long and short positions.
• Visual confirmation through candle coloring and EMA band fills.
• Works on multiple timeframes and instruments (stocks, forex, crypto, indices).
• Helps traders stay on the right side of the trend while avoiding whipsaws.
• A simple yet effective tool for those who want a disciplined, rules-based strategy.

% of Average Volume% of Average Volume (RVOL)
What it is
This indicator measures cumulative volume during pre market and separately during the first 10 minutes of trading and compares it to the average 30 day volume. This matters as a high ratio of volume within the premarket and then during the first 10 minutes of trading can correlate to a stock that has a higher probability of trending in that direction throughout the day.
What it’s meant to do
Identify abnormally high or low participation early in the day.
Normalize volume by time of session, so 9:40 volume is compared to past 9:40 volume—not to the full-day total.
Provide consistent RVOL across 1–5–15–60 minute charts (the same market state yields similar readings).
Handle pre-market cleanly (optional) without inflating RVOL.
How it works (plain English)
Cumulative Intraday Volume: Adds up all bars from the session (or pre-market, if enabled) up to “now.”
Time-Matched Baseline: For each prior day in your lookback, it accumulates only up to the same intraday minute and averages those values.
RVOL %: RVOL = (Today cumulative / Average cumulative at same time) × 100.
This “like-for-like” approach prevents the classic mistakes that overstate RVOL in pre-market or make it drift with timeframe changes.
Works best on
Intraday charts: 1, 2, 3, 4, 5, 10, 15, 30, 45, 60 min
Regular & extended hours: NYSE/Nasdaq equities, futures, ETFs
Daily/weekly views are supported for reference, but the edge comes from intraday time-matched analysis.
Tip: For thin names or very early pre-market, expect more variability—lower liquidity increases noise.
Customization (Inputs → Settings)
Lookback Sessions (e.g., 20): How many prior trading days to build the average.
Include Pre-Market (on/off): If on, RVOL accumulates from pre-market start and compares to historical pre-market at the same time; if off, it begins at the regular session open only.
Session Timezone / Exchange Hours: Choose the session definition that matches your market (e.g., NYSE) so “time-matched” means the same thing every day.
Cutoff Minute (Optional): Fix a reference minute (e.g., 6:40 a.m. PT / 9:40 a.m. ET) to evaluate RVOL at a standard check-in time.
Smoothing (Optional): Apply a short moving average to the RVOL line to reduce jitter.
Thresholds & Colors: Set levels (e.g., 150%, 300%) to color the plot/labels and trigger alerts.
Show Labels/Debug: Toggle on-chart labels (current RVOL%, baseline vols) for quick audits.
On-chart visuals & alerts
RVOL% Line/Histogram: Color-coded by thresholds (e.g., >300% “exceptional”, >150% “elevated”).
Session Markers: Optional vertical lines for pre-market/regular open.
Alerts:
RVOL Crosses Above X% (e.g., 150%, 300%)
RVOL Crosses Below X%
RVOL Rising/Falling (slope-based, optional)
Good defaults to start
Lookback: 20 sessions
Pre-market: Off for large caps, On for momentum screens
Thresholds: 150% (notable), 300% (exceptional)
Smoothing: 0–3 bars (or off for fastest response)
Notes & best practices
Timeframe consistency: Because calculations are time-matched, RVOL should remain directionally consistent across intraday timeframes. If you see divergences, confirm your session hours & timezone match your instrument’s exchange.
Holiday/half days: These are included in history; you can shorten lookback or exclude such sessions if your workflow prefers.
Low-float names: Consider a slightly longer lookback to reduce outlier effects.
TL;DR
A time-matched RVOL that treats pre-market correctly, stays stable across intraday timeframes, and is fully customizable for your exchange hours, thresholds, and alerts—so you can spot real participation when it matters.

Cyclic Reversal Engine [AlgoPoint]Overview
Most indicators focus on price and momentum, but they often ignore a critical third dimension: time. Markets move in rhythmic cycles of expansion and contraction, but these cycles are not fixed; they speed up in trending markets and slow down in choppy conditions.
The Cyclic Reversal Engine is an advanced analytical tool designed to decode this rhythm. Instead of relying on static, lagging formulas, this indicator learns from past market behavior to anticipate when the current trend is statistically likely to reach its exhaustion point, providing high-probability reversal signals.
It achieves this by combining a sophisticated time analysis with a robust price-action confirmation.
How It Works: The Core Logic
The indicator operates on a multi-stage process to identify potential turning points in the market.
1. Market Regime Analysis (The Brain): Before analyzing any cycles, the indicator first diagnoses the current "personality" of the market. Using a combination of the ADX, Choppiness Index, and RSI, it classifies the market into one of three primary regimes:
- Trending: Strong, directional movement.
- Ranging: Sideways, non-directional chop.
- Reversal: An over-extended state (overbought/oversold) where a turn is imminent.
2. Adaptive Cycle Learning (The "Machine Learning" Aspect): This is the indicator's smartest feature. It constantly analyzes past cycles by measuring the bar-count between significant swing highs and swing lows. Crucially, it learns the average cycle duration for each specific market regime. For example, it learns that "in a strong trending market, a new swing low tends to occur every 35 bars," while "in a ranging market, this extends to 60 bars."
3. The Countdown & Timing Signal: The indicator identifies the last major swing high or low and starts a bar-by-bar countdown. Based on the current market regime, it selects the appropriate learned cycle length from its memory. When the bar count approaches this adaptive target, the indicator determines that a reversal is "due" from a timing perspective.
4. Price Confirmation (The Trigger): A signal is never generated based on timing alone. Once the timing condition is met (the cycle is "due"), the indicator waits for a final price-action confirmation. The default confirmation is the RSI entering an extreme overbought or oversold zone, signaling momentum exhaustion. The signal is only triggered when Time + Price Confirmation align.
How to Use This Indicator
- The Dashboard: The panel in the bottom-right corner is your command center.
- Market Regime: Shows the current market personality analyzed by the engine.
- Adaptive Cycle / Bar Count: This is the core of the indicator. It shows the target cycle length for the current regime (e.g., 50) and the current bar count since the last swing point (e.g., 45). The background turns orange when the bar count enters the "due zone," indicating that you should be on high alert for a reversal.
- BUY/SELL Signals: A label appears on the chart only when the two primary conditions are met:
The timing is right (Bar Count has reached the Adaptive Cycle target).
The price confirms exhaustion (RSI is in an extreme zone).
A BUY signal suggests a downtrend cycle is likely complete, and a SELL signal suggests an uptrend cycle is likely complete.
Key Settings
- Pivot Lookback: Controls the sensitivity of the swing point detection. Higher values will identify more significant, longer-term cycles.
- Market Regime Engine: The ADX, Choppiness, and RSI settings can be fine-tuned to adjust how the indicator classifies the market's personality.
- Require Price Confirmation: You can toggle the RSI confirmation on or off. It is highly recommended to keep it enabled for higher-quality signals.

Fear & Greed [theUltimator5]This indicator attempts to replicate CNN's Fear & Greed Index methodology to measure market sentiment on a scale from 0-100. It combines seven key market components into a single sentiment score, where lower values indicate fear and higher values indicate greed.
Note: It is impossible to perfectly replicate the true Fear & Greed indicator due to data limitations, so this indicator attempts to best replicate the output for each of the (7) components using available data.
The uniqueness of this indicator comes from the calculation methods for the 7 components as well as the visual representation of the data, which includes a table and selectable plots for each of the 7 components which make up the overall sentiment. Existing variants of the Fear & Greed Index have substantial flaws in the calculations of several of the components which result in warped final sentiment numbers. This indicator attempts to better track all 7 components and provide a closer model to the actual Fear & Greed index.
Here are the seven components and a brief description of how each are calculated:
1. Market Momentum
Calculation: S&P 500 current price vs. 125-day moving average
Measures how far the market has moved from its long-term trend
Uses CNN-style Z-score normalization over 252 trading days
Higher values indicate strong upward momentum (greed)
Lower values suggest declining momentum (fear)
2. Stock Strength
Calculation: S&P 500 RSI scaled to 252-day range
Uses 14-period RSI of the S&P 500 index
Normalizes RSI values based on their 252-day minimum and maximum
Measures overbought/oversold conditions relative to recent history
Higher values indicate overbought conditions (greed)
Lower values suggest oversold conditions (fear)
3. Price Breadth
Calculation: Modified McClellan Oscillator
Primary: Uses NYSE advancing vs. declining issues with 7-day smoothing
Fallback: Compares sector performance (QQQ, IWM vs. SPY)
Measures how many stocks participate in market moves
Broader participation indicates healthier trends
Narrow breadth suggests selective or weak trends
4. Put/Call Ratio
Calculation: Inverted CBOE Put/Call ratios
Primary: CBOE Equity-only Put/Call ratio (more sensitive)
Fallback: CBOE Total Put/Call ratio
Uses 5-day average and applies CNN normalization
Higher put/call ratios indicate fear (inverted to lower scores)
Lower put/call ratios suggest complacency (higher scores)
5. Market Volatility
Calculation: VIX relative to its 50-day average
Compares current VIX level to its 50-day moving average
Measures deviation from normal volatility expectations
Higher VIX relative to average indicates fear (lower scores)
Lower relative VIX suggests complacency (higher scores)
6. Safe Haven Demand
Calculation: Stock returns vs. bond yield changes
Compares 20-day smoothed S&P 500 returns to Treasury yield changes
When stocks outperform bonds, indicates risk appetite (higher scores)
When bonds outperform stocks, suggests risk aversion (lower scores)
Uses Treasury 10-year yields as the safe haven benchmark
7. Junk Bond Demand
Calculation: High-yield bond spread analysis
Measures yield spread between junk bonds (JNK ETF) and Treasuries
Compares current spread to its 5-day average
Narrowing spreads indicate risk appetite (higher scores)
Widening spreads suggest risk aversion (lower scores)
The combined sentiment is plotted as a single line which changes color based on the current sentiment value.
0-25: Extreme Fear (Red) - Market panic, oversold conditions
26-45: Fear (Orange) - Cautious sentiment, bearish bias
46-55: Neutral (Yellow) - Balanced market sentiment
56-75: Greed (Light Green) - Optimistic sentiment, bullish bias
76-100: Extreme Greed (Green) - Market euphoria, potentially overbought
There are dashed lines to represent the threshold values for each of the sentiments to better visualize transitions.
The table displays each of the (7) components of the index and their respective values. The table can be toggled on/off and the position can be moved.
An optional secondary line can be toggled on to display (1) of the (7) components as a unique color and the component name and value will highlight on the table. The secondary line can be used to dig into the main driving forces behind the overall index value.

RSI Multi Time FrameWhat it is
A clean, two-layer RSI that shows your chart-timeframe RSI together with a higher-timeframe (HTF) RSI on the same pane. The HTF line is drawn as a live segment plus frozen “steps” for each completed HTF bar, so you can see where the higher timeframe momentum held during your lower-timeframe bars.
How it works
Auto HTF mapping (when “Auto” is selected):
Intraday < 30m → uses 60m (1-hour) RSI
30m ≤ tf < 240m (4h) → uses 240m (4-hour) RSI
240m ≤ tf < 1D → uses 1D RSI
1D → uses 1W RSI
1W or 2W → uses 1M RSI
≥ 1M → keeps the same timeframe
The HTF series is requested with request.security(..., gaps_off, lookahead_off), so values are confirmed bar-by-bar. When a new HTF bar begins, the previous value is “frozen” as a horizontal segment; the current HTF value is shown by a short moving segment and a small dot (so you can read the last value easily).
Visuals
Current RSI (chart TF): solid line (color/width configurable).
HTF RSI: same-pane line + tiny circle for the latest value; historical step segments show completed HTF bars.
Guides: dashed 70 / 30 bands, dotted 60/40 helpers, dashed 50 midline.
Inputs
Higher Time Frame: Auto or a fixed TF (1, 3, 5, 10, 15, 30, 45, 60, 120, 180, 240, 360, 480, 720, D, W, 2W, M, 3M, 6M, 12M).
Length: RSI period (default 14).
Source: price source for RSI.
RSI / HTF RSI colors & widths.
Number of HTF RSI Bars: how many frozen HTF segments to keep.
Reading it
Alignment: When RSI (current TF) and HTF RSI both push in the same direction, momentum is aligned across frames.
Divergence across frames: Current RSI failing to confirm HTF direction can warn about chops or early slowdowns.
Zones: 70/30 boundaries for classic overbought/oversold; 60/40 can be used as trend bias rails; 50 is the balance line.
This is a context indicator, not a signal generator. Combine with your entry/exit rules.
Notes & limitations
HTF values do not repaint after their bar closes (lookahead is off). The short “live” segment will evolve until the HTF bar closes — this is expected.
Very small panels or extremely long histories may impact performance if you keep a large number of HTF segments.
Credits
Original concept by LonesomeTheBlue; Pine v6 refactor and auto-mapping rules by trading_mura.
Suggested use
Day traders: run the indicator on 5–15m and keep HTF on Auto to see 1h/4h momentum.
Swing traders: run it on 1h–4h and watch the daily HTF.
Position traders: run on daily and watch the weekly HTF.
If you find it useful, a ⭐ helps others discover it.

Stock Health - 5mWarns if you are about to trade before 45 min passed since market open.
Good reminder if you are impatient / have ADHD...
Meant to be used on a 5m chart.
More infos: www.reddit.com

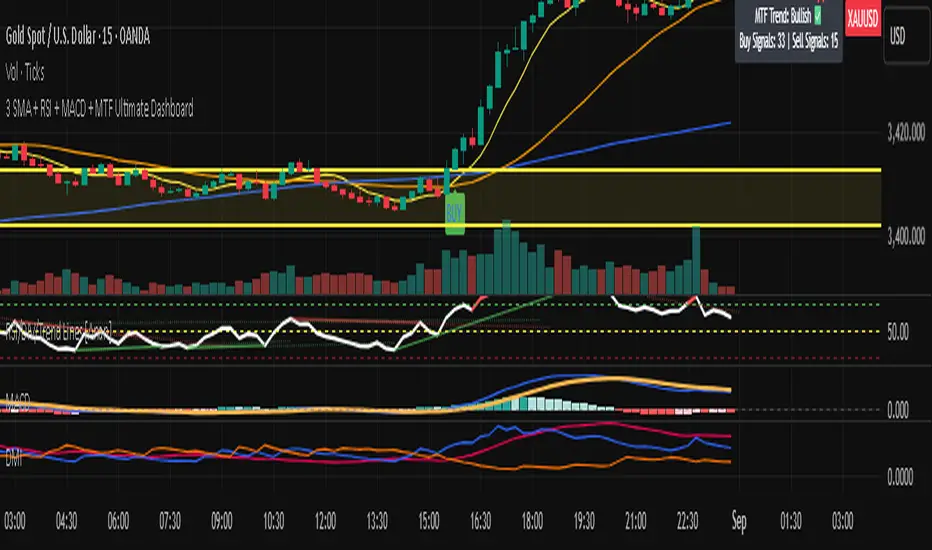
3 SMA + RSI + MACD + MTF Ultimate Dashboard🎯 Overview:
High-precision trading indicator combining trend, momentum, and multi-timeframe confirmation for reliable buy/sell signals in Forex, Crypto, and other markets.
🔹 Core Features:
📈 3 SMAs (7/25/99) – Short, Medium & Long-term trend detection
⚡ RSI Filter – Avoid weak signals (Buy >55 / Sell <45)
💎 MACD with Threshold – Reduce false crossovers
⏱️ Multi-Timeframe Trend (H4) – Confirm overall market direction
✅ Dashboard & Signals:
🟢 Clear Buy & Sell arrows on chart
📊 Live dashboard showing filter status & total signals
🔔 Audio & Push Alerts – Mobile/Desktop/Webhook
💎 Benefits:
⚡ Minimizes false signals
📈 Works on M15, H1, H4, Daily
🎯 Combines trend, momentum, and confirmation filters in one dashboard
⚠️ Note: Signals are generated only after candle close for maximum reliability.

RSI Cross Alerts with Vertical Lines (9:30 AM - 2:45 PM)RSI Cross Alerts - Indicates Vertical Lines on previous times the RSI Indicator Crosses Overbought or Oversold parameters set by user.

ORB with Golden Zone FIB targets, Any Timeframe by TenAMTraderDescription:
This indicator is designed to help traders identify key price levels using Fibonacci extensions and retracements based on the Opening Range Breakout (ORB). The levels are visualized as “Golden Zones”, which can serve as potential targets for trades.
Features:
Customizable ORB Timeframe: By default, the ORB is set from 9:30 AM to 9:45 AM EST, but any timeframe can be configured in the settings to fit your trading style.
Golden Zones as Targets: Fibonacci levels are intended to be used as potential profit-taking zones or areas to monitor for reversals, providing a structured framework for intraday and swing trading.
Adjustable Chart Settings: Color-coded levels make it easy to interpret at a glance, and all lines can be customized for personal preference.
Versatile Application: The indicator works across any timeframe, enabling traders to analyze both intraday and multi-day price action.
How to Use:
Ensure Regular Trading Hours (RTH) is enabled on your chart for accurate level calculation.
Observe price action near Golden Zones: a confirmed breakout may indicate continuation, while a pullback could signal a reversal opportunity.
Use the Golden Zones as reference targets for managing risk and planning exits.
Adjust the ORB timeframe and display settings to match your preferred trading style.
Legal Disclosure:
This indicator is provided for educational purposes only and is not financial advice. Trading carries a substantial risk of loss. Users should always perform their own analysis and consult a licensed financial professional before making any trading decisions. Past performance is not indicative of future results.

Third Eye ORB Pro (0915-0930 IST, no-plot)Third Eye ORB Pro (Opening Range Breakout + Range Mode)
This indicator is designed specifically for Indian stocks and indices (NIFTY, BANKNIFTY, FINNIFTY, MIDCAP, etc.) to track the Opening Range (09:15–09:30 IST) and generate actionable intraday trade signals. It combines two key modes — Range Mode (mean reversion inside the opening range) and Breakout Mode (momentum trading beyond the range).
1. Opening Range Framework (09:15–09:30 IST)
The indicator automatically plots the Opening Range High (ORH) and Opening Range Low (ORL) after the first 15 minutes of market open.
The area between ORH and ORL acts as the intraday battlefield where most price action occurs (historically ~70–80% of the day is spent inside this zone).
A shaded box and horizontal lines mark this range, serving as a visual reference for support and resistance throughout the day.
2. Range Mode (Mean Reversion Inside OR)
When price trades inside the Opening Range, the indicator looks for edge rejections to capture range-bound trades.
Range BUY (RB): Triggered near ORL when a bullish rejection candle forms (strong body + long lower wick).
Range SELL (RS): Triggered near ORH when a bearish rejection candle forms (strong body + long upper wick).
Optional filters (toggleable in settings):
RSI Filter: Only allow range buys if RSI is oversold (≤45) and range sells if RSI is overbought (≥55).
VWAP Filter: Only allow range trades if price is not too far from VWAP (distance ≤ X% of OR size).
Labels show suggested Stop Loss (just outside the OR band) and Target (midline/VWAP).
Cooldown logic prevents consecutive whipsaw signals.
3. Breakout Mode (Directional Moves Beyond OR)
When price closes strongly outside the ORH/ORL with momentum, the indicator confirms a breakout/breakdown trade.
Buffers are applied to avoid false breakouts:
ATR Buffer: Price must extend at least ATR × multiplier beyond the range edge.
% Buffer: Price must extend at least a percentage of OR size (default 10%).
Confirmation Filters:
Candle must have a strong body (≥60% of total bar range).
Optional “two closes” rule: price must close outside the range for 2 consecutive candles.
BUY BO: Trigger when price closes above ORH + buffer with momentum.
SELL BD: Trigger when price closes below ORL – buffer with momentum.
Labels and alerts are plotted for quick action.
4. Practical Usage
Works best on 5-minute charts for intraday trading.
Designed to help traders capture both:
Range-bound moves during the day (mean reversion plays).
Strong directional breakouts when institutions push price beyond the opening range.
Particularly effective on expiry days, trending sessions, and major news days when breakouts are more likely.
On sideways days, Range Mode provides reliable scalp opportunities at the OR edges.
5. Features
Auto-plots Opening Range High, Low, Midline.
Box + line visuals (no repainting).
Buy/Sell labels for both Range Mode and Breakout Mode.
Customizable buffers (ATR, % of range) to suit volatility.
Alerts for all signals (breakouts and range plays).
Built with risk management in mind (suggested SL and TP shown on chart).

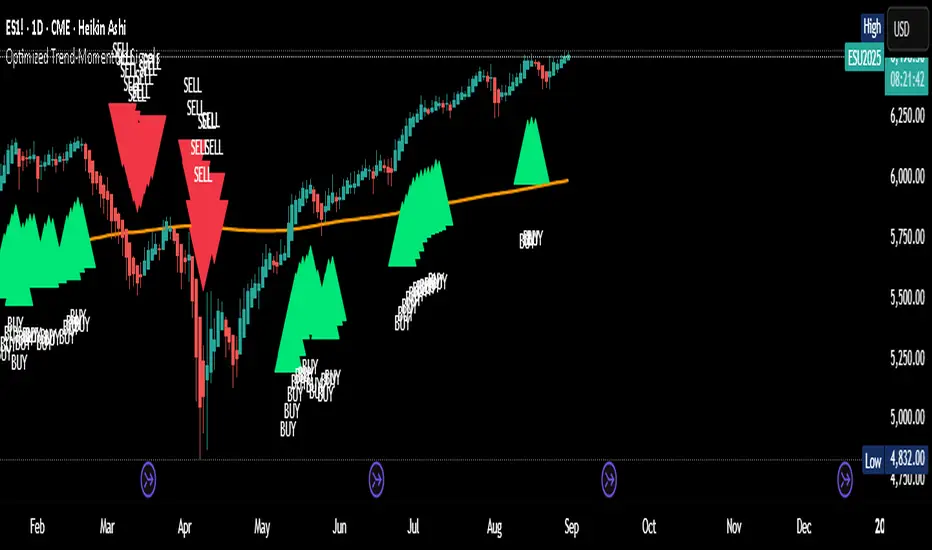
Optimized Trend-Momentum SignalsThis indicator combines trend, momentum, and volume-strength factors into a single buy/sell signal system. It integrates:
SMA 200 → Identifies the long-term trend (price above = bullish bias, below = bearish bias).
MACD (12,26,9) → Confirms momentum direction with line crossovers.
RSI (7) → Filters strength (above 50 = bullish, below 50 = bearish).
ROC (45) → Validates positive or negative rate of change.
Signal Logic:
Buy Signal → Price above SMA 200, MACD bullish, RSI > 50, and ROC > 0.
Sell Signal → Price below SMA 200, MACD bearish, RSI < 50, and ROC < 0.
Features:
Clear arrows for BUY and SELL signals.
Long-term SMA plotted for trend visualization.
Alerts built-in for real-time notifications.
This tool helps traders filter out noise and act only when all major confirmation factors align, reducing false signals and improving decision-making.
Alt Season vs USDT Flow DashboardWhat the script tells you (the signals)
It builds four “alt vs stables” lenses and colors the background when they agree.
ALT ex-ETH / STABLES (TOTAL3 / (USDT+USDC+DAI))
Think: “How much alt cap per $1 of dry-powder stables?”
Bullish when price is above its 200-day SMA and rising → risk appetite expanding toward smaller alts.
ALT Share of Risk-On ((TOTAL − STABLES − BTC − ETH) / (TOTAL − STABLES))
Of the non-stable crypto pie, how much is flowing to ex-BTC/ETH alts?
Uptrend = broadening alt participation (late-early to mid alt-season behavior).
Dominance Spread ((TOTAL3 / TOTAL) − (STABLES / TOTAL))
Alts’ share minus stables’ share.
Widening spread means stables are being converted into alts (not just into BTC).
Flow Ratio ROC(TOTAL3, N) / ROC(STABLES, N) (default N=30 days)
Compares alts’ growth rate to stable supply growth.
> 1 and sustained → alts expanding faster than new “dry powder” is appearing.
The background color (“regime”)
Green (ALT-on) when all three conditions align:
ALT/Stable > its SMA
Dominance Spread > its SMA
Flow Ratio > 1
Red (ALT-off) when the opposite holds.
No color = mixed/chop.
How to read it (quick playbook)
Early alt-season tell:
BTC.D starts to slip, total market cap (TOTAL) rising.
ALT/Stable breaks above its 200-SMA and stays there.
Dominance Spread climbs (alts gaining share, stables losing share).
Flow Ratio > 1 for a few weeks.
Maturing phase: ALT Share of Risk-On rises (money broadens from ETH/L1s → mid/small caps).
Exhaustion/false start: Flow Ratio dips < 1 or ALT/Stable loses the 200-SMA while BTC.D stabilizes or rises.
Practical tips
Timeframes: Make calls on 1D. Use 1W to avoid whipsaw; use 4H only for entries once the 1D regime is green.
Smoothing: If you see noisy spikes from market-cap revisions, add a light smoother (e.g., 7D SMA on the plotted lines).
Parameters:
Try ROC length 21–45 days.
Try SMA 150–250 days (200 is a good middle).
Confluence: Keep BTC.D and ETH.D in another pane. Best alt windows: BTC.D trending down, ETH.D flat-to-up initially, then ETH.D flattens as TOTAL3 momentum spreads to mid/small caps.
Risk checks: If USDT.D/USDC.D (stable dominance) spike up while your signals are green, that’s a caution flag (capital retreating to stables).

EMA 20–55 + SMMA50 (20↔55 Band, Alerts, Color Controls)This script plots a customizable EMA ribbon and a smoothed moving average (SMMA).
Key features:
EMA 20 (blue) and EMA 55 (yellow) highlighted with a green/red background ribbon depending on trend.
Optional middle EMAs (25, 30, 35, 40, 45, 50) can be shown or hidden.
SMMA (50) plotted in white as a trend smoother.
Customizable line colors, band colors, and transparency.
Alerts for EMA20/EMA55 bullish or bearish crossovers.
Optional candle bar coloring based on trend.
This is useful for quickly spotting medium-term trend shifts when EMA20 crosses EMA55, while still tracking the broader EMA ribbon context.

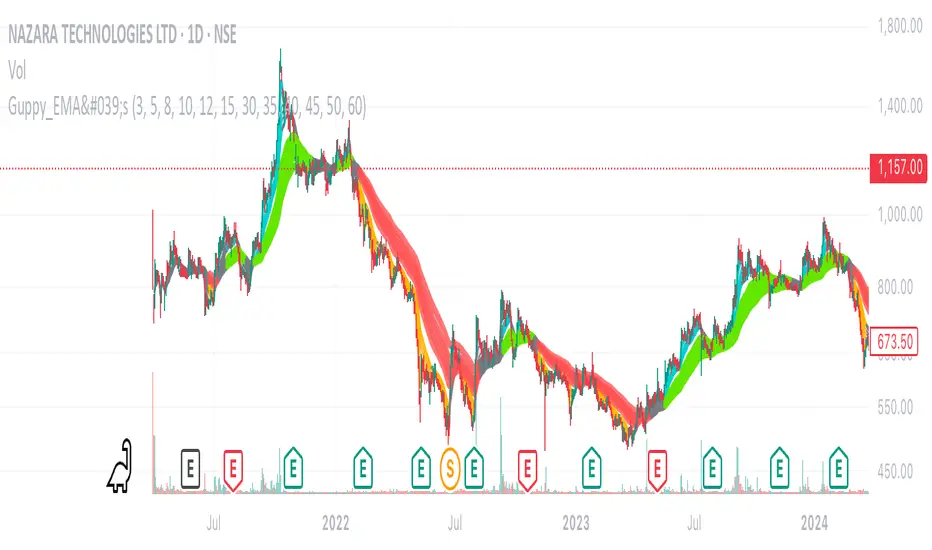
Daryl Guppy's Multiple Moving Averages - GMMAThe Guppy EMAs indicator (Daryl Guppy’s method) displays two groups of exponential moving averages (EMAs) on the chart:
Fast EMA group: 3, 5, 8, 10, 12, 15 periods (thinner, more responsive lines)
Slow EMA group: 30, 35, 40, 45, 50, 60 periods (thicker, smoother lines)
Color Logic:
Fast EMAs turn AQUA if all fast EMAs are in bullish alignment and slow EMAs are in bullish alignment.
Fast EMAs turn ORANGE if all fast EMAs are in bearish alignment and slow EMAs are in bearish alignment.
Otherwise, fast EMAs appear GRAY.
Slow EMAs turn LIME when in bullish order, RED when bearish, and remain GRAY otherwise.
The area between the outermost fast EMAs and slow EMAs is filled with a semi-transparent silver color for visual emphasis.
Multi-TF Trend Table (Configurable)1) What this tool does (in one minute)
A compact, multi‑timeframe dashboard that stacks eight timeframes and tells you:
Trend (fast MA vs slow MA)
Where price sits relative to those MAs
How far price is from the fast MA in ATR terms
MA slope (rising, falling, flat)
Stochastic %K (with overbought/oversold heat)
MACD momentum (up or down)
A single score (0%–100%) per timeframe
Alignment tick when trend, structure, slope and momentum all agree
Use it to:
Frame bias top‑down (M→W→D→…→15m)
Time entries on your execution timeframe when the higher‑TF stack is aligned
Avoid counter‑trend traps when the table is mixed
2) Table anatomy (each column explained)
The table renders 9 columns × 8 rows (one row per timeframe label you define).
TF — The label you chose for that row (e.g., Month, Week, 4H). Cosmetic; helps you read the stack.
Trend — Arrow from fast MA vs slow MA: ↑ if fastMA > slowMA (up‑trend), ↓ otherwise (down‑trend). Cell is green for up, red for down.
Price Pos — One‑character structure cue:
🔼 if price is above both fast and slow MAs (bullish structure)
🔽 if price is below both (bearish structure)
– otherwise (between MAs / mixed)
MA Dist — Distance of price from the fast MA measured in ATR multiples:
XS < S < M < L < XL according to your thresholds (see §3.3). Useful for judging stretch/mean‑reversion risk and stop sizing.
MA Slope — The fast MA one‑bar slope:
↑ if fastMA - fastMA > 0
↓ if < 0
→ if = 0
Stoch %K — Rounded %K value (default 14‑1‑3). Background highlights when it aligns with the trend:
Green heat when trend up and %K ≤ oversold
Red heat when trend down and %K ≥ overbought Tooltip shows K and D values precisely.
Trend % — Composite score (0–100%), the dashboard’s confidence for that timeframe:
+20 if trendUp (fast>slow)
+20 if fast MA slope > 0
+20 if MACD up (signal definition in §2.8)
+20 if price above fast MA
+20 if price above slow MA
Background colours:
≥80 lime (strong alignment)
≥60 green (good)
≥40 orange (mixed)
<40 grey (weak/contrary)
MACD — 🟢 if EMA(12)−EMA(26) > its EMA(9), else 🔴. It’s a simple “momentum up/down” proxy.
Align — ✔ when everything is in gear for that trend direction:
For up: trendUp and price above both MAs and slope>0 and MACD up
For down: trendDown and price below both MAs and slope<0 and MACD down Tooltip spells this out.
3) Settings & how to tune them
3.1 Timeframes (TF1–TF8)
Inputs: TF1..TF8 hold the resolution strings used by request.security().
Defaults: M, W, D, 720, 480, 240, 60, 15 with display labels Month, Week, Day, 12H, 8H, 4H, 1H, 15m.
Tips
Keep a top‑down funnel (e.g., Month→Week→Day→H4→H1→M15) so you can cascade bias into entries.
If you scalp, consider D, 240, 120, 60, 30, 15, 5, 1.
Crypto weekends: consider 2D in place of W to reflect continuous trading.
3.2 Moving Average (MA) group
Type: EMA, SMA, WMA, RMA, HMA. Changes both fast & slow MA computations everywhere.
Fast Length: default 20. Shorten for snappier trend/slope & tighter “price above fast” signals.
Slow Length: default 200. Controls the structural trend and part of the score.
When to change
Swing FX/equities: EMA 20/200 is a solid baseline.
Mean‑reversion style: consider SMA 20/100 so trend flips slower.
Crypto/indices momentum: HMA 21 / EMA 200 will read slope more responsively.
3.3 ATR / Distance group
ATR Length: default 14; longer makes distance less jumpy.
XS/S/M/L thresholds: define the labels in column MA Dist. They are compared to |close − fastMA| / ATR.
Defaults: XS 0.25×, S 0.75×, M 1.5×, L 2.5×; anything ≥L is XL.
Usage
Entries late in a move often occur at L/XL; consider waiting for a pullback unless you are trading breakouts.
For stops, an initial SL around 0.75–1.5 ATR from fast MA often sits behind nearby noise; use your plan.
3.4 Stochastic group
%K Length / Smoothing / %D Smoothing: defaults 14 / 1 / 3.
Overbought / Oversold: defaults 70 / 30 (adjust to 80/20 for trendier assets).
Heat logic (column Stoch %K): highlights when a pullback aligns with the dominant trend (oversold in an uptrend, overbought in a downtrend).
3.5 View
Full Screen Table Mode: centers and enlarges the table (position.middle_center). Great for clean screenshots or multi‑monitor setups.
4) Signal logic (how each datapoint is computed)
Per‑TF data (via a single request.security()):
fastMA, slowMA → based on your MA Type and lengths
%K, %D → Stoch(High,Low,Close,kLen) smoothed by kSmooth, then %D smoothed by dSmooth
close, ATR(atrLen) → for structure and distance
MACD up → (EMA12−EMA26) > EMA9(EMA12−EMA26)
fastMA_prev → yesterday/previous‑bar fast MA for slope
TrendUp → fastMA > slowMA
Price Position → compares close to both MAs
MA Distance Label → thresholds on abs(close − fastMA)/ATR
Slope → fastMA − fastMA
Score (0–100) → sum of the five 20‑point checks listed in §2.7
Align tick → conjunction of trend, price vs both MAs, slope and MACD (see §2.9)
Important behaviour
HTF values are sampled at the execution chart’s bar close using Pine v6 defaults (no lookahead). So the daily row updates only when a daily bar actually closes.
5) How to trade with it (playbooks)
The table is a framework. Entries/exits still follow your plan (e.g., S/D zones, price action, risk rules). Use the table to know when to be aggressive vs patient.
Playbook A — Trend continuation (pullback entry)
Look for Align ✔ on your anchor TFs (e.g., Week+Day both ≥80 and green, Trend ↑, MACD 🟢).
On your execution TF (e.g., H1/H4), wait for Stoch heat with the trend (oversold in uptrend or overbought in downtrend), and MA Dist not at XL.
Enter on your trigger (break of pullback high/low, engulfing, retest of fast MA, or S/D first touch per your plan).
Risk: consider ATR‑based SL beyond structure; size so 0.25–0.5% account risk fits your rules.
Trail or scale at M/L distances or when score deteriorates (<60).
Playbook B — Breakout with confirmation
Mixed stack turns into broad green: Trend % jumps to ≥80 on Day and H4; MACD flips 🟢.
Price Pos shows 🔼 across H4/H1 (above both MAs). Slope arrows ↑.
Enter on the first clean base‑break with volume/impulse; avoid if MA Dist already XL.
Playbook C — Mean‑reversion fade (advanced)
Use only when higher TFs are not aligned and the row you trade shows XL distance against the higher‑TF context. Take quick targets back to fast MA. Lower win‑rate, faster management.
Playbook D — Top‑down filter for Supply/Demand strategy
Trade first retests only in the direction where anchor TFs (Week/Day) have Align ✔ and Trend % ≥60. Skip counter‑trend zones when the stack is red/green against you.
6) Reading examples
Strong bullish stack
Week: ↑, 🔼, S/M, slope ↑, %K=32 (green heat), Trend 100%, MACD 🟢, Align ✔
Day: ↑, 🔼, XS/S, slope ↑, %K=45, Trend 80%, MACD 🟢, Align ✔
Action: Look for H4/H1 pullback into demand or fast MA; buy continuation.
Late‑stage thrust
H1: ↑, 🔼, XL, slope ↑, %K=88
Day/H4: only 60–80%
Action: Likely overextended on H1; wait for mean reversion or multi‑TF alignment before chasing.
Bearish transition
Day flips from 60%→40%, Trend ↓, MACD turns 🔴, Price Pos “–” (between MAs)
Action: Stand aside for longs; watch for lower‑high + Align ✔ on H4/H1 to join shorts.
7) Practical tips & pitfalls
HTF closure: Don’t assume a daily row changed mid‑day; it won’t settle until the daily bar closes. For intraday anticipation, watch H4/H1 rows.
MA Type consistency: Changing MA Type changes slope/structure everywhere. If you compare screenshots, keep the same type.
ATR thresholds: Calibrate per asset class. FX may suit defaults; indices/crypto might need wider S/M/L.
Score ≠ signal: 100% does not mean “must buy now.” It means the environment is favourable. Still execute your trigger.
Mixed stacks: When rows disagree, reduce size or skip. The tool is telling you the market lacks consensus.
8) Customisation ideas
Timeframe presets: Save layouts (e.g., Swing, Intraday, Scalper) as indicator templates in TradingView.
Alternative momentum: Replace the MACD condition with RSI(>50/<50) if desired (would require code edit).
Alerts: You can add alert conditions for (a) Align ✔ changes, (b) Trend % crossing 60/80, (c) Stoch heat events. (Not shipped in this script, but easy to add.)
9) FAQ
Q: Why do I sometimes see a dash in Price Pos? A: Price is between fast and slow MAs. Structure is mixed; seek clarity before acting.
Q: Does it repaint? A: No, higher‑TF values update on the close of their own bars (standard request.security behaviour without lookahead). Intra‑bar they can fluctuate; decisions should be made at your bar close per your plan.
Q: Which columns matter most? A: For trend‑following: Trend, Price Pos, Slope, MACD, then Stoch heat for entries. The Score summarises, and Align enforces discipline.
Q: How do I integrate with ATR‑based risk? A: Use the MA Dist label to avoid chasing at extremes and to size stops in ATR terms (e.g., SL behind structure at ~1–1.5 ATR).

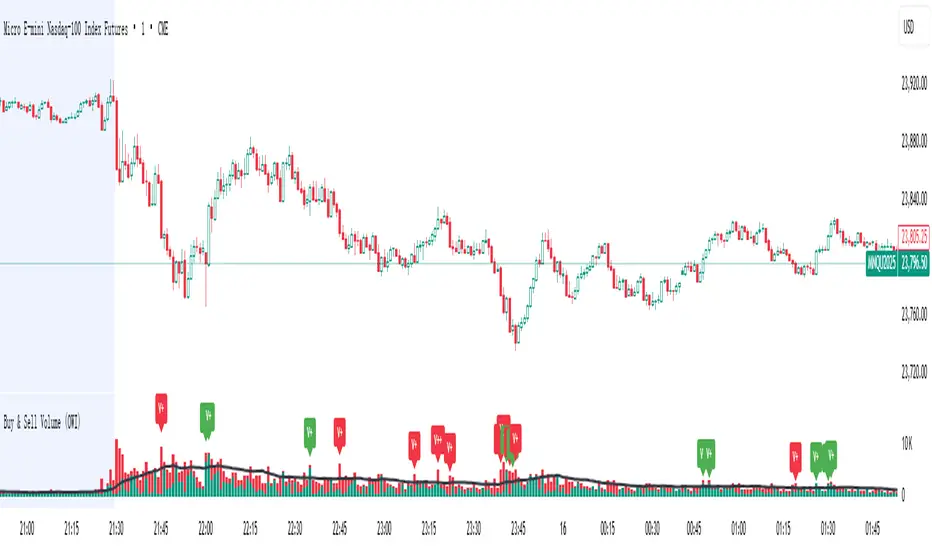
Buy & Sell Volume (OWI)📊 Buy & Sell Volume (OWI) Indicator Guide
The Buy & Sell Volume (OWI) indicator is designed to provide a visual breakdown of buying and selling pressure in each candle, helping traders identify volume surges and potential market moves. It also includes a time filter to focus analysis during key trading hours.
⚙️ Setup & Inputs
When adding the indicator to your chart, you'll see several configurable inputs:
SMA Length : Sets the period for the Simple Moving Average (SMA) of total volume.
Enable Time Filter : Toggles whether to restrict analysis to US market hours (Eastern Time). |
Start Hour/Minute : Defines the beginning of the time filter window (default: 9:45 ET). |
End Hour/Minute : Defines the end of the time filter window (default: 16:15 ET). |
📈 How It Works
🔍 Volume Breakdown
Buy Volume: Estimated volume attributed to buyers, calculated based on candle position.
Sell Volume: Estimated volume attributed to sellers.
Total Volume SMA: A moving average of total volume to benchmark current activity.
⏰ Time Filter (Optional)
When enabled, the indicator only highlights volume spikes during the specified US market hours. This helps filter out noise from pre-market or after-hours trading.
🚨 Highlight Conditions
The indicator flags significant volume spikes with labels above the volume bars:
| Label | Condition |
| V+ | Volume is between 1.5× and 2× the SMA, during market hours (if enabled). |
| V++ | Volume exceeds 2× the SMA, during market hours (if enabled). |
💡 Tips
- Use shorter SMA lengths for more reactive volume analysis.
- Change the time filter if you're trading outside US market hours.
- Combine with candlestick patttern to confirm breakout or reversal signals.
ABS NR — Fail-Safe Confirm (v4.2.2)
# ABS NR — Fail-Safe Confirm (v4.2.2)
## What it is (quick take)
**ABS NR FS** is a **non-repainting “arm → confirm” entry framework** for intraday and swing execution. It blends:
* **Regime** (EMA stack + 60-min slope),
* **Location** (Keltner basis/edges),
* **Stretch** (session-anchored **VWAP Z-score**),
* **Momentum gating** (TSI cross/slope),
* **Guards** (session window, minimum ATR%, gap filter, optional market alignment).
You’ll see a **small dot** when a setup is **armed** (candidate) and a **triangle** when that setup **confirms** within a user-defined number of bars. A **gray “X”** marks a timeout (candidate canceled).
> Tip: This entry tool works best when paired with a trend context filter and a dedicated exit tool.
---
## How to use it (operational workflow)
1. **Read the regime**
* **Bull trend**: fast > slow > long EMA **and** 60-min slope up.
* **Bear trend**: fast < slow < long EMA **and** 60-min slope down.
* **Range**: neither bull nor bear.
2. **Wait for a candidate (dot)**
Two families:
* **Reclaim (trend-following):** price crosses the **KC basis** with acceptable |Z| (not overstretched) and passes the TSI gate.
* **Fade (range-revert):** price **pokes a KC band**, prints a **reversal wick**, |Z| is stretched, and TSI gate agrees.
3. **Trade the confirmation (triangle)**
The confirm must occur **within N bars** and follow your chosen **Confirm mode** logic (see Inputs). If confirmation doesn’t arrive in time, an **X** cancels the candidate.
4. **Use guards to avoid junk**
Session windows (US focus), minimum ATR%, gap guard, and optional **market alignment** (e.g., SPY above EMA20 for longs).
5. **Manage the position**
* Entries: take **triangles** in the direction of your playbook (reclaims with trend; fades in clean ranges).
* Filters and exits: use your own process or pair with a trend/exit companion.
---
## Visual semantics & alerts
* **Candidate L / S (dot)** → a setup armed on this bar.
* **CONFIRM L / S (triangle)** → actionable signal that met confirm rules within your time window.
* **Cancel L / S (X)** → candidate expired without confirmation; ignore the dot.
**Alerts (stable names for automation):**
* **ABS FS — Confirmed** → fires on confirmed long or short.
* **ABS FS — Candidate Armed** → fires as a candidate arms.
---
## Non-repainting behavior (why signals don’t repaint)
* All HTF requests use **lookahead\_off**.
* With **Strict NR = true**, the 60-min slope uses the **prior completed** 60-min bar and arming/confirming only occurs on confirmed bars.
* Confirmation triangles finalize on bar close.
* If you disable strictness, signals may appear slightly earlier but with more intrabar sensitivity.
---
## Inputs reference (what each control does and the trade-offs)
### A) Behavior / Modes
**Mode** (`Turbo / Aggressive / Balanced / Conservative`)
Changes multiple internal thresholds:
* **Turbo** → most signals; relaxes prior-bar break & VWAP-side checks and time/vol/gap guards. Highest frequency, highest noise.
* **Aggressive** → more signals than Balanced, fewer than Turbo.
* **Balanced** → default; steady trade-off of frequency vs. quality.
* **Conservative** → tightens |Z| and other checks; fewest but cleanest signals.
**Strict NR (bar close + prior HTF 60m)**
* **true** = safer: uses prior 60-min slope; arms/confirms on confirmed bars → **fewer/cleaner** signals.
* **false** = earlier and more reactive; slightly noisier.
---
### B) Keltner Channel (location engine)
* **KC EMA Length (`kcLen`)**
Higher → smoother basis (fewer basis crosses). Lower → snappier basis (more crosses).
* **ATR Length (`atrLen`)**
Higher → steadier band width; Lower → more reactive band width.
* **KC ATR Mult (`kcMult`)**
Higher → wider bands (fewer edge pokes → fewer fades). Lower → narrower (more fades).
---
### C) Trend & HTF slope
* **Trend EMA Fast/Slow/Long (`emaFastLen / emaSlowLen / emaLongLen`)**
Larger = slower regime flips (fewer reclaims); smaller = faster flips (more reclaims).
* **HTF EMA Len (60m) (`htfLen`)**
Larger = steadier HTF slope (fewer signals); smaller = more sensitive (more signals).
---
### D) VWAP Z-Score (stretch / mean-revert logic)
* **VWAP Z-Length (`zLen`)**
Window for Z over session-anchored VWAP distance. Larger = smoother |Z| (fewer fades/re-entries). Smaller = more reactive (more).
* **Range Fade |Z| (base) (`zFadeBase`)**
Minimum |Z| to allow **fades** in ranges. Raise to demand more stretch (fewer fades). Lower to take more fades.
* **Max |Z| Trend Re-entry (base) (`maxZTrendBase`)**
Caps how stretched price can be and still permit **reclaims** with trend. Lower = stricter (avoid chases). Higher = will chase further.
---
### E) TSI Momentum Gate
* **TSI Long/Short/Signal (`tsiLong / tsiShort / tsiSig`)**
Larger = smoother/laggier momentum; smaller = snappier.
* **TSI gate (`CrossOnly / CrossOrSlope / Off`)**
* **CrossOnly**: require TSI cross of its signal (strict).
* **CrossOrSlope**: cross *or* favorable slope (balanced default).
* **Off**: no momentum gate (most signals, most noise).
---
### F) Guards (filters to avoid low-quality tape)
* **US focus 09:35–10:30 & 14:00–15:45 (base) (`useTimeBase`)**
`true` limits to high-quality windows. `false` trades all session.
* **Skip N bars after 09:30 ET (`skipFirst`)**
Skips the open scramble. Larger = skip longer.
* **Min volatility ATR% (base)** = `useVolMinBase` + `atrPctMinBase`
Requires `ATR(10)/Close*100 ≥ atrPctMinBase`. Raise threshold to avoid dead tape; lower to accept quieter sessions.
* **Gap guard (base)** = `gapGuardBase` + `gapMul`
Blocks signals when the opening gap exceeds `gapMul * ATR`. Increase `gapMul` to allow more gapped opens; decrease to be stricter.
---
### G) Visuals & Sides
* **Plot Keltner (`plotKC`)** → show/hide basis & bands.
* **Show Longs / Show Shorts** → enable/disable each side.
---
### H) Fail-Safe Confirmation
* **Confirm mode (`BreakHighOnly / BreakHigh+Hold / TwoBarImpulse`)**
* **BreakHighOnly**: confirm by taking out the armed bar’s extreme. Fastest, most frequent.
* **BreakHigh+Hold**: must **break**, have **body ≥ X·ATR**, **and** hold above/below the basis → higher quality, fewer signals.
* **TwoBarImpulse**: decisive follow-through vs. prior bar with **body ≥ X·ATR** → momentum-biased confirmations.
* **Confirm within N bars (`confirmBars`)**
Confirmation window size. Smaller = faster validation; larger = more patience (can be later).
* **Impulse body ≥ X·ATR (`impulseBodyATR`)**
Raise for stronger confirmations (fewer weak triangles). Lower to accept lighter pushes.
* **Require market alignment (`needMarket`) + `marketTicker`**
When enabled: Longs require **market > EMA20 (5m)**; Shorts require **market < EMA20 (5m)**.
* **Diagnostics: Show debug letters (`debug`)**
Tiny “B/C” audit marks for base/confirm while tuning.
---
## Tuning recipes (quick, practical)
* **If you’re getting chopped:**
* Set **Mode = Conservative**
* **Confirm mode = BreakHigh+Hold**
* Raise **impulseBodyATR** (e.g., 0.45)
* Keep **needMarket = true**
* Keep **Strict NR = true**
* **If you need more signals:**
* **Mode = Aggressive** (or Turbo if you accept more noise)
* **Confirm mode = BreakHighOnly**
* Lower **impulseBodyATR** (0.25–0.30)
* Increase **confirmBars** to 3
* **Range-day focus (fades):**
* Keep session guard on
* Raise **zFadeBase** to demand real stretch
* Keep **maxZTrendBase** moderate (don’t chase)
* **Trend-day focus (reclaims):**
* Slightly **lower `maxZTrendBase`** (avoid chasing excessive stretch)
* Use **CrossOrSlope** TSI gating
* Consider turning **needMarket** on
---
## Best practices & notes
* **Instrument specificity:** Tune Z, TSI, and guards per symbol and timeframe.
* **Session awareness:** Session filter uses **exchange-local** time; adjust for non-US markets.
* **Automation:** Use the two provided alert names; they’re stable.
* **Risk management:** Confirmation improves quality but doesn’t remove risk. Always pre-define stop/size logic.
---
## Suggested starting point (balanced profile)
* **Mode = balanced**
* **Strict NR = true**
* **Confirm mode = BreakHigh+Hold**
* **confirmBars = 2**
* **impulseBodyATR ≈ 0.35**
* **needMarket = off** (turn on for extra confluence)
* Leave Keltner/TSI defaults; then nudge `zFadeBase` and `maxZTrendBase` to match your symbol.
---
*This tool is a signal generator, not a broker or strategy. Validate on your markets/timeframes and integrate with your risk plan.*

OPR — DAX or USEnglish
This indicator automatically plots the Opening Price Range (OPR) for different indices, with customizable start and end times for each instrument.
For the DAX, it draws the high (green), low (red), and midline (grey dotted) for the specified range, defaulting to 09:00–09:15, and extends the lines until the selected end time (default 11:00).
For US indices (Dow Jones, Nasdaq, S&P500), it applies the same logic for the default 15:30–15:45 range, with two vertical black bars marking the start and end of the time window.
Each symbol only displays its own relevant lines (e.g., viewing DAX will only show DAX markers).
Parameters allow adjusting times and visibility for each market.