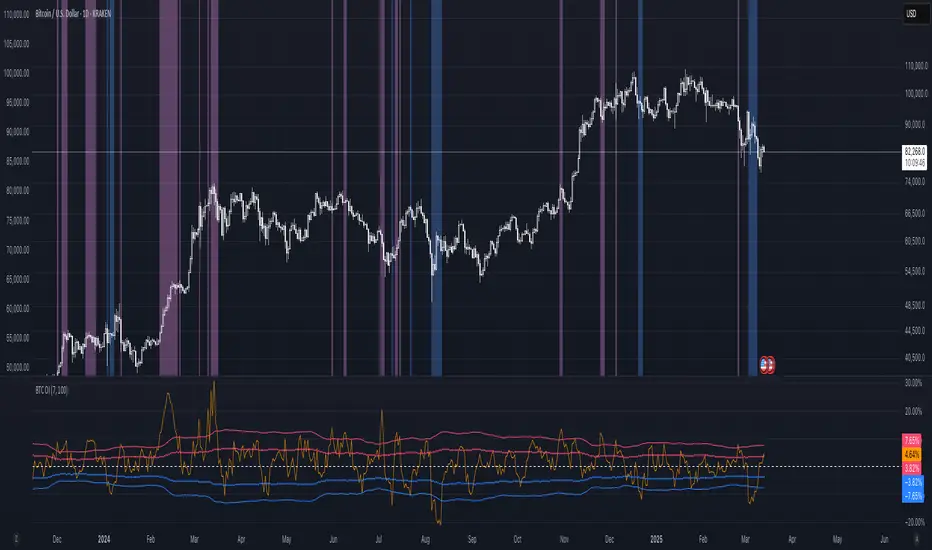
BTC — CVD Divergence (Spot & Perp, robuste v6)If the price is above the CVD, it usually means the move is being pushed by leverage rather than real buying — the market is stretched and at risk of a correction.
If the price is below the CVD, it suggests that buyers are quietly absorbing — pressure is building for a bullish recovery once leverage clears out.
Recherche dans les scripts pour "BTC"

BTC Cycle Halving Thirds NicoThe bold black vertical lines are the INDEX:BTCUSD halvings.
The background speak for itself.
Time to be bearish?

BTC 4H — No-3% Pullback Moves (>=7%, wick-to-wick)4h candles move without pullbacks 3%
in settings you can set a pullback %
and i try to got middle % of such moves

BTC Pro – Modular v6 (Final Version with Clean Labels)A complete Bitcoin charting toolkit built for clarity and decision-making.
✅ EMA levels (21, 50, 200, 800)
✅ Daily EMA 50 (constant across timeframes)
✅ SuperTrend for directional bias
✅ Liquidity zones based on ±2×ATR around SMA50
✅ On-Balance Volume (manual calculation)
✅ ADX trend strength with threshold labeling
✅ RSI divergence detection (bullish/bearish)
✅ Market structure: HH/LL breaks
✅ Entry zones with auto-generated SL/TP boxes
✅ Clean right-side labels (stacked)
✅ Modular toggles for full control via settings
Created by WhyPhy – modular, readable, and ready for live use.

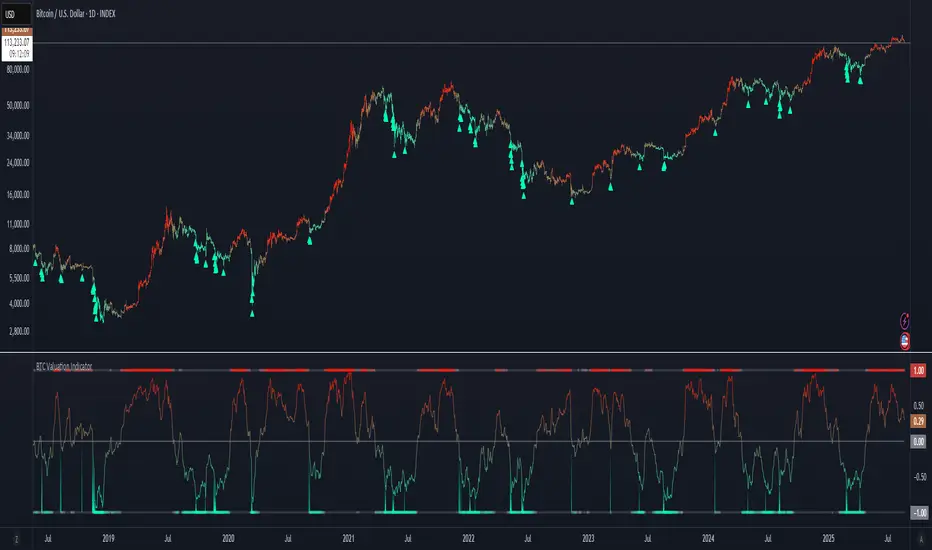
BTC Valuation Indicator╔═══════════════════ RUBIXCUBE ══════════════════════╗
This indicator combines multiple on-chain and market-based metrics into a single valuation score for Bitcoin. It highlights periods of relative undervaluation (green zones) and overvaluation (red zones) by normalising several metrics into a 0–1 range and averaging them.
- Price chart signals (top panel): Green arrows mark points where the indicator flagged historically attractive buying opportunities.
- Valuation oscillator (bottom panel): Shows the combined score over time, cycling between undervalued and overvalued extremes.
- Metric breakdown (side panel): Displays the contribution of each metric, their rate of change, and their current score.
This tool is designed for macro insight, not short-term trading. It helps contextualise Bitcoin’s position in the market cycle and provides a data-driven framework for long-term investors.
╚═════════════════════════════════════════════════╝
BTCÐ&SOL 5M Sinal IndicatorThis is a signal indicator that combines MACD, RSI, and three moving averages. When all signals match, the entry signal is determined based on the golden cross/death cross of the moving averages.
The entry signal is set so that it does not occur when the RSI value is below 30 or above 70.
It also prevents countertrend trading based on the long-term moving average.
Based on Ethereum, it can achieve a 70% win rate and a 3:1 profit-to-loss ratio.
Compatible with Luxalgo S&O indicator.

BTCÐ&SOL 5M Sinal IndicatorThis is a signal indicator that combines MACD, RSI, and three moving averages. When all signals match, the entry signal is determined based on the golden cross/death cross of the moving averages.
The entry signal is set so that it does not occur when the RSI value is below 30 or above 70.
It also prevents countertrend trading based on the long-term moving average.
Based on Ethereum, it can achieve a 70% win rate and a 3:1 profit-to-loss ratio.

BTC Correlation CoefficientThe BTCUSDT Correlation Coefficient indicator measures the strength and direction of the relationship between the selected asset (e.g., a stock or altcoin) and the price of BTCUSDT over a chosen time period. It uses a custom correlation function to calculate how closely the asset's price movements align with Bitcoin, returning a value between -1 and +1. A coefficient near +1 indicates strong positive correlation, while values near -1 indicate inverse correlation. This helps traders assess whether the asset tends to follow Bitcoin’s price trends or behave independently, enabling more informed decisions on portfolio diversification and market sentiment alignment.

BTC Transaction Indicator Name: "Bitcoin On-Chain Volume & Dynamic Parabolic Curve Signals"
Purpose:
This indicator is designed for Bitcoin traders and long-term holders. It combines the analysis of Bitcoin's on-chain transaction volume with price action to generate "Whale" and "Bear" signals. Additionally, it features a unique dynamic parabolic curve that acts as a visual support line, adapting its visibility based on price interaction with a key Exponential Moving Average (EMA).
Key Components:
On-Chain Volume Analysis:
Utilizes Estimated Transaction Volume (ETRAV) data from the Bitcoin blockchain.
Calculates fast and slow Simple Moving Averages (SMAs) of this volume.
Identifies volume trends (up/down) and significant volume increases/decreases.
Employs fixed thresholds (2,500,000 for low volume and 25,000,000 for high volume) to define key activity levels, similar to how historical on-chain analysis defined accumulation and distribution zones.
Price Action Analysis:
Calculates fast and slow SMAs of the price.
Detects price trends (up/down), recoveries, and declines based on these price SMAs.
"Whale" and "Bear" Signals:
Whale Signals (Buy-side): Generated when there's an upward volume trend, significant volume increase, and a downward price trend followed by price recovery. These indicate potential accumulation phases.
Bear Signals (Sell-side): Generated when there's a downward volume trend, significant volume decrease, and an upward price trend followed by price decline. These indicate potential distribution phases.
Visuals: Both types of signals are plotted as small, colored circles directly on the price chart, with corresponding text labels ("Whale," "Buy," "Bear," "Sell," "Price Recovering," "Price Declining").
Dynamic Parabolic Curve:
Concept: A green parabolic (exponential) curve that serves as a dynamic visual support line.
Activation: The curve starts drawing automatically only when the price crosses over the EMA 500 (Exponential Moving Average of 500 periods). The curve's starting point is set at a user-defined percentage below the EMA 500 value at that exact crossover point.
Visibility: The curve remains visible and continues its trajectory only as long as the price stays above the EMA 500.
Deactivation: The curve disappears instantly if the price falls below or equals the EMA 500. It will only reappear if the price crosses above the EMA 500 again.
Customization: The curve's steepness (Tasa Crecimiento Curva) and its initial distance from the EMA 500 (Inicio Curva % por debajo de EMA500) are adjustable.
Dynamic Label: A "Parabólico" text label is plotted near the center of the active curve segment, with an adjustable vertical offset to ensure it stays visually appealing below the curve.
What is PLOTTED on the chart:
The small, colored circle signals for Whale/Buy and Bear/Sell activity.
The green dynamic parabolic curve.
What is NOT PLOTTED:
EMA 200, EMA 500 lines (though they are calculated internally for logic).
Raw volume data or volume Moving Averages (these are only used for signal calculation, not plotted).
Ideal for:
Bitcoin traders and investors focused on long-term trends and cycle analysis, who want visual cues for accumulation/distribution phases based on on-chain activity, complemented by a unique, dynamically appearing parabolic support curve.
Important Notes:
Relies on the availability of external on-chain data (QUANDL:BCHAIN) within TradingView.
Functions best on a daily timeframe for optimal on-chain data relevance.

BTC Price-Volume Efficiency Z-Score (PVER-Z)Overview:
This PVER-Z Score measures Bitcoin’s price movement efficiency relative to trading volume, normalized using a Z-Score over a long-term 200-day period.
It highlights statistically rare inefficiencies, helping investors spot extreme accumulation and distribution zones for systematic SDCA strategies.
Concept:
- Measures how efficiently price has moved relative to the volume that supported it over a long historical window (Default 200 days) but can be adjustable.
- It compares cumulative price changes vs cumulative volume flow.
- Then normalizes those inefficiencies using Z-Score statistics.
How It Works:
1. Calculates the absolute daily price change divided by volume (price-volume efficiency ratio).
2. Applies EMA smoothing to remove noisy fluctuations.
3. Normalizes the result into a Z-Score to detect statistically significant outliers.
4. Plots dynamic heatmap colors as the efficiency score moves through different deviation zones.
5. Background fills appear when the Z-Score moves beyond ±2 to ±3 SD, signaling rare macro opportunities.
Why is Bitcoin price rising while PVER-Z is falling toward green zone?
1. PVER-Z is not just "price" — it's price change relative to volume. PVER-Z measures how efficient the price movement is relative to volume. It's not "price going up" or "price going down" directly. It's how unusual or inefficient the price versus volume relationship is, compared to its historical average.
2. A rising Bitcoin price + weak efficiency = PVER-Z falls.
If Bitcoin rises but volume is super strong (normal buying volume), no problem, the PVER-Z stays normal. If Bitcoin rises but with very weak volume support, PVER-Z falls.
***Usage Notes***:
- Best used on the daily timeframe or higher.
- When the Z-Score enters the green zone (-2 to -3 SD), it signals a historically rare accumulation zone — favoring long-term buying for SDCA.
- When the Z-Score enters the red zone (+2 to +3 SD), it signals overextended distribution — caution recommended.
- Designed strictly for mean-reversion analysis, no trend-following signals.
- The red zone on a proper Z chart would be -2SD to -3SD and +2SD to +3SD for the green zone. At the time of publishing I do not know how to adjust the values on the indicator itself. The red zone at -2SD is actually +2 Standard Deviations on a Z Score SD Chart. (overbought zone).
- Your green zone at +2SD is actually -2SD Standard Deviations (oversold zone).
- Built manually with no reliance on built-in indicators
- Designed for Bitcoin on the 1D, 3D, or Weekly timeframes. NOT for intraday trading.
- DO NOT SOELY RELY ON THIS INDICATOR FOR YOUR LONG TERM VALUATION. I AM NOT RESPONSIBLE FOR YOUR FINANICAL ASSETS.

BTC: Open InterestThis indicator tracks the 7-day (default) percentage change in open interest (OI), providing insights into market participation trends. It includes customizable periods and colors, allowing traders to adjust settings for better visualization.
Open interest (OI) is the total number of active contracts (futures or options) that haven’t been closed or settled. It represents the total open positions in the market.
Thus when OI increases, more traders are entering new positions, signaling growing market interest. Conversely, when OI decreases, positions are being closed, suggesting lower trader participation or liquidation.
Attributes & Features:
Open Interest Percentage Change – Measures the 7-day % change in open interest to track market participation.
Customizable Calculation Period – Users can adjust the period (default: 7 days) for more flexible analysis.
Adjustable Colors – Allows modification of colors for better visualization.
Trend Identification – Highlights rising vs. falling open interest trends.
Works Across Assets – Can be used for cryptos, stocks, and futures with open interest data.
Overlay or Separate Panel – Can be plotted on price chart or as a separate indicator.
How It Works:
Fetches Open Interest Data – Retrieves open interest values for each day for USD, USDT, and USDC Bitcoin Perpetual Derivitives.
Calculates Percentage Change – Compares current open interest to its value X days ago (Default = 7 days).
Standard Deviation – Applies standard deviation ranging from -2 to +2 deviations to identify large shifts in OI.
Visual Alerts – Can highlight extreme increases or decreases signaling potential market shifts.
NOTE: THE INDICATOR DATA ONLY GOES BACK TO START OF 2022
BTC-USDT Liquidity Trend [Ajit Pandit]his script helps traders visualize trend direction and identify liquidity zones where price might react due to past pivot levels. The color-coded candles and extended pivot lines make it easier to spot support/resistance levels and potential breakout points.
Key Features:
1. Trend Detection Using EMA
Uses two EMA calculations to determine the trend:
emaValue: Standard EMA based on length1
correction: Adjusted price movement relative to EMA
Trend: Another EMA of the corrected value
Determines bullish (signalUp) and bearish (signalDn) signals when Trend crosses emaValue.
2. Candlestick Coloring Based on Trend
Candlesticks are colored:
Uptrend → Blue (up color)
Downtrend → Pink (dn color)
Neutral → No color
3. Liquidity Zones (Pivot Highs & Lows)
Identifies pivot highs and lows using a customizable pivot length.
Draws liquidity lines:
High pivot lines (Blue, adjustable width)
Low pivot lines (Pink, adjustable width)
Extends lines indefinitely until price breaks above/below the level.
Removes broken pivot levels dynamically.

BTC Mercenary ModelBitcoin Market Cycle Evaluation Using Subjective Z-Scores
Introduction:
I've crafted a unique indicator for Bitcoin that synthesizes multiple market indicators into a single, actionable Z-score, aiming to offer insights into the current market cycle phase. Here's the methodology:
Methodology:
Alpha Validation: Each component indicator has been tested for its predictive power (alpha) against Bitcoin's market cycle peaks and troughs from at least the last two cycles. This ensures each indicator contributes meaningfully to our model.
Z-Score Synthesis: By converting each indicator's value into a Z-score, we normalize their contributions. The average of these Z-scores provides a refined signal, indicating whether Bitcoin is in an overbought or oversold state relative to historical norms.
Features:
Individual Indicator Customization: Users can tweak inputs to optimize each indicator's alpha, enhancing the model's predictive accuracy.
Historical Averages: The script provides visibility into how both technical and fundamental indicators have scored in the past, offering a benchmark for current conditions.
ROC Flexibility: Adjust the Rate of Change (ROC) period to suit your analysis timeframe, allowing for more personalized market cycle interpretation.
Indicators Integrated:
Fundamental:
MVRV (Market Value to Realized Value) - Measures market sentiment vs. actual value.
Bitcoin Thermocap - Relates Bitcoin's market cap to its transaction volume.
NUPL (Net Unrealized Profit/Loss) - Indicates holder's profit or loss status.
CVDD (Coin Days Destroyed) - Shows the movement of long-held coins.
SOPR (Spent Output Profit Ratio) - Highlights whether coins are being spent at a profit or loss.
Technical:
RSI (Relative Strength Index) - Identifies overbought/oversold conditions.
CCI (Commodity Channel Index) - Detects cyclical turns in Bitcoin's price.
Multiple Moving Averages - For trend analysis over various time frames.
Sharpe Ratio - Evaluates risk-adjusted return.
Pi Cycle Indicator - Predicts cycle tops based on moving average crossovers.
Hodrick-Prescott Filter - Separates trend from cycle in price data.
VWAP (Volume Weighted Average Price) - Provides a trading benchmark.
How It Works Together:
This model uses a weighted average of Z-scores from these indicators to give a comprehensive view of Bitcoin's market cycle. The Z-scores are not just summed but considered in context; for example, when fundamental indicators like MVRV suggest an overvaluation while technical ones like RSI indicate a near-term correction, the model's output reflects this nuanced interaction.
Future Developments:
The next step is to include sentiment analysis, potentially from social media or news sentiment, to further refine our cycle predictions.
Chart Example:
Symbol/Timeframe: BTCUSD on a daily chart.
Script Name: Bitcoin Cycle Z-Score Evaluator
Feedback Encouraged:
I'm eager to receive feedback on how this model could be further tailored or expanded for better market insights.
-CM

BTC vs Mag7 Combined IndexThis Mag7 Combined Index script is a custom TradingView indicator that calculates and visualizes the collective performance of the Magnificent 7 (Mag7) stocks—Apple, Microsoft, Alphabet, Amazon, NVIDIA, Tesla, and Meta (red line) compared to Bitcoin (blue line). It normalizes the daily closing prices of each stock to their initial value on the chart, scales them into percentages, and then computes their simple average to form a combined index. The result is plotted as a single red line, offering a clear view of the aggregated performance of these influential stocks over time compared to Bitcoin.
This indicator is ideal for analyzing the overall market impact of Bitcoin compared to the Mag7 stocks.

BTC/USDT Volume-Based StrategyOverview
There is a distinct difference between the buying pressure exerted by individual investors and the buying pressure of institutional or "whale" traders. Monitoring volume data over a shorter period of time is crucial to distinguish these subtle differences. When whale investors or other significant market players signal price increases, volume often surges noticeably. Indeed, volume often acts as an important leading indicator in market dynamics.
Key Features
This metric, calibrated with a 5-minute Bitcoin spot chart, identifies a significant inflow of trading volume. For every K-plus surge in trading volume, those candles are shown in a green circle.
When a green circle appears, consider active long positions in subsequent declines and continue to accumulate long positions despite temporary price declines. Pay attention to the continuity of the increase in volume before locking in earnings even after the initial bullish wave.
Conversely, it may be wise to reevaluate the long position if the volume is not increasing in parallel and the price is rising. Under these conditions, starting a partial short position may be advantageous until a larger surge in volume reappears.

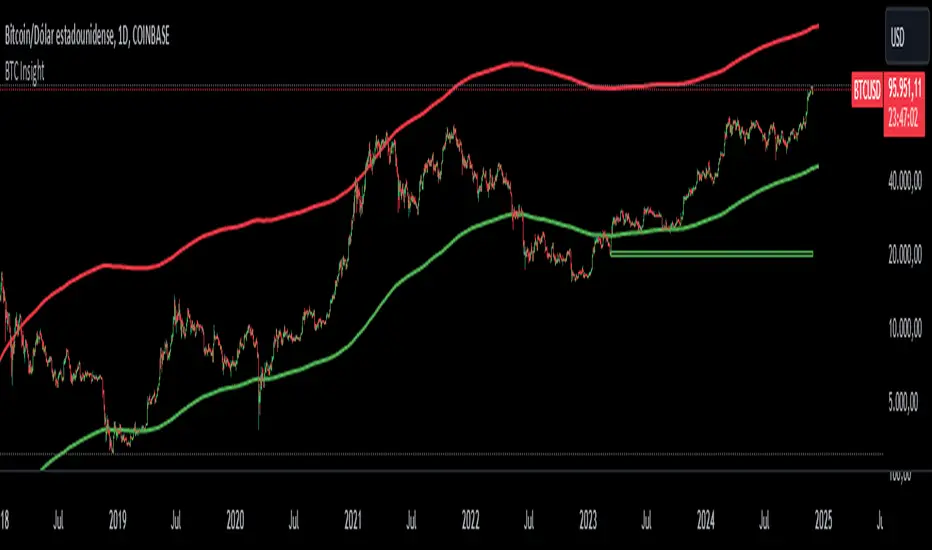
BTC InsightThis script is a comprehensive tool for analyzing Bitcoin's daily price range, trend predictions, and significant volume-based order block levels. It combines multiple technical analysis concepts, including exponential moving averages (EMAs), logarithmic calculations, and custom indicators for advanced forecasting and visualization.
Key Features and Technical Details
1. Exponential Moving Averages (EMAs)
The script calculates two smoothed EMAs:
EMA1 and EMA2 are derived from the logarithmic price of Bitcoin (log(close)).
The smoothing periods and multipliers are user-configurable through inputs:
Smoothed EMA1 Period (default: 728)
Smoothed EMA2 Period (default: 728)
Initial EMA Multipliers (default: 1.0 for EMA1, 5.0 for EMA2)
A time decay factor is applied to the multipliers to adjust sensitivity over time, making the EMAs adaptive to market dynamics.
2. Logarithmic Domain Calculations
The script uses logarithmic transformations to enhance accuracy when dealing with large price changes.
Adjustments to EMAs are made in the logarithmic domain and converted back to the price domain for plotting.
3. EMA Forecasting
The script performs a linear regression analysis over a specified period (728 bars by default) to estimate future price trends for both EMAs.
Slope Adjustments:
RSI (Relative Strength Index) is incorporated to modify the forecast slope dynamically:
RSI > 70: Bearish adjustment (-0.5)
RSI < 30: Bullish adjustment (+0.5)
Forecasts are plotted as dashed lines, projecting future values of EMA1 (green) and EMA2 (red).
4. Order Block Detection
Detects order block levels based on high volume spikes relative to the average volume over a lookback period (default: 100 bars).
A volume multiplier (default: 1.5x) is applied to identify significant volume activity.
Two types of order blocks are identified:
Below EMA1: A price zone where significant buying occurred below EMA1.
Above EMA2: A price zone where significant selling occurred above EMA2.
Order blocks are visualized as shaded rectangles:
Green boxes represent order blocks below EMA1.
Red boxes represent order blocks above EMA2.
5. Customization Inputs
The script allows fine-tuning via the following parameters:
EMA Settings: Periods, multipliers, and time factors for both EMAs.
Volume Analysis Settings: Lookback period and volume multiplier for order block detection.
Order Block Box Settings: Height of the range as a percentage of the detected price.
6. Visualization
EMAs: Two smoothed exponential moving averages are plotted with configurable offsets.
Forecast Lines: Dashed lines project future EMA trends based on regression analysis.
Order Block Boxes: Highlight areas of high volume below EMA1 and above EMA2, indicating potential support or resistance zones.
How It Works in Practice
EMAs and Trend Analysis:
The EMAs represent long-term market trends, adjusted dynamically using custom multipliers and time decay.
The script forecasts the EMAs' future trajectories to anticipate potential price movements.
Order Blocks:
High-volume zones indicate areas where significant market activity occurred, providing insights into potential price reversal points or continuation zones.
RSI Integration:
RSI-based slope adjustment fine-tunes the EMA forecast, adding an extra layer of dynamic market context.
Comprehensive View:
By combining trend forecasts with volume-based zones, the script delivers a robust analysis tool for identifying potential entry/exit points, support/resistance levels, and long-term trend predictions.
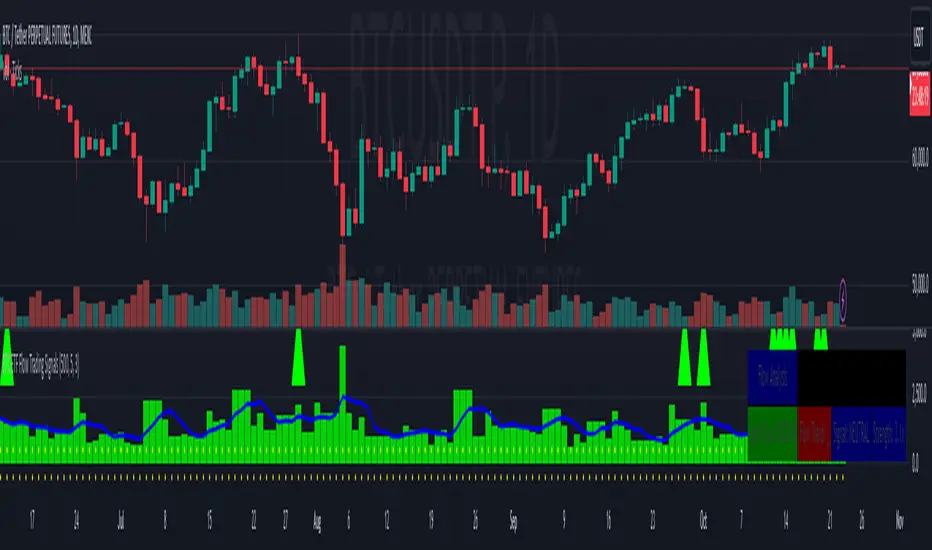
BTC ETF Flow Trading SignalsTracks large money flows (500M+) across major Bitcoin ETFs (IBIT, BTCO, FBTC, ARKB, BITB)
Generates long/short signals based on institutional money movement
Shows flow trends and strength of movements
This script provides a foundation for comparing ETF inflows and Bitcoin price. The effectiveness of the analysis depends on the quality of the data and your interpretation of the results. Key levels of 500M and 350M Inflow/Outflow Enjoy
Collaboration with Vivid Vibrations
Enjoy & improve!
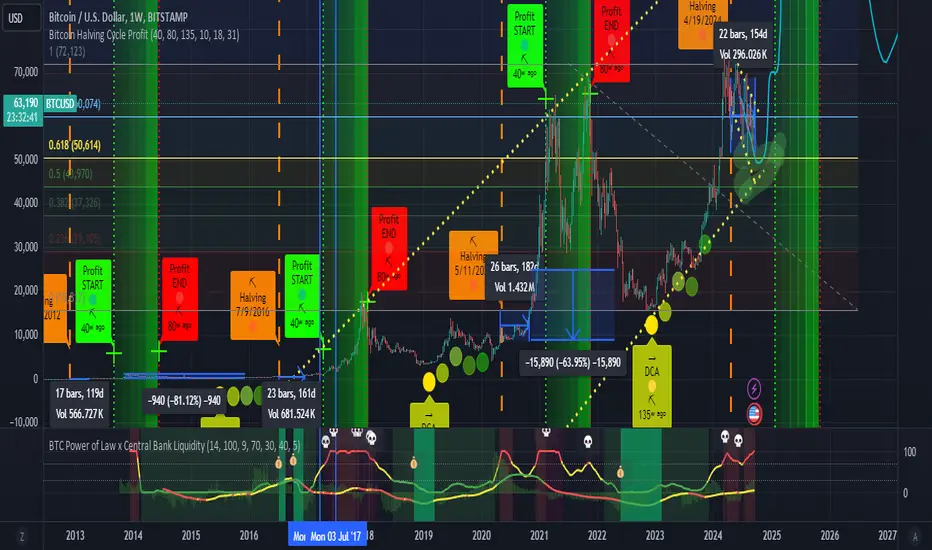
BTC Power of Law x Central Bank LiquidityThis indicator combines Bitcoin's long-term growth model (Power Law) with global central bank liquidity to help identify potential buy and sell signals.
How it works:
Power Law Oscillator: This part of the indicator tracks how far Bitcoin's current price is from its expected long-term growth, based on an exponential model. It helps you see when Bitcoin may be overbought (too expensive) or oversold (cheap) compared to its historical trend.
Central Bank Liquidity: This measures the amount of money injected into the financial system by major central banks (like the Fed or ECB). When more money is printed, asset prices, including Bitcoin, tend to rise. When liquidity dries up, prices often fall.
By combining these two factors, the indicator gives you a more accurate view of Bitcoin's price trends.
How to interpret:
Green Line : Bitcoin is undervalued compared to its long-term growth, and the liquidity environment is supportive. This is typically a buy signal.
Yellow Line: Bitcoin is trading near its expected value, or there's uncertainty due to mixed liquidity conditions. This is a hold signal.
Red Line: Bitcoin is overvalued, or liquidity is tightening. This is a potential sell signal.
Zones:
The background will turn green when Bitcoin is in a buy zone and red when it's in a sell zone, giving you easy-to-read visual cues.
BTC Top Indicator - Extension from 20 Week SMA (Normalized)This Indicator calculates the logarithmic deviation of the BTCUSD price from its 20-week SMA and dynamically normalizes it between a lower signal line (-0.57) and an upper trendline defined by two historical points (May 30, 2011, at 1.75 and March 4, 2024, at 0.45).
The indicator line color changes dynamically:
green below 0
blue at 0.5
red above 1
Ideal for analyzing BTCUSD on the Index chart to identify potential overbought or oversold levels. It's better suited for identifying tops, than bottoms.

BTC Spread Indicator"Hot potato, Bitcoin style!
In the dynamic world of cryptocurrency, keeping an eye on price movements across different exchanges can be as exhilarating as a game of hot potato. By calculating the average Bitcoin price across major exchanges, we can then dive deeper to identify the spreads between this global average and the prices on individual exchanges. This analysis reveals who's currently 'holding the potato'—or dealing with higher prices—and predicts who might be next. It's a fun, yet insightful way to visualize market volatility and trading opportunities. Let's see where the potato lands next!"

BTC Perp/Spot Price DifferenceThis is a simple script that provides you with realtime information on the actual Bitcoin price difference between the Binance Perpetual Futures and the Coinbase Spot markets.
I consider this information very useful - especially on intraday timeframes - because it immediately shows the way the retail margin traders are skewed.
Positive values mean that the margin retail daytraders are mainly long, negative values mean the opposite.
I hope this indicator will help you in your intraday Bitcoin trades.

BTC Price to Hashrate Delta Ratio with MAHistorically, Hashrate and Bitcoin prices have a strong correlation. When hashrate increases more than Bitcoin price, it indicates a rise in Bitcoin price soon.
This indicator uses the formula:
Price/hashrate delta ratio = period price delta / period hashrate delta
Whenever the ratio between the price and hashrate of Bitcoin is positive, it indicates that the price is increasing at a faster rate than the hashrate. This, in turn, means that Bitcoin is becoming more expensive compared to any variations occurring in the hashrate. Using the Price/Hashrate Delta ratio, we can determine whether Bitcoin is overvalued or undervalued in relation to the hashrate. This can be a helpful indicator for assessing the current market conditions.

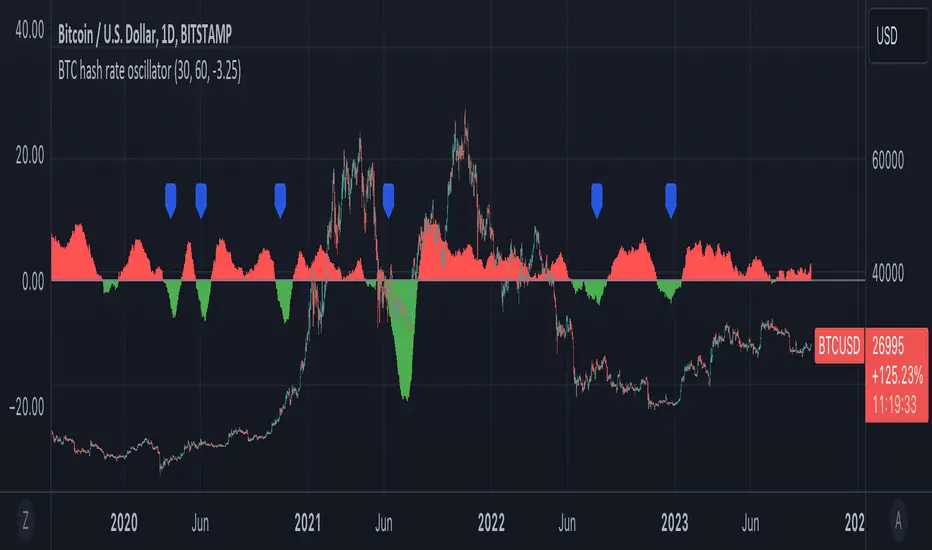
BTC hash rate oscillatorOVERVIEW:
This script looks to identify entry point opportunities when moving averages over Bitcoin's hash rate are indicative of Miner capitulation. The script implements an oscillator based on Charles Capriole's "Hash Ribbons & Bitcoin Bottoms" concept. It analyses the short-term and long-term moving averages of Bitcoin's hash rate and then identifies potential entry opportunities from this.
KEY FEATURES:
Signal Generation: The script identifies entry points when the short-term moving average crosses under the long-term moving average and the rate of change falls below a specified threshold. These conditions suggest potential trading opportunities.
Historical Signals: Optionally the script displays historical signals, indicating past instances where hash rate conditions suggested favourable entry points. Users can also assess the script's historical performance.
USAGE:
The generated opportunities can be used as potential entry points for BTC. The script provides visual cues on the chart (blue labels above the miner capitulation zones) for identification of signals. Customisable moving average lengths and threshold values are supported, which allow adaptation to various strategies.
CONSIDERATIONS:
Validation: It's recommended that careful backtesting over historical data be done before acting on any identified opportunities.
User Discretion: Trading decisions should not rely solely on this script. Users should exercise their judgment and consider market conditions.
Note: This script identifies opportunities based on historical data and should be used with caution, as past performance is not indicative of future results.