Commitment of Traders: Financial Metrics█ OVERVIEW
This indicator displays the Commitment of Traders (COT) financial data for futures markets.
█ CONCEPTS
Commitment of Traders (COT) data is tallied by the Commodity Futures Trading Commission (CFTC) , a US federal agency that oversees the trading of derivative markets such as futures in the US. It is weekly data that provides traders with information about open interest for an asset. The CFTC oversees derivative markets traded on different exchanges, so COT data is available for assets that can be traded on CBOT, CME, NYMEX, COMEX, and ICEUS.
A detailed description of the COT report can be found on the CFTC's website .
COT data is separated into three notable reports: Legacy, Disaggregated, and Financial. This indicator presents data from the COT Financial (Traders in Financial Futures) report. The Financial report includes financial contracts, such as currencies, US Treasury securities, Eurodollars, stocks, VIX and Bloomberg commodity index. As such, the TFF data is limited to financial-related tickers. The TFF report breaks down the reportable open interest positions into four classifications: Dealer/Intermediary, Asset Manager/Institutional, Leveraged Funds, and Other Reportables.
Our other COT indicators are:
• Commitment of Traders: Legacy Metrics
• Commitment of Traders: Disaggregated Metrics
• Commitment of Traders: Total
█ HOW TO USE IT
Load the indicator on an active chart (see here if you don't know how).
By default, the indicator uses the chart's symbol to derive the COT data it displays. You can also specify a CFTC code in the "CFTC code" field of the script's inputs to display COT data from a symbol different than the chart's.
The rest of this section documents the script's input fields.
Metric
Each metric represents a different column of the Commitment of Traders report. Details are available in the explanatory notes on the CFTC's website .
Here is a summary of the metrics:
• "Open Interest" is the total of all futures and/or option contracts entered into and not yet offset by a transaction, by delivery, by exercise, etc.
The aggregate of all long open interest is equal to the aggregate of all short open interest.
• "Traders Total" is the number of all unique reportable traders, regardless of the trading direction.
• "Traders Dealer" is the number of traders classified as a "Dealer/Intermediary" reported holding any position with the specified direction.
A "producer/merchant/processor/user" is an entity typically described as the “sell side” of the market.
Though they may not predominately sell futures, they do design and sell various financial assets to clients.
They tend to have matched books or offset their risk across markets and clients.
Futures contracts are part of the pricing and balancing of risk associated with the products they sell and their activities.
• "Traders Asset Manager" is the number of traders classified as "Asset Manager/Institutional" reported holding any position with the specified direction.
These are institutional investors, including pension funds, endowments, insurance companies,
mutual funds and those portfolio/investment managers whose clients are predominantly institutional.
• "Traders Leveraged Funds" is the number of traders classified as "Leveraged Funds" reported holding any position with the specified direction.
These are typically hedge funds and various types of money managers. The traders may be engaged in managing and
conducting proprietary futures trading and trading on behalf of speculative clients.
• "Traders Other Reportable" is the number of reportable traders that are not placed in any of the three categories specified above.
The traders in this category mostly are using markets to hedge business risk, whether that risk is related to foreign exchange, equities or interest rates.
This category includes corporate treasuries, central banks, smaller banks, mortgage originators, credit unions and any other reportable traders not assigned to the other three categories.
• "Traders Total Reportable" is the number of all traders reported holding any position with the specified direction.
To determine the total number of reportable traders in a market, a trader is counted only once whether or not the trader appears in more than one category.
As a result, the sum of the numbers of traders in each separate category typically exceeds the total number of reportable traders.
• "Dealer/Asset Manager/Leveraged Funds/Total Reportable/Other Reportable Positions -- all positions held by the traders of the specified category.
• "Nonreportable Positions" is the long and short open interest derived by subtracting the total long and short reportable positions from the total open interest.
Accordingly, the number of traders involved and the commercial/non-commercial classification of each trader are unknown.
• "Concentration Gross/Net LT 4/8 TDR" is the percentage of open interest held by 4/8 of the largest traders, by gross/net positions,
without regard to whether they are classified as commercial or non-commercial. The Net position ratios are computed after offsetting each trader’s equal long and short positions.
A reportable trader with relatively large, balanced long and short positions in a single market, therefore,
may be among the four and eight largest traders in both the gross long and gross short categories, but will probably not be included among the four and eight largest traders on a net basis.
Direction
Each metric is available for a particular set of directions. Valid directions for each metric are specified with its name in the "Metric" field's dropdown menu.
COT Selection Mode
This field's value determines how the script determines which COT data to return from the chart's symbol:
- "Root" uses the root of a futures symbol ("ES" for "ESH2020").
- "Base currency" uses the base currency in a forex pair ("EUR" for "EURUSD").
- "Currency" uses the quote currency, i.e., the currency the symbol is traded in ("JPY" for "TSE:9984" or "USDJPY").
- "Auto" tries all modes, in turn.
If no COT data can be found, a runtime error is generated.
Note that if the "CTFC Code" input field contains a code, it will override this input.
Futures/Options
Specifies the type of Commitment of Traders data to display: data concerning only Futures, only Options, or both.
CTFC Code
Instead of letting the script generate the CFTC COT code from the chart and the "COT Selection Mode" input when this field is empty, you can specify an unrelated CFTC COT code here, e.g., 001602 for wheat futures.
Look first. Then leap.
Recherche dans les scripts pour "CME"

Commitment of Traders: Total█ OVERVIEW
This indicator displays the Commitment of Traders (COT) totals data for futures markets.
█ CONCEPTS
Commitment of Traders (COT) data is tallied by the Commodity Futures Trading Commission (CFTC) , a US federal agency that oversees the trading of derivative markets such as futures in the US. It is weekly data that provides traders with information about open interest for an asset. The CFTC oversees derivative markets traded on different exchanges, so COT data is available for assets that can be traded on CBOT, CME, NYMEX, COMEX, and ICEUS.
A detailed description of the COT report can be found on the CFTC's website .
COT data is separated into three notable reports: Legacy, Disaggregated, and Financial. This indicator presents specific data from the COT Legacy report. The Total data details the positions held by various traders: Commercial Hedgers (traders registered with CFTC that use futures contracts in that particular commodity for hedging), Large Traders (traders registered with CFTC that do not hedge that particular commodity) and Small Traders (not registered with CFTC).
Our other COT indicators are:
• Commitment of Traders: Legacy Metrics
• Commitment of Traders: Disaggregated Metrics
• Commitment of Traders: Financial Metrics
█ HOW TO USE IT
Load the indicator on an active chart (see here if you don't know how).
By default, the indicator uses the chart's symbol to derive the COT data it displays. You can also specify a CFTC code in the "CFTC code" field of the script's inputs to display COT data from a symbol different than the chart's.
The rest of this section documents the script's input fields.
COT Selection Mode
This field's value determines how the script determines which COT data to return from the chart's symbol:
- "Root" uses the root of a futures symbol ("ES" for "ESH2020").
- "Base currency" uses the base currency in a forex pair ("EUR" for "EURUSD").
- "Currency" uses the quote currency, i.e., the currency the symbol is traded in ("JPY" for "TSE:9984" or "USDJPY").
- "Auto" tries all modes, in turn.
If no COT data can be found, a runtime error is generated.
Note that if the "CTFC Code" input field contains a code, it will override this input.
Futures/Options
Specifies the type of Commitment of Traders data to display: data concerning only Futures, only Options, or both.
Display
Determines the direction of the metrics requested from the CTFC report.
CTFC Code
Instead of letting the script generate the CFTC COT code from the chart and the "COT Selection Mode" input when this field is empty, you can specify an unrelated CFTC COT code here, e.g., 001602 for wheat futures.
Look first. Then leap.

LibraryCOT█ OVERVIEW
This library is a Pine programmer's tool that provides functions to access Commitment of Traders (COT) data for futures. Four of our scripts use it:
• Commitment of Traders: Legacy Metrics
• Commitment of Traders: Disaggregated Metrics
• Commitment of Traders: Financial Metrics
• Commitment of Traders: Total
If you do not program in Pine and want to use COT data, please see the indicators linked above.
█ CONCEPTS
Commitment of Traders (COT) data is tallied by the Commodity Futures Trading Commission (CFTC) , a US federal agency that oversees the trading of derivative markets such as futures in the US. It is weekly data that provides traders with information about open interest for an asset. The CFTC oversees derivative markets traded on different exchanges, so COT data is available for assets that can be traded on CBOT, CME, NYMEX, COMEX, and ICEUS.
Accessing COT data from a Pine script requires the generation of a ticker ID string for use with request.security() . The ticker string must be encoded in a special format that includes both CFTC and TradingView-specific content. The format of the ticker IDs is somewhat complex; this library's functions make their generation easier. Note that if you know the COT ticker ID string for specific data, you can enter it from the chart's "Symbol Search" dialog box.
A ticker for COT data in Pine has the following structure:
COT:__<_metricDirection><_metricType>
where an underscore prefixing a component name inside <> is only included if the component is not a null string, and:
Is a digit representing the type of the COT report the data comes from: "" for legacy COT data, "2" for disaggregated data and "3" for financial data.
Is a six digit code that represents a commodity. Example: wheat futures (root "ZW") have the code "001602".
Is either "F" if the report data should exclude Options data, or "FO" if such data is included.
Is the TradingView code of the metric. This library's `metricNameAndDirectionToTicker()` function creates both
the and components of a COT ticker from the metric names and directions listed in the above chart.
The different metrics are explained in the CFTC's Explanatory Notes .
Is the direction of the metric: "Long", "Short", "Spreading" or "No direction".
Not all directions are applicable to all metrics. The valid ones are listed next to each metric in the above chart.
Is the type of the metric, possible values are "All", "Old" and "Other".
The difference between the types is explained in the "Old and Other Futures" section of the CFTC's Explanatory Notes .
As an example, the Legacy report Open Interest data for ZW futures (options included) in the old standard has the ticker "COT:001602_FO_OI_OLD". The same data using the current standard without futures has the ticker "COT:001602_F_OI".
█ USING THE LIBRARY
The first functions in the library are helper functions that generate components of a COT ticker ID. The last function, `COTTickerid()`, is the one that generates the full ticker ID string by calling some of the helper functions. We use it like this in our example:
exampleTicker = COTTickerid(
COTType = "Legacy",
CFTCCode = convertRootToCOTCode("Auto"),
includeOptions = false,
metricName = "Open Interest",
metricDirection = "No direction",
metricType = "All")
This library's chart displays the valid values for the `metricName` and `metricDirection` arguments. They vary for each of the three types of COT data (the `COTType` argument). The chart also displays the COT ticker ID string in the `exampleTicker` variable.
Look first. Then leap.
The library's functions are:
rootToCFTCCode(root)
Accepts a futures root and returns the relevant CFTC code.
Parameters:
root : Root prefix of the future's symbol, e.g. "ZC" for "ZC1!"" or "ZCU2021".
Returns: The part of a COT ticker corresponding to `root`, or "" if no CFTC code exists for the `root`.
currencyToCFTCCode(curr)
Converts a currency string to its corresponding CFTC code.
Parameters:
curr : Currency code, e.g., "USD" for US Dollar.
Returns: The corresponding to the currency, if one exists.
optionsToTicker(includeOptions)
Returns the part of a COT ticker using the `includeOptions` value supplied, which determines whether options data is to be included.
Parameters:
includeOptions : A "bool" value: 'true' if the symbol should include options and 'false' otherwise.
Returns: The part of a COT ticker: "FO" for data that includes options and "F" for data that doesn't.
metricNameAndDirectionToTicker(metricName, metricDirection)
Returns a string corresponding to a metric name and direction, which is one component required to build a valid COT ticker ID.
Parameters:
metricName : One of the metric names listed in this library's chart. Invalid values will cause a runtime error.
metricDirection : Metric direction. Possible values are: "Long", "Short", "Spreading", and "No direction".
Valid values vary with metrics. Invalid values will cause a runtime error.
Returns: The part of a COT ticker ID string, e.g., "OI_OLD" for "Open Interest" and "No direction",
or "TC_L" for "Traders Commercial" and "Long".
typeToTicker(metricType)
Converts a metric type into one component required to build a valid COT ticker ID.
See the "Old and Other Futures" section of the CFTC's Explanatory Notes for details on types.
Parameters:
metricType : Metric type. Accepted values are: "All", "Old", "Other".
Returns: The part of a COT ticker.
convertRootToCOTCode(mode, convertToCOT)
Depending on the `mode`, returns a CFTC code using the chart's symbol or its currency information when `convertToCOT = true`.
Otherwise, returns the symbol's root or currency information. If no COT data exists, a runtime error is generated.
Parameters:
mode : A string determining how the function will work. Valid values are:
"Root": the function extracts the futures symbol root (e.g. "ES" in "ESH2020") and looks for its CFTC code.
"Base currency": the function extracts the first currency in a pair (e.g. "EUR" in "EURUSD") and looks for its CFTC code.
"Currency": the function extracts the quote currency ("JPY" for "TSE:9984" or "USDJPY") and looks for its CFTC code.
"Auto": the function tries the first three modes (Root -> Base Currency -> Currency) until a match is found.
convertToCOT : "bool" value that, when `true`, causes the function to return a CFTC code.
Otherwise, the root or currency information is returned. Optional. The default is `true`.
Returns: If `convertToCOT` is `true`, the part of a COT ticker ID string.
If `convertToCOT` is `false`, the root or currency extracted from the current symbol.
COTTickerid(COTType, CTFCCode, includeOptions, metricName, metricDirection, metricType)
Returns a valid TradingView ticker for the COT symbol with specified parameters.
Parameters:
COTType : A string with the type of the report requested with the ticker, one of the following: "Legacy", "Disaggregated", "Financial".
CTFCCode : The for the asset, e.g., wheat futures (root "ZW") have the code "001602".
includeOptions : A boolean value. 'true' if the symbol should include options and 'false' otherwise.
metricName : One of the metric names listed in this library's chart.
metricDirection : Direction of the metric, one of the following: "Long", "Short", "Spreading", "No direction".
metricType : Type of the metric. Possible values: "All", "Old", and "Other".
Returns: A ticker ID string usable with `request.security()` to fetch the specified Commitment of Traders data.
█ AVAILABLE METRICS
Different COT types provide different metrics. The table of all metrics available for each of the types can be found below.
+------------------------------+------------------------+
| Legacy (COT) Metric Names | Directions |
+------------------------------+------------------------+
| Open Interest | No direction |
| Noncommercial Positions | Long, Short, Spreading |
| Commercial Positions | Long, Short |
| Total Reportable Positions | Long, Short |
| Nonreportable Positions | Long, Short |
| Traders Total | No direction |
| Traders Noncommercial | Long, Short, Spreading |
| Traders Commercial | Long, Short |
| Traders Total Reportable | Long, Short |
| Concentration Gross LT 4 TDR | Long, Short |
| Concentration Gross LT 8 TDR | Long, Short |
| Concentration Net LT 4 TDR | Long, Short |
| Concentration Net LT 8 TDR | Long, Short |
+------------------------------+------------------------+
+-----------------------------------+------------------------+
| Disaggregated (COT2) Metric Names | Directions |
+-----------------------------------+------------------------+
| Open Interest | No Direction |
| Producer Merchant Positions | Long, Short |
| Swap Positions | Long, Short, Spreading |
| Managed Money Positions | Long, Short, Spreading |
| Other Reportable Positions | Long, Short, Spreading |
| Total Reportable Positions | Long, Short |
| Nonreportable Positions | Long, Short |
| Traders Total | No Direction |
| Traders Producer Merchant | Long, Short |
| Traders Swap | Long, Short, Spreading |
| Traders Managed Money | Long, Short, Spreading |
| Traders Other Reportable | Long, Short, Spreading |
| Traders Total Reportable | Long, Short |
| Concentration Gross LE 4 TDR | Long, Short |
| Concentration Gross LE 8 TDR | Long, Short |
| Concentration Net LE 4 TDR | Long, Short |
| Concentration Net LE 8 TDR | Long, Short |
+-----------------------------------+------------------------+
+-------------------------------+------------------------+
| Financial (COT3) Metric Names | Directions |
+-------------------------------+------------------------+
| Open Interest | No Direction |
| Dealer Positions | Long, Short, Spreading |
| Asset Manager Positions | Long, Short, Spreading |
| Leveraged Funds Positions | Long, Short, Spreading |
| Other Reportable Positions | Long, Short, Spreading |
| Total Reportable Positions | Long, Short |
| Nonreportable Positions | Long, Short |
| Traders Total | No Direction |
| Traders Dealer | Long, Short, Spreading |
| Traders Asset Manager | Long, Short, Spreading |
| Traders Leveraged Funds | Long, Short, Spreading |
| Traders Other Reportable | Long, Short, Spreading |
| Traders Total Reportable | Long, Short |
| Concentration Gross LE 4 TDR | Long, Short |
| Concentration Gross LE 8 TDR | Long, Short |
| Concentration Net LE 4 TDR | Long, Short |
| Concentration Net LE 8 TDR | Long, Short |
+-------------------------------+------------------------+

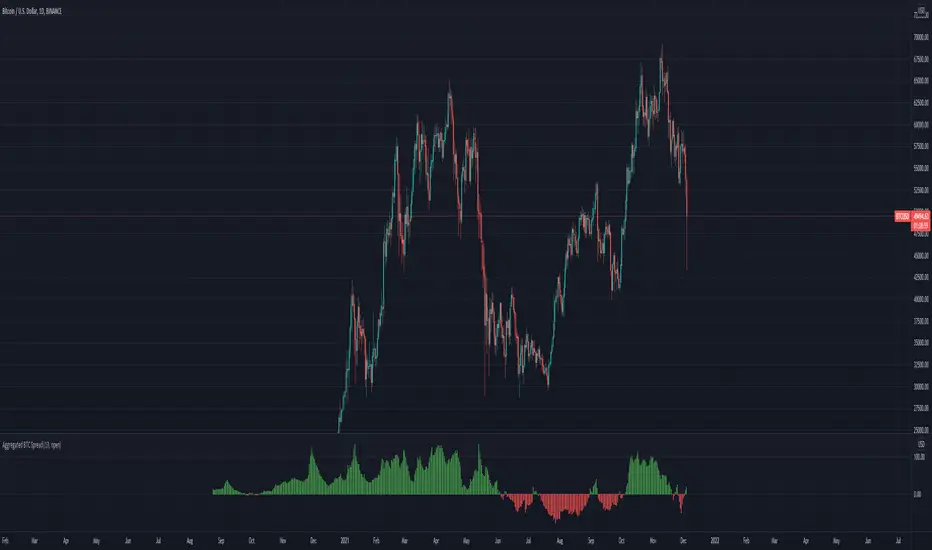
Aggregated BTC SpreadThis script is used to aggregate the bitcoin spread on futures contracts on different platforms.
It works by averaging the for every selected exchange, and apply an EMA of .
It is supporting
Binance (USD / USDT)
Okex
FTX
Huobi
Deribit
Ascendex
CME (BTC1!)
Relative Volume (rVol), Better Volume, Average Volume ComparisonThis is the best version of relative volume you can find a claim which is based on the logical soundness of its calculation.
I have amalgamated various volume analysis into one synergistic script. I wasn't going to opensource it. But, as one of the lucky few winners of TradingClue 2. I felt obligated to give something back to the community.
Relative volume traditionally compares current volume to prior bar volume or SMA of volume. This has drawbacks. The question of relative volume is "Volume relative to what?" In the traditional scripts you'll find it displays current volume relative to the last number of bars. But, is that the best way to compare volume. On a daily chart, possibly. On a daily chart this can work because your units of time are uniform. Each day represents a full cycle of volume. However, on an intraday chart? Not so much.
Example: If you have a lookback of 9 on an hourly chart in a 24 hour market, you are then comparing the average volume from Midnight - 9 AM to the 9 AM volume. What do you think you'll find? Well at 9:30 when NY exchanges open the volume should be consistently and predictably higher. But though rVol is high relative to the lookback period, its actually just average or maybe even below average compared to prior NY session opens. But prior NY session opens are not included in the lookback and thus ignored.
This problem is the most visibly noticed when looking at the volume on a CME futures chart or some equivalent. In a 24 hour market, such as crypto, there are website's like skew can show you the volume disparity from time of day. This led me to believe that the traditional rVol calculation was insufficient. A better way to calculate it would be to compare the 9:30 am 30m bar today to the last week's worth of 9:30 am 30m bars. Then I could know whether today's volume at 9:30 am today is high or low based on prior 9:30 am bars. This seems to be a superior method on an intraday basis and is clearly superior in markets with irregular volume
This led me to other problems, such as markets that are open for less than 24 hours and holiday hours on traditional market exchanges. How can I know that the script is accurately looking at the correct prior relevant bars. I've created and/or adapted solutions to all those problems and these calculations and code snippets thus have value that extend beyond this rVol script for other pinecoders.
The Script
This rVol script looks back at the bars of the same time period on the viewing timeframe. So, as we said, the last 9:30 bars. Averages those, then divides the: . The result is a percentage expressed as x.xxx. Thus 1.0 mean current volume is equal to average volume. Below 1.0 is below the average and above 1.0 is above the average.
This information can be viewed on its own. But there are more levels of analysis added to it.
Above the bars are signals that correlate to the "Better Volume Indicator" developed by, I believe, the folks at emini-watch and originally adapted to pinescript by LazyBear. The interpretation of these symbols are in a table on the right of the indicator.
The volume bars can also be colored. The color is defined by the relationship between the average of the rVol outputs and the current volume. The "Average rVol" so to speak. The color coding is also defined by a legend in the table on the right.
These can be researched by you to determine how to best interpret these signals. I originally got these ideas and solid details on how to use the analysis from a fellow out there, PlanTheTrade.
I hope you find some value in the code and in the information that the indicator presents. And I'd like to thank the TradingView team for producing the most innovative and user friendly charting package on the market.
(p.s. Better Volume is provides better information with a longer lookback value than the default imo)
Credit for certain code sections and ideas is due to:
LazyBear - Better Volume
Grimmolf (From GitHub) - Logic for Loop rVol
R4Rocket - The idea for my rVol 1 calculation
And I can't find the guy who had the idea for the multiples of volume to the average. Tag him if you know him
Final Note: I'd like to leave a couple of clues of my own for fellow seekers of trading infamy.
Indicators: indicators are like anemometers (The things that measure windspeed). People talk bad about them all the time because they're "lagging." Well, you can't tell what the windspeed is unless the wind is blowing. anemometers are lagging indicators of wind. But forecasters still rely on them. You would use an indicator, which I would define as a instrument of measure, to tell you the windspeed of the markets. Conversely, when people talk positively about indicators they say "This one is great and this one is terrible." This is like a farmer saying "Shovels are great, but rakes are horrible." There are certain tools that have certain functions and every good tool has a purpose for a specific job. So the next time someone shares their opinion with you about indicators. Just smile and nod, realizing one day they'll learn... hopefully before they go broke.
How to forecast: Prediction is accomplished by analyzing the behavior of instruments of measure to aggregate data (using your anemometer). The data is then assembled into a predictive model based on the measurements observed (a trading system). That predictive model is tested against reality for it's veracity (backtesting). If the model is predictive, you can optimize your decision making by creating parameter sets around the prediction that are synergistic with the implications of the prediction (risk, stop loss, target, scaling, pyramiding etc).
<3

Single Prints - Session Initial BalancesDisclaimer: Expose yourself to the knowledge of different trading methods. If you are unaware of what a Single Print is then do some research and broaden your knowledge.
This indicator has only been tested on BTCUSDT Binance pair. This indicator is meant to be used on the 30 minute timeframe to highlight Single Prints.
The calculations are base on 0000 UTC and what Single Prints are created during that day.
Single Prints
Single Prints are where prices moves to fast through an area (on a 30 minute timeframe), in the case of this indicator in $50 intervals, where the price has not yet cross back past, represented as orange lines. If you were viewing this on a Time Price Opportunity Chart (TPO) each $50 would be represented as a square with a letter in it. If price has only been through that area once, within that 24 hour period, then it is called a Single Print. If however the Single Print is on the lower wick of the candle it is called a Buying Tail and on the Upper Wick a Selling Tail.
Single Prints leave low volume nodes with liquidity gaps, these inefficient moves tend to get filled, and we can seek trading opportunities once they get filled, or we can also enter before they get filled and use these single prints as targets.
Single Prints are a sign of emotional buying or selling as very little time was spent at those levels and thus there is no value there.
The endpoints of single print sections are considered to be potential support or resistance points and or get filled (like a CME gap).
The above is only a very short summary, to understand Single Prints, Buying Tails and Selling Tails more please do your own research (DYOR).
References:
Trading Riot Volume Profile - Website
TOROS TPO Charts Explained - Youtube
Session Boxes
Session Boxes are the high and low of that markets session before the new market session opens. I used the data from the website Trading Hours for the time input.
White box – Start of day UTC 0000 to Market Close UTC 2000
Purple box – Asia Start UTC 0130 to London Start UTC 0700
Yellow box – London Start UTC 0700 to New York Start UTC 1330
Blue box – New York Start UTC 1330 to Market Close UTC 2000
Red box – Market Close UTC 2000 to End of day UTC 2359
References:
Trading Hours - Website
Initial Balance
The Initial Balance is the market range between the high and low of the first hour of trading for the market. In the case of crypto when is the Initial Balance if it is 24/7.
Context of Initial Balance:
The Initial Balance is traditionally the range of prices transacted in the first hour of trade. Many regard the Initial Balance as a significant range because, especially for the index futures which are tied to the underlying stocks, orders entered overnight or before the open are typically executed prior to the end of the first hour of trade. Some use it to understand how the rest of the day may develop, while others use it as a span of time to avoid trading altogether because of its potential volatility.
For this indicator I have coded the Initial Balance time as below:
White Box - To appear for the first hour of the day 0000 to 0100 UTC .
Purple Box - To appear for the first hour of the day 0130 to 0230 UTC .
Yellow Box - To appear for the first hour of the day 0700 to 0800 UTC .
Blue Box - To appear for the first hour of the day 1330 to 1430 UTC .
Red Box - To appear for the first hour of the day 2000 to 2100 UTC .
The diagram above shows some examples:
How price (white arrows) retraces the single prints.
How price (red arrows) uses the single prints as S/R.
References:
Not Hard Trading – Website
My Pivots Initial Balance - Website
Thanks go to:
StackOverFlow Bjorn Mistiaen
Trading View user mvs1231
Please message me if you have any feedback/questions.
I am looking at developing this indicator further in the future.

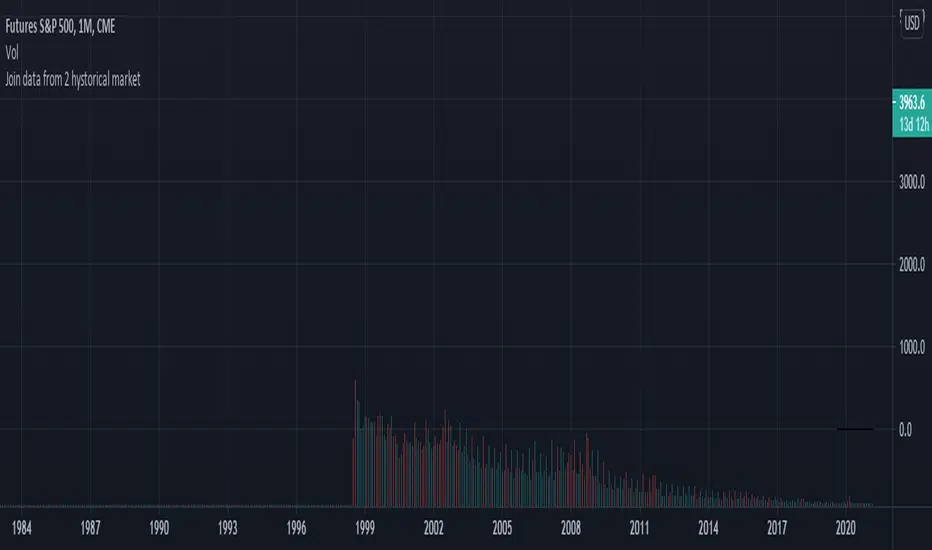
Join data and union of 2 hystorical markets
How to create a union from two contiguous Tradingview tickers (series)
Francesco Marzolo March 18, 2021
Go to the older ticker of the two, for example CME: SP1! and open it on Tradingview.
On the graph thus created, add this script.
In the indicator settings select the same ticker as the chart in Symbol1
while in Symbol2 the ticker from which to retrieve the most recent data, for example: SPX500
The operation this script does is examine each bar of the two tickers, where there is a value for the second it holds this one, where it does not exist in second ticker it keeps the value of the first one. This new series is called Merge. So now in the chart there will be 4 series:
- that of the original chart without script
- the same series loaded via script (Symbol1)
- series 2 of "new" data (Symbol2)
- the Merge series that "prefers" the Symbol2 data if present, otherwise it shows Symbol1
So now you have to change the visibility of the 4 series to see the differences:
- turn off the visibility of the chart indicator
- turn off the Symbol1 series in the script properties (old data only)
- switch off the Symbol2 series as well (only new data)
- switch on the Merge series (new data if existing, old if not present in the new ticker)
Waindrops [Makit0]█ OVERALL
Plot waindrops (custom volume profiles) on user defined periods, for each period you get high and low, it slices each period in half to get independent vwap, volume profile and the volume traded per price at each half.
It works on intraday charts only, up to 720m (12H). It can plot balanced or unbalanced waindrops, and volume profiles up to 24H sessions.
As example you can setup unbalanced periods to get independent volume profiles for the overnight and cash sessions on the futures market, or 24H periods to get the full session volume profile of EURUSD
The purpose of this indicator is twofold:
1 — from a Chartist point of view, to have an indicator which displays the volume in a more readable way
2 — from a Pine Coder point of view, to have an example of use for two very powerful tools on Pine Script:
• the recently updated drawing limit to 500 (from 50)
• the recently ability to use drawings arrays (lines and labels)
If you are new to Pine Script and you are learning how to code, I hope you read all the code and comments on this indicator, all is designed for you,
the variables and functions names, the sometimes too big explanations, the overall structure of the code, all is intended as an example on how to code
in Pine Script a specific indicator from a very good specification in form of white paper
If you wanna learn Pine Script form scratch just start HERE
In case you have any kind of problem with Pine Script please use some of the awesome resources at our disposal: USRMAN , REFMAN , AWESOMENESS , MAGIC
█ FEATURES
Waindrops are a different way of seeing the volume and price plotted in a chart, its a volume profile indicator where you can see the volume of each price level
plotted as a vertical histogram for each half of a custom period. By default the period is 60 so it plots an independent volume profile each 30m
You can think of each waindrop as an user defined candlestick or bar with four key values:
• high of the period
• low of the period
• left vwap (volume weighted average price of the first half period)
• right vwap (volume weighted average price of the second half period)
The waindrop can have 3 different colors (configurable by the user):
• GREEN: when the right vwap is higher than the left vwap (bullish sentiment )
• RED: when the right vwap is lower than the left vwap (bearish sentiment )
• BLUE: when the right vwap is equal than the left vwap ( neutral sentiment )
KEY FEATURES
• Help menu
• Custom periods
• Central bars
• Left/Right VWAPs
• Custom central bars and vwaps: color and pixels
• Highly configurable volume histogram: execution window, ticks, pixels, color, update frequency and fine tuning the neutral meaning
• Volume labels with custom size and color
• Tracking price dot to be able to see the current price when you hide your default candlesticks or bars
█ SETTINGS
Click here or set any impar period to see the HELP INFO : show the HELP INFO, if it is activated the indicator will not plot
PERIOD SIZE (max 2880 min) : waindrop size in minutes, default 60, max 2880 to allow the first half of a 48H period as a full session volume profile
BARS : show the central and vwap bars, default true
Central bars : show the central bars, default true
VWAP bars : show the left and right vwap bars, default true
Bars pixels : width of the bars in pixels, default 2
Bars color mode : bars color behavior
• BARS : gets the color from the 'Bars color' option on the settings panel
• HISTOGRAM : gets the color from the Bearish/Bullish/Neutral Histogram color options from the settings panel
Bars color : color for the central and vwap bars, default white
HISTOGRAM show the volume histogram, default true
Execution window (x24H) : last 24H periods where the volume funcionality will be plotted, default 5
Ticks per bar (max 50) : width in ticks of each histogram bar, default 2
Updates per period : number of times the histogram will update
• ONE : update at the last bar of the period
• TWO : update at the last bar of each half period
• FOUR : slice the period in 4 quarters and updates at the last bar of each of them
• EACH BAR : updates at the close of each bar
Pixels per bar : width in pixels of each histogram bar, default 4
Neutral Treshold (ticks) : delta in ticks between left and right vwaps to identify a waindrop as neutral, default 0
Bearish Histogram color : histogram color when right vwap is lower than left vwap, default red
Bullish Histogram color : histogram color when right vwap is higher than left vwap, default green
Neutral Histogram color : histogram color when the delta between right and left vwaps is equal or lower than the Neutral treshold, default blue
VOLUME LABELS : show volume labels
Volume labels color : color for the volume labels, default white
Volume Labels size : text size for the volume labels, choose between AUTO, TINY, SMALL, NORMAL or LARGE, default TINY
TRACK PRICE : show a yellow ball tracking the last price, default true
█ LIMITS
This indicator only works on intraday charts (minutes only) up to 12H (720m), the lower chart timeframe you can use is 1m
This indicator needs price, time and volume to work, it will not work on an index (there is no volume), the execution will not be allowed
The histogram (volume profile) can be plotted on 24H sessions as limit but you can plot several 24H sessions
█ ERRORS AND PERFORMANCE
Depending on the choosed settings, the script performance will be highly affected and it will experience errors
Two of the more common errors it can throw are:
• Calculation takes too long to execute
• Loop takes too long
The indicator performance is highly related to the underlying volatility (tick wise), the script takes each candlestick or bar and for each tick in it stores the price and volume, if the ticker in your chart has thousands and thousands of ticks per bar the indicator will throw an error for sure, it can not calculate in time such amount of ticks.
What all of that means? Simply put, this will throw error on the BITCOIN pair BTCUSD (high volatility with tick size 0.01) because it has too many ticks per bar, but lucky you it will work just fine on the futures contract BTC1! (tick size 5) because it has a lot less ticks per bar
There are some options you can fine tune to boost the script performance, the more demanding option in terms of resources consumption is Updates per period , by default is maxed out so lowering this setting will improve the performance in a high way.
If you wanna know more about how to improve the script performance, read the HELP INFO accessible from the settings panel
█ HOW-TO SETUP
The basic parameters to adjust are Period size , Ticks per bar and Pixels per bar
• Period size is the main setting, defines the waindrop size, to get a better looking histogram set bigger period and smaller chart timeframe
• Ticks per bar is the tricky one, adjust it differently for each underlying (ticker) volatility wise, for some you will need a low value, for others a high one.
To get a more accurate histogram set it as lower as you can (min value is 1)
• Pixels per bar allows you to adjust the width of each histogram bar, with it you can adjust the blank space between them or allow overlaping
You must play with these three parameters until you obtain the desired histogram: smoother, sharper, etc...
These are some of the different kind of charts you can setup thru the settings:
• Balanced Waindrops (default): charts with waindrops where the two halfs are of same size.
This is the default chart, just select a period (30m, 60m, 120m, 240m, pick your poison), adjust the histogram ticks and pixels and watch
• Unbalanced Waindrops: chart with waindrops where the two halfs are of different sizes.
Do you trade futures and want to plot a waindrop with the first half for the overnight session and the second half for the cash session? you got it;
just adjust the period to 1860 for any CME ticker (like ES1! for example) adjust the histogram ticks and pixels and watch
• Full Session Volume Profile: chart with waindrops where only the first half plots.
Do you use Volume profile to analize the market? Lucky you, now you can trick this one to plot it, just try a period of 780 on SPY, 2760 on ES1!, or 2880 on EURUSD
remember to adjust the histogram ticks and pixels for each underlying
• Only Bars: charts with only central and vwap bars plotted, simply deactivate the histogram and volume labels
• Only Histogram: charts with only the histogram plotted (volume profile charts), simply deactivate the bars and volume labels
• Only Volume: charts with only the raw volume numbers plotted, simply deactivate the bars and histogram
If you wanna know more about custom full session periods for different asset classes, read the HELP INFO accessible from the settings panel
EXAMPLES
Full Session Volume Profile on MES 5m chart:
Full Session Unbalanced Waindrop on MNQ 2m chart (left side Overnight session, right side Cash Session):
The following examples will have the exact same charts but on four different tickers representing a futures contract, a forex pair, an etf and a stock.
We are doing this to be able to see the different parameters we need for plotting the same kind of chart on different assets
The chart composition is as follows:
• Left side: Volume Labels chart (period 10)
• Upper Right side: Waindrops (period 60)
• Lower Right side: Full Session Volume Profile
The first example will specify the main parameters, the rest of the charts will have only the differences
MES :
• Left: Period size: 10, Bars: uncheck, Histogram: uncheck, Execution window: 1, Ticks per bar: 2, Updates per period: EACH BAR,
Pixels per bar: 4, Volume labels: check, Track price: check
• Upper Right: Period size: 60, Bars: check, Bars color mode: HISTOGRAM, Histogram: check, Execution window: 2, Ticks per bar: 2,
Updates per period: EACH BAR, Pixels per bar: 4, Volume labels: uncheck, Track price: check
• Lower Right: Period size: 2760, Bars: uncheck, Histogram: check, Execution window: 1, Ticks per bar: 1, Updates per period: EACH BAR,
Pixels per bar: 2, Volume labels: uncheck, Track price: check
EURUSD :
• Upper Right: Ticks per bar: 10
• Lower Right: Period size: 2880, Ticks per bar: 1, Pixels per bar: 1
SPY :
• Left: Ticks per bar: 3
• Upper Right: Ticks per bar: 5, Pixels per bar: 3
• Lower Right: Period size: 780, Ticks per bar: 2, Pixels per bar: 2
AAPL :
• Left: Ticks per bar: 2
• Upper Right: Ticks per bar: 6, Pixels per bar: 3
• Lower Right: Period size: 780, Ticks per bar: 1, Pixels per bar: 2
█ THANKS TO
PineCoders for all they do, all the tools and help they provide and their involvement in making a better community
scarf for the idea of coding a waindrops like indicator, I did not know something like that existed at all
All the Pine Coders, Pine Pros and Pine Wizards, people who share their work and knowledge for the sake of it and helping others, I'm very grateful indeed
I'm learning at each step of the way from you all, thanks for this awesome community;
Opensource and shared knowledge: this is the way! (said with canned voice from inside my helmet :D)
█ NOTE
This description was formatted following THIS guidelines
═════════════════════════════════════════════════════════════════════════
I sincerely hope you enjoy reading and using this work as much as I enjoyed developing it :D
GOOD LUCK AND HAPPY TRADING!

ABUs EurorampThis strategy backtests the opening ramp of Europe at 9am European time, which is 2am Chicago time ( CME ES timezone ) on the ES Futures Contract.
The following conditions are embedded in the strategy:
- Market entry at 2 am Chicago time
- Size = 2 contracts
- Stop = -5 points
- TP 1 = +3 points (1 Contract)
- Stop to Break even (entry + 0.5) after TP 1 is reached
- Set a TP 2 stop to +5 if entry is +10 points
- Close all positions EOD RTH
As the script entry / stops / TPs work on candle closes, best is to use the strategy on the 5min chart.

Overnight Bollinger Band ExtremesThis script is a combination of my overnight fakeout script and bollinger band color bars. It's designed to be used on CME/CBOT Equity Indexes during their GLOBEX session. It uses the built in Bollinger Band script and highlights bars that exceed the upper/lower bands during the overnight session.

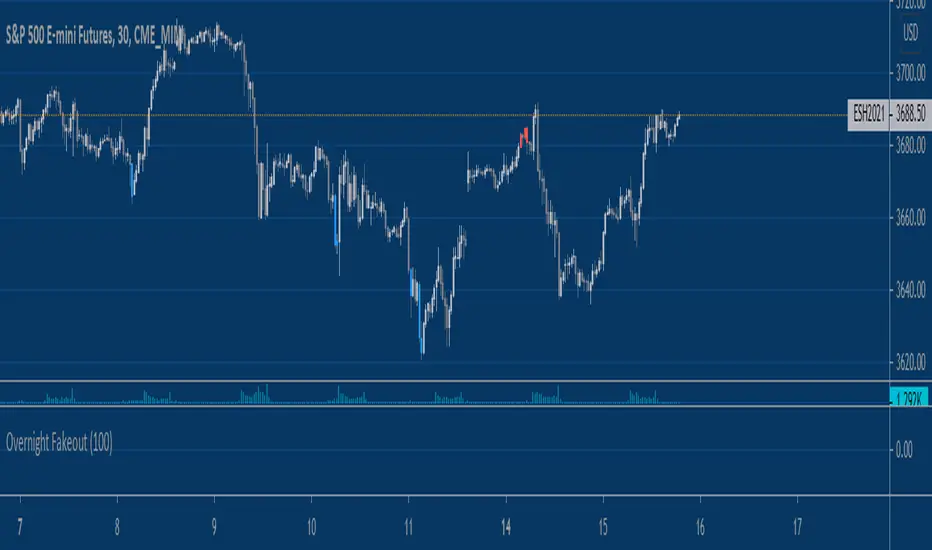
Equity Index Overnight FakeoutThis script highlights when price violates the highest high or lowest low within the user's selected lookback period, with the caveat that it occurs during the GLOBEX session. The script is designed to work exclusively with the trading hours for CME and CBOT Equity Index futures. I'm planning to make a more customizable version down the line.
My reasoning behind this very simple script is that the low liquidity and participation of the overnight session creates a tendency for moves at extremes to mean revert. Let me know what you think.
KZ SessionsThis shows killzone sessions for London NY, Asia sessions.
In addition to the opening hours of session, the pre-market and closing time periods are also marked with a grey color
Generally these are consided period of high activity and can experience more volatility in these periods
I also have enabled it to display the session times even on weekends. There is no session open at such times but heightened activity is noticed in these periods even on weekends.
If want to disable showing it on weekends, then remove ":1234567" from all the lines in code

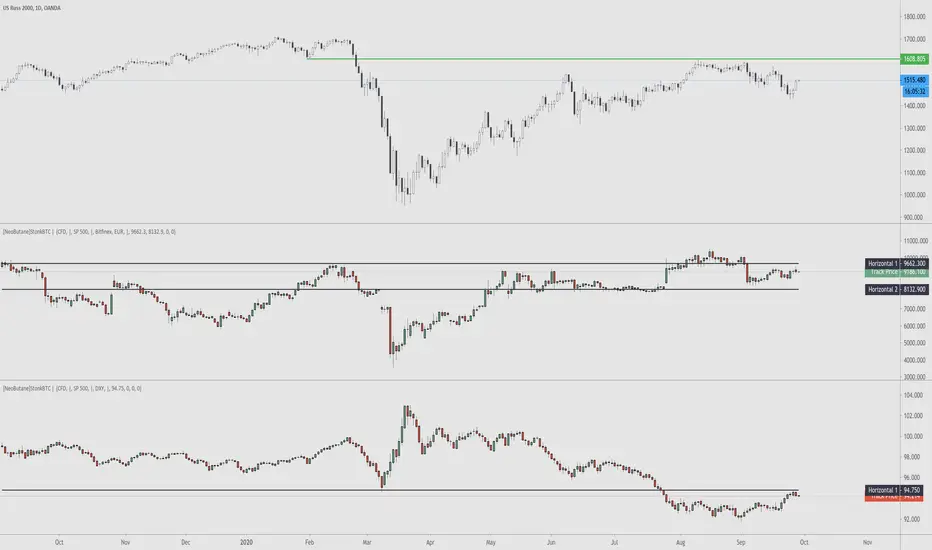
StonkBTC - autoswitch secondary series for scalpersSince the drop in March of 2020, the U.S. ETF , SPY, has been correlated with bitcoin's moves, especially during the NY session.
This tool is meant to help traders who want to take advantage of that without having to switch the secondary series between BTCUSD and (generally) SPY when changing the ticker they are viewing.
How this works:
The indicator will automatically switch between bitcoin or equity index depending on what ticker your current chart is. Ideally this tool would be very simple to use.
Options:
Show/hide a 'track price' line
Index choice of SP500, Nasdaq 100, and Russell 2000. Further selection by ETF, futures, and CFD
Varied bitcoin price sources
Notes:
You will need a separate subscription to TradingView to view realtime CME futures data (if not, it will be delayed by 10 minutes). Because of this, the default option chosen is the CFD for the most complete chart when viewing bitcoin.
NY Core Trading Session: 9:30 a.m. to 4:00 p.m. ET
www.nyse.com
Arbitrage DOL BR / DOL USAThis indicator is made to calculate and show the spread between the currency pair USD-BRL being negotiatied in Brasil's B3 and in USA's CME Globex.
The orange line "Arbitrage" is the spread.
The red/green line is the "Stop Loss" recommended for the strategy. If the line is green, it means that the reward/tisk ratio is above 1.
IMPORTANT: MAKE SURE TO BE USING THE SAME TIMEFRAME ON BOTH THE INDICATOR AND THE CHART.

[FN] Session Range & Date Range For BacktestingThis has been done before in different ways, however, my goal is to publish a single, simplified copy/paste version of the idea so you can quickly and easily incorporate it into your strategy backtesting.
You can designate weekdays, weekdays + weekends for 24/7 markets, and also session range.
So, you trade bitcoin? It works. CME futures? It works. You are a discretionary trader so the only signals that matter are the ones that happen when you're awake? It works. Copy and paste.
The goal is that its that easy. You'll have to let me know if it is. glhf everyone.
If I'm not mistaken, you should be able to copy/paste this directly into your strategy script (Paste it in before your entry declarations). Just leave out the last 2 lines where the bgcolor() is declared... unless you want the background color lit up, that's up to you. It's just for demonstration purposes in this script.
After you've pasted it in, then in your strategy.entry() function you are adding: to the strategy.entry() function.
e.g:
strategy.entry("Long", strategy.long, qty=1, when = ENTRY_SIGNAL and signal_backtest())
Shoutouts to @zenandtheartoftrading and @allanster for providing the basis of this code that I put together here. We stand on the shoulders of giants.

All in 1 Indikator (MAs, GAP Indikator, BB, Clouds)This indicator provides:
-> up to 5 SMAs and EMAs at the same time.
-> HullMA
-> VWMA (Volume based MA)
-> Ichimoku Cloud
-> Parabolic SAR (for Trend analysis)
-> special 1. Add up to 2 Bollinger Bands (so you can add 2 BB at the same time with different standard deviations)
-> special 2. You also can add an GAP Indikator. The red and green lines you can see in the picture. This tool finds gap's in the btc cme chart for example and shows them to you
REAL STRATEGY : Dow_Factor_MFI/RSI_DVOG_StrategyI'm actually one of those who think it's more important to extract clues from indicators than strategy, but I wanted to test the data about the probability and dow factor I've shared for a long time.
Usually, Bitcoin is used as an eye stain for strategy success, since the graph has increased significantly from the beginning.
To prevent this, I used a commission and in the last lines of document I shared Bitmex's Bitcoin and Ethereum 1W test results.
I don't think there's a factor to repaint. ( Warn me if u see or observe )
I considered Bitcoin because I found working with liquid parities much more realistic.
Ethereum and Bitmex have been featured as a spot and may soon find a place at the CME , so I've evaluated the Ethereum .
But since the Ethereum Bitmex was also spot new, I deleted results that were less than 10 closed trades.
Since the Dow Theory also looks at the harmony in the indices, just try it in the Cryptocurrency market.
Use as indicator in other markets. Support with channels, trend lines with big periods and other supportive indicators.
And my personal suggestion : Use this script and indicator TF : 4H and above.
Specifications :
Commission. ( % 0.125 )
Switchable Methods ( Relative Strength Index / Money Flow Index )
Alarms. (Buy / Sell )
Position closure when horizontal market rates weighs.
Progressive gradual buy/sell alarms.
Clean code layout that will not cause repaint. (Caution : source = close )
Switchable barcolor option (I / 0 )
*****Test results :*****
drive.google.com
Summary:
It was a realistic test.
It has achieved great success in some markets, but as I mentioned earlier, use it only to gain insight into the price movements of cryptos.
Use as indicator in other markets.
This code is open source under the MIT license. If you have any improvements or corrections to suggest, please send me a pull request via the github repository : github.com
Stay tuned ! Noldo.

CL Daily Bitcoin Volume (All exchange included, even Mt.GOX)This daily volume data contains collective total from
____________________________________________________
Historical:
BTC-e BTC/USD (From Q3 2011 to Q3 2016)
BTCChina BTC/CNY (From Q3 2011 to Q2 2017)
Coinsetter BTC/USD (From Q3 2014 to Q1 2016)
MtGox BTC/USD (From July 2010 - 2014 only))
OKcoin International BTC/USD (From Q3 2014 to Q2 2017)
____________________________________________________
Institutions:
CME Bitcoin Futures
Grayscale Bitcoin Trust OTC
____________________________________________________
Spot exchanges:
Bitfinex BTC/USD
Bitstamp BTC/USD
Coinbase BTC/USD
Coinbase BTC/EUR
Binance BTC/USDT
Binance BTC/USDC
Binance BTC/PAX
Gemini BTC/USD
itBit BTC/USD
Kraken BTC/EUR
Kraken BTC/USD
Huobi BTC/USDT
Korbit BTC/KRW
Bitflyer BTC/JPY
____________________________________________________
Others:
Bitmex

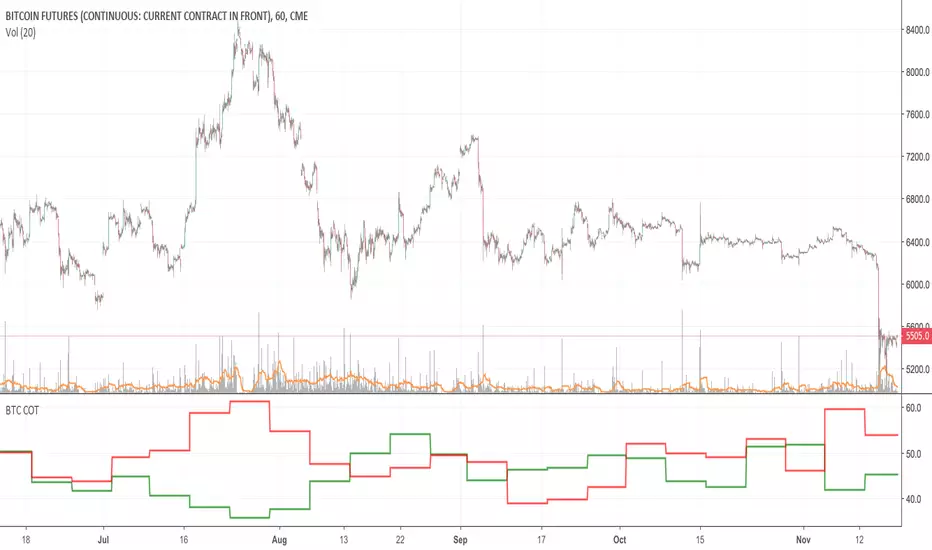
Bitcoin COT (CME)Commitment of Traders report from the CME.
HOW TO INTERPRET:
// 1. Trade in the same direction of institutional money.
// 2. Trade in the opposite direction of retail money.
// 3. Trade in the direction of professional money.
// 4. When %open interest held by largest 4 longs > %open interest held by largest 4 shorts = look to buy
// 5. When %open interest held by largest 4 shorts > %open interest held by largest 4 longs = look to sell
BTC Futures Settlement Dates - Life Zoltar InvestingThis is a TradingView script to map out the BTC Futures Settlement Dates. There was one floating around the internet but it was old and wasn’t updated. I took that, changed up the code and created this. Orange is CBOE and Blue is CME. You’ll notice shortly after the highlighted closed date, BTC starts to trend upwards.
Data from the below:
CBOE: cfe.cboe.com
CME: www.cmegroup.com


BTC Futures Settlement DatesShows the CBOE and CME settlement dates as horizontal lines, with the option to show a 7 day warning in the background. This should hopefully give ample warning.
I intend to update the script as new dates become available but please PM if I've forgotten.
