itradesize /\ IPDA Look Back - for any timeframeThe script automatically calculates the 20-40-60 look-back periods and their premium and discount ranges.
The base concept is from ICT’s IPDA which should be applied to the daily timeframe but now you can use that same concept on the lower timeframes .
The higher the timeframes you use the more reliable it will be ( when we are talking about lower timeframes than Daily ).
- With the use of the indicator you can apply it on any timeframe with ease.
- You can customize the coloring of premium & discount, frame lines, and even the look of it.
- Hide or show the EQ levels
Below the IPDA texts the indicator shows the actual percentage of the selected range based on the current price fluctuations.
The script handles the 20-40-60 days look-back as fractals so it can be applied on lower timeframes.
The basics:
- The Interbank Price Delivery Algorithm (IPDA): The algorithm creates a shift on the daily chart every 20, 40, and 60 trading days.
- These are the IPDA look-back periods. Every 20 trading days or so there is a new liquidity pool forming on both sides of the market based on ICT concepts.
- Determine the IPDA Data Range of the land 20 trading days.
- Note the highest high & lowest low in the past 20 trading days. Identify the institutional order flow and mark the relevant PD arrays in the selected IPDA look-back period we deemed useful for our trading style.
- This is your current dealing range.
- If the price consolidates for 20 days, consider switching to a 40-day look back.
Inside this dealing range, we look for the next draw on liquidity. Is it reaching for a liquidity pool or is it looking to rebalance at a particular PD Array. This is going to the Bias.
Which IPDA data range should you use?
IPDA20 can be our Short Term range - fit for intraday traders at most
IPDA40 can be our Swing Trade range - have a clear indication of the market profile
IPDA60 can be our range for position trading - have a clear indication of the market profile
Recherche dans les scripts pour "Fractal"

[AIO] Multi Collection Moving Averages 140 MA TypesAll In One Multi Collection Moving Averages.
Since signing up 2 years ago, I have been collecting various Сollections.
I decided to get it into a decent shape and make it one of the biggest collections on TV, and maybe the entire internet.
And now I'm sharing my collection with you.
140 Different Types of Moving Averages are waiting for you.
Specifically :
"
AARMA | Adaptive Autonomous Recursive Moving Average
ADMA | Adjusted Moving Average
ADXMA | Average Directional Moving Average
ADXVMA | Average Directional Volatility Moving Average
AHMA | Ahrens Moving Average
ALF | Ehler Adaptive Laguerre Filter
ALMA | Arnaud Legoux Moving Average
ALSMA | Adaptive Least Squares
ALXMA | Alexander Moving Average
AMA | Adaptive Moving Average
ARI | Unknown
ARSI | Adaptive RSI Moving Average
AUF | Auto Filter
AUTL | Auto-Line
BAMA | Bryant Adaptive Moving Average
BFMA | Blackman Filter Moving Average
CMA | Corrected Moving Average
CORMA | Correlation Moving Average
COVEMA | Coefficient of Variation Weighted Exponential Moving Average
COVNA | Coefficient of Variation Weighted Moving Average
CTI | Coral Trend Indicator
DEC | Ehlers Simple Decycler
DEMA | Double EMA Moving Average
DEVS | Ehlers - Deviation Scaled Moving Average
DONEMA | Donchian Extremum Moving Average
DONMA | Donchian Moving Average
DSEMA | Double Smoothed Exponential Moving Average
DSWF | Damped Sine Wave Weighted Filter
DWMA | Double Weighted Moving Average
E2PBF | Ehlers 2-Pole Butterworth Filter
E2SSF | Ehlers 2-Pole Super Smoother Filter
E3PBF | Ehlers 3-Pole Butterworth Filter
E3SSF | Ehlers 3-Pole Super Smoother Filter
EDMA | Exponentially Deviating Moving Average (MZ EDMA)
EDSMA | Ehlers Dynamic Smoothed Moving Average
EEO | Ehlers Modified Elliptic Filter Optimum
EFRAMA | Ehlers Modified Fractal Adaptive Moving Average
EHMA | Exponential Hull Moving Average
EIT | Ehlers Instantaneous Trendline
ELF | Ehler Laguerre filter
EMA | Exponential Moving Average
EMARSI | EMARSI
EPF | Edge Preserving Filter
EPMA | End Point Moving Average
EREA | Ehlers Reverse Exponential Moving Average
ESSF | Ehlers Super Smoother Filter 2-pole
ETMA | Exponential Triangular Moving Average
EVMA | Elastic Volume Weighted Moving Average
FAMA | Following Adaptive Moving Average
FEMA | Fast Exponential Moving Average
FIBWMA | Fibonacci Weighted Moving Average
FLSMA | Fisher Least Squares Moving Average
FRAMA | Ehlers - Fractal Adaptive Moving Average
FX | Fibonacci X Level
GAUS | Ehlers - Gaussian Filter
GHL | Gann High Low
GMA | Gaussian Moving Average
GMMA | Geometric Mean Moving Average
HCF | Hybrid Convolution Filter
HEMA | Holt Exponential Moving Average
HKAMA | Hilbert based Kaufman Adaptive Moving Average
HMA | Harmonic Moving Average
HSMA | Hirashima Sugita Moving Average
HULL | Hull Moving Average
HULLT | Hull Triple Moving Average
HWMA | Henderson Weighted Moving Average
IE2 | Early T3 by Tim Tilson
IIRF | Infinite Impulse Response Filter
ILRS | Integral of Linear Regression Slope
JMA | Jurik Moving Average
KA | Unknown
KAMA | Kaufman Adaptive Moving Average & Apirine Adaptive MA
KIJUN | KIJUN
KIJUN2 | Kijun v2
LAG | Ehlers - Laguerre Filter
LCLSMA | 1LC-LSMA (1 line code lsma with 3 functions)
LEMA | Leader Exponential Moving Average
LLMA | Low-Lag Moving Average
LMA | Leo Moving Average
LP | Unknown
LRL | Linear Regression Line
LSMA | Least Squares Moving Average / Linear Regression Curve
LTB | Unknown
LWMA | Linear Weighted Moving Average
MAMA | MAMA - MESA Adaptive Moving Average
MAVW | Mavilim Weighted Moving Average
MCGD | McGinley Dynamic Moving Average
MF | Modular Filter
MID | Median Moving Average / Percentile Nearest Rank
MNMA | McNicholl Moving Average
MTMA | Unknown
MVSMA | Minimum Variance SMA
NLMA | Non-lag Moving Average
NWMA | Dürschner 3rd Generation Moving Average (New WMA)
PKF | Parametric Kalman Filter
PWMA | Parabolic Weighted Moving Average
QEMA | Quadruple Exponential Moving Average
QMA | Quick Moving Average
REMA | Regularized Exponential Moving Average
REPMA | Repulsion Moving Average
RGEMA | Range Exponential Moving Average
RMA | Welles Wilders Smoothing Moving Average
RMF | Recursive Median Filter
RMTA | Recursive Moving Trend Average
RSMA | Relative Strength Moving Average - based on RSI
RSRMA | Right Sided Ricker MA
RWMA | Regressively Weighted Moving Average
SAMA | Slope Adaptive Moving Average
SFMA | Smoother Filter Moving Average
SMA | Simple Moving Average
SSB | Senkou Span B
SSF | Ehlers - Super Smoother Filter P2
SSMA | Super Smooth Moving Average
STMA | Unknown
SWMA | Self-Weighted Moving Average
SW_MA | Sine-Weighted Moving Average
TEMA | Triple Exponential Moving Average
THMA | Triple Exponential Hull Moving Average
TL | Unknown
TMA | Triangular Moving Average
TPBF | Three-pole Ehlers Butterworth
TRAMA | Trend Regularity Adaptive Moving Average
TSF | True Strength Force
TT3 | Tilson (3rd Degree) Moving Average
VAMA | Volatility Adjusted Moving Average
VAMAF | Volume Adjusted Moving Average Function
VAR | Vector Autoregression Moving Average
VBMA | Variable Moving Average
VHMA | Vertical Horizontal Moving Average
VIDYA | Variable Index Dynamic Average
VMA | Volume Moving Average
VSO | Unknown
VWMA | Volume Weighted Moving Average
WCD | Unknown
WMA | Weighted Moving Average
XEMA | Optimized Exponential Moving Average
ZEMA | Zero Lag Moving Average
ZLDEMA | Zero-Lag Double Exponential Moving Average
ZLEMA | Ehlers - Zero Lag Exponential Moving Average
ZLTEMA | Zero-Lag Triple Exponential Moving Average
ZSMA | Zero-Lag Simple Moving Average
"
Don't forget that you can use any Moving Average not only for the chart but also for any of your indicators without affecting the code as in my example.
But remember that some MAs are not designed to work with anything other than a chart.
All MA and Code lists are sorted strictly alphabetically by short name (A-Z).
Each MA has its own number (ID) by which you can display the Moving Average you need.
Next to the ID selection there are tooltips with short names and their numbers. Use them.
The panel below will help you to read the Name of the selected MA.
Because of the size of the collection I think this is the optimal and most convenient use. Correct me if this is not the case.
Unknown - Some MAs I collected so long ago that I lost the full real name and couldn't find the authors. If you recognize them, please let me know.
I have deliberately simplified all MAs to input just Source and Length.
Because the collection is so large, it would be quite inconvenient and difficult to customize all MA functions (multipliers, offset, etc.).
If you need or like any MA you will still have to take it from my collection for your code.
I tried to leave the basic MA settings inside function in first strings.
I have tried to list most of the authors, but since the bulk of the collection was created a long time ago and was not intended for public publication I could not find all of them.
Some of the features were created from scratch or may have been slightly modified, so please be careful.
If you would like to improve this collection, please write to me in PM.
Also Credits, Likes, Awards, Loves and Thanks to :
@alexgrover
@allanster
@andre_007
@auroagwei
@blackcat1402
@bsharpe
@cheatcountry
@CrackingCryptocurrency
@Duyck
@ErwinBeckers
@everget
@glaz
@gotbeatz26107
@HPotter
@io72signals
@JacobAmos
@JoshuaMcGowan
@KivancOzbilgic
@LazyBear
@loxx
@LuxAlgo
@MightyZinger
@nemozny
@NGBaltic
@peacefulLizard50262
@RicardoSantos
@StalexBot
@ThiagoSchmitz
@TradingView
— 𝐀𝐧𝐝 𝐎𝐭𝐡𝐞𝐫𝐬 !
So just a Big Thank You to everyone who has ever and anywhere shared their codes.

Consolidation Spotter Multi Time FrameThis tool is designed for traders looking to spot areas of consolidation on their charts across various time frames. It highlights these consolidation areas using visually appealing boxes, making it easier to identify potential breakout or breakdown zones.
How To Use:
Spotting Consolidation: When you see a box form on your chart, this represents a consolidation zone. Within this zone, the price is moving sideways without a strong upward or downward trend.
Anticipating Breakouts & Breakdowns: Watch the price as it approaches the edges of the box. A movement outside the box can signal a potential breakout (if above the box) or a breakdown (if below the box). This is where momentum shifts can happen.
Momentum Confirmation: Once the price clearly moves out of the box, it indicates a momentum shift. If the price moves upwards out of the box, this can be seen as bullish momentum. Conversely, if the price moves downwards out of the box, this can be seen as bearish momentum.
To use the tool effectively, adjust the settings to suit your trading style, choose your preferred visual theme, and watch as the script highlights key consolidation areas on your chart.
Tip: To visualize fractals, consider using multiple instances of the "Consolidation Spotter" indicator, each set to a different timeframe. This approach allows you to observe consolidations nested within larger consolidations, offering deeper insights into market structures. 😉

Average Range Levels [Pro+]Description:
The Average Range Levels builds on the concepts of ADR projections showcased in its lite version.
Average Daily Range (ADR) is a common metric used to measure volatility in an asset. It calculates the average difference between the highest and lowest price over a time interval – normally five days.
The Inner Circle Trader teaches the importance of this metric from an algorithmic point of view; in particular the 1/3ADR price level is deemed to be a threshold used to determine the area at which a Judas Swing – false move to trick market participants, protraction, manipulation – might exhaust.
Another key difference in the ICT-use of this metric compared to the classic approach is that the average range is calculated from New York midnight Time, rather than the daily candle's open.
This exact concept was upscaled to higher Timeframe fractals obtaining the Average Weekly Range (AWR) and the Average Monthly Range (AMR). The latter two metrics are anchored at the first Monday’s midnight (New York Time) of the respective interval – however they also have the option to be anchored at the True Week Open (Tuesday’s Daily Open) and True Month Open (Second Week Open).
It is crucial to remember that the elements of Time are key when it comes to interpreting how price action will, or won't, react to these levels: what Time of the day is it? what day of the week? what week of the month?
If one thinks about the Power of Three of a candle (Accumulation, Manipulation Distribution), it is highly unlikely that a Manipulation event will happen later in the candle’s development – seeing the 1/3ADR hold in London session or New York open, seeing the 1/3AWR hold on Tuesday or Wednesday, or seeing price race to the 1/3AMR early on in the month gives undeniable edge to an Analyst.
Apart from the 1/3 level seen from a Judas perspective, the opposing 1/3 level, and the full AR projections, are excellent algorithmic levels at which we will see orderflow or reactions worth studying. These can be take profit targets, reversal opportunities, pyramid entries, …
Last but not least, the tool is equipped with a Data Table. You have a clear narrative but you are unsure of when price will expand? Track the previous 5 ARs and the current Range for Daily, Weekly, and Monthly – the smaller the AR the higher the chance for an expansion, the larger the AR the higher the chance for a consolidation.
Tool Features:
Auto Color the drawings based on your chart’s background or choose your own
Decide whether to consider daily candles, or New York (00:00 to 00:00 NY Time) for the basis of the calculation
Show the last 10 Historical Levels
– See the AR Range, the AR price levels and 1/3AR price levels by hovering over the text labels
Plot the AR levels from their Time Anchor, or as offset markers on the side for a cleaner look
Show/Hide all elements individually
In the Idea below, you can see how INDEX:BTCUSD hit the 1/3AMR level at the end of the second week of the month. The subsequent rejection from this level suggests we might have witnessed a Judas Swing, hence we flip to bullish bias.
In the more recent AWR levels, we can see how price did not touch any level until friday – this is a consolidation week with low probability setups. This was expected, if one looks at the precious two week's ranges and respective average ranges in the Data Table: both breached the AR value, due to to the great expansion higher.
Lastly for the ADR levels we can see how the Judas higher got beautifully stopped at the 1/3 level, and the full ADR level on the opposite side catches price while it falls.
To Get Access, and Level Up see the Author's Instructions below!
This indicator is available only on the TradingView platform.
⚠️ Intellectual Property Rights ⚠️
While this tool's base concepts are public, its interpretation, code, and presentation are protected intellectual property. Unauthorized copying or distribution is prohibited.
⚠️ Terms and Conditions ⚠️
This financial tool is for educational purposes only and not financial advice. Users assume responsibility for decisions made based on the tool's information. Past performance doesn't guarantee future results. By using this tool, users agree to these terms.
Script payant

Lune Oscillator Premium⬛️ Overview
Lune Oscillator is an advanced and innovative TradingView indicator designed to enhance your market analysis. Rather than merely improving visuals or merging traditional indicators, it introduces a series of unique features, each with its unique value proposition. This script stands out due to its originality, and the significant utility it brings to traders.
🟦 Features
Oscillator features an assortment of sophisticated tools aimed at refining your trading strategies:
🔹 Trend Oscillator: This feature integrates market trend and momentum analysis into one dynamic oscillator. It's designed to facilitate market trend and momentum analysis, and is invaluable to traders as it combines both trend and momentum analysis into one tool. For instance, if a ticker shows signs of slowing momentum after a recent rally, the Trend Oscillator could predict a potential trend reversal. The Trend Oscillator’s sensitivity and velocity settings can be tailored to suit your trading style and strategy. It is developed using a custom formula similar to WaveTrend but optimized for better detection of trend and momentum shifts.
🔹 Market Peak: Market Peak identifies potential market peaks and troughs using a percentile-based system. It's aimed at detecting overextensions in the Trend Oscillator, indicating potential market reversals. Compact and user-friendly, this feature signals potential trade exit points in case of an impending market reversal. Its sensitivity can be adjusted to react to either short-term or long-term market changes. By analyzing the market's average move, it detects overbought or oversold conditions when the percentage gets too extreme.
🔹 Money Pulse: The Money Pulse feature serves as a radar for money inflow or outflow, helping users detect nascent trends and reversals. It enables traders to spot early opportunities and reversals and align their strategies with institutional and large players. For example, a bullish Money Pulse during market consolidation could signal money influx and the beginning of an accumulation phase. The sensitivity of the Market Pulse can be adapted to short-term or long-term changes. This feature employs an improved version of the Money Flow concept.
🔹 Liquidity Pulse: Liquidity Pulse provides a unique perspective of asset liquidity by tracking market inflow and outflow volumes. It assists traders in understanding the market's liquidity sentiment, which is particularly useful for long-term trades and confluence. For instance, a bullish Liquidity Pulse could signal abundant liquidity, potentially driving up the price. The sensitivity setting can be adjusted for short-term or long-term liquidity changes. This feature utilizes an enhanced version of the On-Balance Volume concept.
🔹 Institutional Wave: This feature tracks the cumulative inflow and outflow for a specific ticker, helping traders monitor institutional money flows. It enables the analysis of a ticker's accumulation and distribution, assisting in detecting early trade entries and avoiding dumps. For example, a decrease in volume during consolidation after a price rally could indicate sell-off and potential price drop. The Institutional Wave's sensitivity can be adapted to either short-term or long-term changes. It operates on the Accumulation and Distribution concept.
🔹 Power Wave: The Power Wave evaluates market strength and momentum, indicating market power shifts. It helps traders understand the true power behind a market move. For instance, a decreasing Power Wave during a bullish move could indicate a weakening trend, suggesting a bearish strategy instead. The sensitivity of the Power Wave can be set for short-term or long-term market changes. The Power Wave calculates market strength by evaluating price change volatility.
🔹 Market Pressure: This feature detects shifts in buy and sell pressure, signaling potential turning points. It helps traders understand the power balance in the market. For example, a bullish Market Pressure shift during a short trade could suggest a momentum gain by bulls, indicating a trade exit. The Market Pressure's sensitivity can be adjusted for short-term or long-term changes. This feature uses volume data and moving averages to detect market pressure shifts, filtering out false and volatile signals.
🔹 Oscillator Copilot: Incorporating Smart Bias and Reversal Radar, the Oscillator Copilot helps identify market trends and potential reversals. It searches for confluence within multiple Oscillator features, providing a straightforward assistive tool. For example, a bullish Smart Bias signal during a long trade could suggest staying in the trade longer, while a bearish Reversal Radar signal could indicate the need to exit the trade.
🔹 Divergence Detection: This feature offers a sophisticated detection system for both regular and hidden market divergences, providing additional confluence and highlighting hard-to-detect divergences. For instance, a bullish Regular Divergence could signal a potential trade entry or exit depending on your overall market sentiment and bias. This feature uses fractals to effectively detect divergences in the market based on the Trend Oscillator.
🔹 Color Themes: Personalize your charting experience with various color themes. This feature enhances the visual appeal of your chart, offering easy setup and use. For example, use the “Ice” theme for a unique and colorful experience or the “Dark” theme for a more subdued look. Themes available include Default, Light, Dark, and Ice. This feature modifies the colors of your candles and features based on the selected theme.
These features and tools collectively offer a comprehensive solution for traders to understand and navigate the financial markets. It's important to remember that they are designed to assist in making informed trading decisions and should be used as part of a balanced trading strategy.
🟧 Usage
Lune Oscillator's features are designed to be both standalone tools and components of a larger, integrated trading strategy. It is important to understand each feature and experiment with different configurations to best suit your unique trading needs.
🔸 Example #1: The following demonstrates how the Oscillator Copilot can be an excellent trade assistant.
The Oscillator Copilot leverages multiple Lune Oscillator features, allowing traders to quickly assess overall market sentiment. It uses Smart Bias and Reversal Radar tools to deliver these insights. For instance, at point 1, a bullish Smart Bias (denoted by a green circle) represents a collective bullish sentiment from multiple components of Lune Oscillator, often leading to a price increase. Conversely, at point 2, we identify two bearish reversal signals from the Reversal Radar (highlighted by red triangles). This convergence of bearish signals from multiple components hints at a potential market reversal, often followed by a gradual price decline.
🔸 Example #2: This example shows how the Market Peak feature can aid in detecting potential market tops and bottoms.
Market Peak calculates how overbought or oversold a ticker is using a percentile system, offering insights into potential reversals. At points 1 and 2, we observe bearish Market Peaks suggesting overbought conditions and indicating a possible shift in trend. Subsequent to these peaks, we witness a price drop, mirroring the overbought market conditions. In contrast, at point 3, a bullish Market Peak suggests an oversold market, indicating a potential trend reversal and subsequent price increase.
🔸 Example #3: This is an example of how combining various features such as the Money Pulse, Liquidity Pulse, Institutional Wave, and Market Peak, can help make more informed trades.
Money Pulse and Liquidity Pulse provide insights into the money and liquidity flow in the market, respectively, while the Institutional Wave monitors the cumulative volume shifts and changes. Together with Market Peak, they offer a comprehensive view of the market's state.
At point 1, the positive Liquidity Wave (crossing above 0) suggests a bullish market volume. At point 2, a bullish Market Pressure indicates an increase in buying pressure, reinforcing the bullish sentiment. At point 3, a negative Liquidity Wave (crossing below 0) indicates a bearish sentiment, suggesting that market participants are exiting their positions. The concurrent Market Pressure hints at an increase in selling activity. Taking all these factors into account provides a strong indicator that the market sentiment has turned bearish.
🟥 Conclusion
Lune Oscillator aims to provide a suite of tools that bring unique value to traders. Each feature is designed to offer different, yet complementary, perspectives on the market, allowing users to piece together a more comprehensive understanding of their trading environment.
🔻 Access
You can see the Author's instructions below to get instant access to this indicator & our Premium Suite.
🔻 Disclaimer
Lune Oscillator is a tool for aiding in market analysis and is not a guarantee of future market performance or individual trading success. We strongly recommend that users combine our tool with their trading strategies and do their due diligence before making any trading decisions.
Remember, past performance is not indicative of future results. Please trade responsibly.

CandlesticksIndicator that identifies the classical candlestick patterns for markets that are open 24/7 like the crypto market.
Why? because those markets don't gap, so many patterns won't need to gap to be valid.
Also, the theoretical rules about the patterns are very strict but it is to the discretion of the trader or technical analyst to decide if the patterns are yet valid. This is how Steve Nison uses candlesticks, i.e. a hammer is still valid if it has a small upper shadow, a marubozu is still valid if it has tiny shadows, etc.
So, for each candlestick pattern there are tolerance parameters so you can decide what is an acceptable upper shadow size for a hammer etc. I have set them to my liking but you might want to adjust them which is totally fine.
Additional features:
-to avoid the clutter, decide how many candles have to be analyzed
-use a trend filter based on the ema 5 (you can change the value) so you only see reversal patterns relevant to the trend
-plot pivots (swings HL)
-volume confirmation: bearish signals don't need volume confirmation as prices fall off their own weight. But volume confirmation for bullish price action can serve as added confluence. You have a setting that allows you to decide how many times the volume needs to be bigger than the previous candle's volume : if you have a bullish candlestick pattern printed, if the volume is1.5 times bigger than the previous candle then you will have a shape plotted at the bottom of your chart
-there is a cheap vs expensive feature that colors the bars
-you can also color the background so you see the oversold/overbought RSI
-finally, there are a couple of custom signals
"RULES" ABOUT CANDLESTICKS
-this is not a system in itself, but combined with other candlesticks (cluster of candlesticks), volume, oscillators, trend lines, support and resistances, bollinger bands can give amazing results and that is where the magic is
-most candlesticks can establish a support or resistance or confirm one
-a reversal candlestick doesn't mean that market will shoot the other direction right away, trend changes occur usually slowly and the trend might not reverse but convert in a period of sideways. It shouldn't actually be named reversal patterns but rather trend change patterns.
-reversal patterns need a trend to reverse (or change), in ranging markets you should ignore the signals
-you might think that there are many false signals, you need to understand that they are early warnings and the next candle's close is of major importance. A hammer at the end of a downtrend isn't enough to enter a position, you will have to wait for the next candle to close above the high of the hammer to validate the bullish reversal and vice versa.
-some signals are based on 1 candle only (like the hammer) others on 2 candles (like the engulfing pattern), others on 3 and more (tower top, morning star, etc). Patterns based on multiple candles have more probability.
-you might want to wait for price to revisit the support created by the pattern (read below) to get a better entry
-candles do not provide price targets
-long lower shadows is bullish, long upper shadows is bearish, small bodies (spinning tops, stars, dojis) means indecision and market is vulnerable to a trend change and the color of the body is irrelevant, declining size of bodies means trend strength weakening
HAMMER
stop-loss under the lower shadow
lower shadow can become a potential support or confirm an existing support
ENGULFING
with bearish engulfing pattern use the highest high of the 2 candles as a resistance, and with bullish engulfing pattern use the lowest low as support
DARK CLOUD COVER
use the highest high of the 2 candles as resistance
PIERCING PATTERN
use the lowest low of the 2 candles as support
MORNING STAR
use the lowest low of the 3 candles as support
the smaller the body of the 2nd candle the more potent the signal
for traditional markets, an ideal morning star would have a gap between 2nd and 3rd candles' bodies
EVENING STAR
use the highest high of the 3 candles as resistance
the smaller the body of the 2nd candle the more potent the signal
HARAMI
the smaller the size of the candle the more potent the signal
TWEEZERS
very important signals by themselves on weekly and monthly charts
for daily and intraday signals, it is potent only if it meets additional criterias (1st candle long, 2nd short, a candle pattern with with same highs or lows)
BELT-HOLD
they are more important if they confirm a support or resistance or another belt-hold or if they have not appeared for a while.
3 BLACK CROWS AND 3 WHITE SOLDIERS
candles 1 and 2 should act as support for the 3WS and as resistance for the 3BC
RISING AND FALLING 3 METHODS
stop-loss is the low of the 1st candle that started the rising 3 methods
stop-loss is the high of the 1st candle that started the falling 3 methods
ideally 1st and last candles have the strongest volume
DOJI
signal is reinforced by subsequent candles, if market is oversold or overbought, if the market doesn't have many doji on the chart, if market is at an important junction, if there are other technical alerts
doji after a tall candle are especially potent, the highest high of the 2 candles is the resistance
doji are especially potent after an uptrend, less so after a downtrend
gavestone doji is a bearish signal
dragonfly doji is a bullish signal
long-legged doji is a confused market
CUSTOM
*1st signal is a continuation pattern based on the progression of bodies' sizes and/or shadows' sizes
*following ones are reversal patterns based on the progression of bodies' sizes and/or shadows' sizes
*early reversal is based on a "secret" excess signal
reversal confirmed is when the early reversal's excess resolves and price reintegrates the non-excess area + prints a custom reversal pattern
for both early reversal and reversal confirmed the same rule applies as with any candlestick signal: we wait for the next candle's close above the previous upper shadow (bullish reversal) or below the previous lower shadow (bearish reversal)
*swings are 3 candles fractals, they are not reversal or continuation patterns but serve to mark swing highs and lows
this is all based on Steve Nison's book Japanese candlestick charting techniques
and
Thomas N. Bulkowski's Encyclopedia of candlestick charts
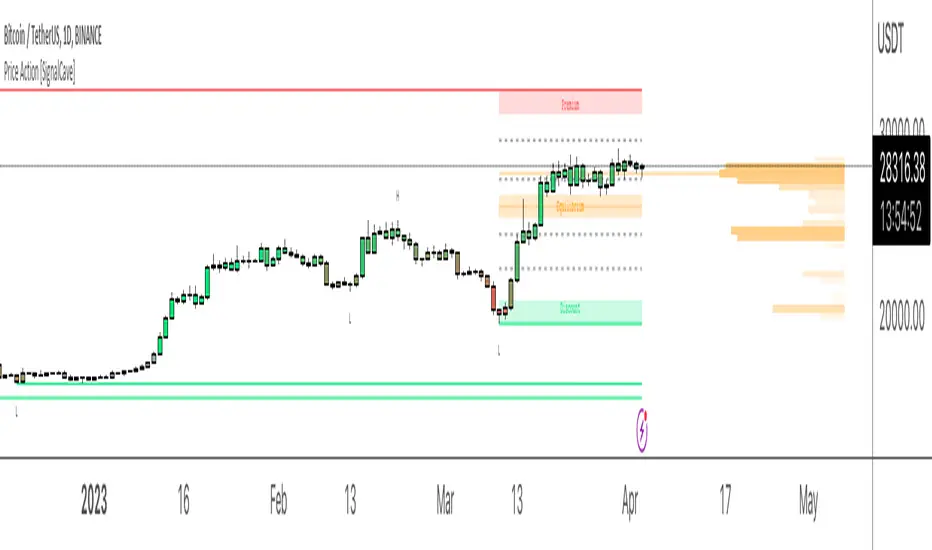
Price Action [SignalCave]Liquidation prices are calculated with Higher Timeframe usage of "Williams Fractals" indicator.
Sell side liquidity levels are shown with "L" text and a green solid lines.
Buy side liquidity levels are shown with "H" text and a red solid lines.
Premium and Discount zones are determined with latest untested buy/sell liquidity levels.
"Premium" means the asset price is overvalued, "Discount" means the asset is undervalued.
Once price hits any active liquidity level, "Premium and Discount" zone will be recalculated.
Premium and Discount have "Equilibrium" area which is center area of the whole zone.
Extra Support & Resistance levels calculation are based on Fibonacci. Levels are 23.6%, 38.2%, 61.8% and 78.6% .
Bars are painted based on asset's momentum. The asset momentum is calculated by the RSI and ADX indicators.
Volume profile shows trade activity during the "Premium and Discount" zone.
Break Levels – Peaks and Valleys – Market StructureDescription
An experimental script, designed as a visual aid, to highlight two consecutive green candles after a red candle, and two consecutive red candles after a green candle. We can assume these formations to be potential candidates as an origin of a peak and valley. The highest point of the 1st red candle and lowest point of the 1st green candle is to be considered as break levels.
How to use
Expect attacks/tests or a break of these levels in the future. A solid break through these levels may produce a potential retest in the opposite direction. The greater the number of times a zone is tested, the more likely it is to break.
By using them as reference points, traders are expected to follow their own set of rules and mark higher probability supply and demand zones in the area.
Alerts are added for either a candle close or wick through the levels. For the alerts the script only trails the latest high and low break levels.
This can be used as an alternative to those who use fractals for market structure.
Indicator in use

BEST ABCD Pattern Screener Deribit:DVOL BTC DXY scannerModified this script by Daveatt (based on Ricardo Santos Fractals)
to scan patterns in BTCUSD, ETHUSD, DVOL, DXY, DVOL/VV

Triangulation : Statistically Approved ReversalsA lot of calculation, but a simple and effective result displayed on the chart.
It automatically identifies a very favorable period for a price reversal, by analyzing the daily and intraday price action statistics from the maximum of the most recent bars from the historical data. No repainting. Alerts can be set.
The statistical study is done in real time for each instrument. The probabilities therefore vary over time and adapt to the latest information collected by the indicator.
The time range of the data study can be changed by simply changing the UT :
- 30m = 3.5 last months feed statistics
- 15m = 52 last days feed statistics
- 5m = 17 last days feed statistics (recommanded)
HOW TO USE
This indicator informs when we are in a time period strongly favorable to reversal.
==> Crossing probabilities of different kinds, in price and in time => Triangulation of top and bottom !
HOW It WORK :
fractal statistics on high and low formation.
hour's probabilities of making the high/low of the day are crossed with day's probabilities of making the high/low of the week.
First for the day, we study:
- value of the probability compared to the average probabilities
- value of the coefficient between the high probability and the low probability
which we then refine for the hour, with the same calculation.
Result: bright color for a day + hour with high probability, weak color if the probability is low but remains the only possible bias. Between these two possibilities, intermediate colors are possible - just like looking for shorts if the day is bullish, if it is a high probability hour!
This color is displayed in the background, only if we are forming the high of the day for tops, and the low of the day for bottoms - detected with a stochastic.
All probabilities are studied in real time for the current asset.
We will call this signal "killstats", for "killzones statistics"
fractal statistics on the probability of closure under specific predefined levels according to 36 cycles.
the probabilities of several cycles are studied, for example:
NY session versus London and Asian sessions, London session compared to its opening, NY session compared to its opening, "algorithmic cycles" ( 1h30), Opening of NY compared to its intersection with London..
Each cycle producing a probability of closing with respect to the opening price of each period. The periods are : (Etc/UTC)
15-18h / 15-16h / 9-13h / 14-17h / 18-22h / 10-12h / 9-10h30 / 10h30-12h / 12-13h30 / 13h30-15h / 15h-16h30 / 16h30-18h
The cycles can be superimposed, which allows to support or attenuate a signal for the key periods of the day: 9am-12pm, and 3pm-6pm. The period of the day covered by the study of cycles is 9h-22h.
Result : ==> a straight line with a half bell. Colors = almost transparent for 53% probability (low), and very intense for a high probability (75%). The line displayed corresponds to the opening price, which we are supposed to close within the time limit - before the end of the period, where the line stops.
If the price goes in the opposite direction to the one predicted by the statistics, then a background connects the price to the close level to be respected.
if direction and close is respected, nothing is displayed : there is no opportunity, no divergence between statistics and actual price moves.
By unchecking the "light mode", you can see each close level displayed on the chart, with the corresponding probability and the number of times the cycle was detected. The color varies from intense for a high probability (75%), to light for a low probability (53%)
We will call this signal "cyclic anomalies"
By default, as shown in the indicator presentation image, the "intersection only" option is checked: only the intersection between 1) killstats and 2) cyclic anomalies is displayed. (filter +-30% of killstats signals)
MORE INFORMATIONS
/!\ : during a backtest, it is necessary to refresh the studied data to benefit from the real time signals, and for that you have to use the replay mode. if "Backtesting informations?"is checked, labels are displayed on the graph to warn of the % distortion of the signals. I recommend using the replay mode every 250 candles, and every 1000 candles for premium accounts, to have real signals.
- Alerts can be set for killzone, or intersections ( As in presentation picture)
- The ideal use is in m5. It can trigger several times a day, sometimes in opposite directions, and sometimes not trigger for several days.
- Premium account have 20k candles data, and not 5k => signals may vary depending on your tradingview subscription.

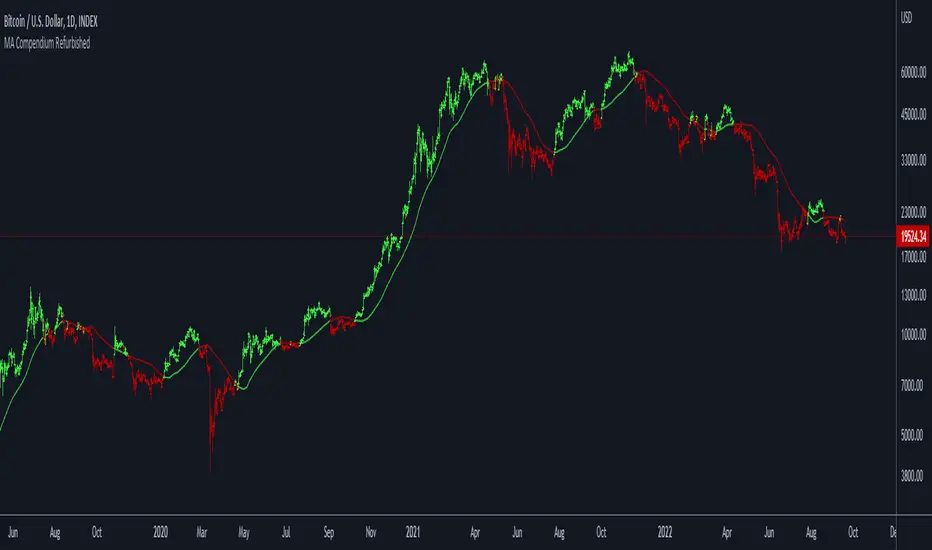
Moving Average Compendium RefurbishedThis is my effort to bring together in a single script the widest range of moving averages possible.
I aggregated the calculation of averages within a library.
For more information about the library follow the link:
Basically this indicator is the visual result of this library.
You can choose the moving average and the script updates the chart as per the type.
The unique parameters of certain moving averages remain at their default values.
To have a rainbow of moving averages I also made an indicator:
Available moving averages:
AARMA = 'Adaptive Autonomous Recursive Moving Average'
ADEMA = '* Alpha-Decreasing Exponential Moving Average'
AHMA = 'Ahrens Moving Average'
ALMA = 'Arnaud Legoux Moving Average'
ALSMA = 'Adaptive Least Squares'
AUTOL = 'Auto-Line'
CMA = 'Corrective Moving average'
CORMA = 'Correlation Moving Average Price'
COVWEMA = 'Coefficient of Variation Weighted Exponential Moving Average'
COVWMA = 'Coefficient of Variation Weighted Moving Average'
DEMA = 'Double Exponential Moving Average'
DONCHIAN = 'Donchian Middle Channel'
EDMA = 'Exponentially Deviating Moving Average'
EDSMA = 'Ehlers Dynamic Smoothed Moving Average'
EFRAMA = '* Ehlrs Modified Fractal Adaptive Moving Average'
EHMA = 'Exponential Hull Moving Average'
EMA = 'Exponential Moving Average'
EPMA = 'End Point Moving Average'
ETMA = 'Exponential Triangular Moving Average'
EVWMA = 'Elastic Volume Weighted Moving Average'
FAMA = 'Following Adaptive Moving Average'
FIBOWMA = 'Fibonacci Weighted Moving Average'
FISHLSMA = 'Fisher Least Squares Moving Average'
FRAMA = 'Fractal Adaptive Moving Average'
GMA = 'Geometric Moving Average'
HKAMA = 'Hilbert based Kaufman\'s Adaptive Moving Average'
HMA = 'Hull Moving Average'
JURIK = 'Jurik Moving Average'
KAMA = 'Kaufman\'s Adaptive Moving Average'
LC_LSMA = '1LC-LSMA (1 line code lsma with 3 functions)'
LEOMA = 'Leo Moving Average'
LINWMA = 'Linear Weighted Moving Average'
LSMA = 'Least Squares Moving Average'
MAMA = 'MESA Adaptive Moving Average'
MCMA = 'McNicholl Moving Average'
MEDIAN = 'Median'
REGMA = 'Regularized Exponential Moving Average'
REMA = 'Range EMA'
REPMA = 'Repulsion Moving Average'
RMA = 'Relative Moving Average'
RSIMA = 'RSI Moving average'
RVWAP = '* Rolling VWAP'
SMA = 'Simple Moving Average'
SMMA = 'Smoothed Moving Average'
SRWMA = 'Square Root Weighted Moving Average'
SW_MA = 'Sine-Weighted Moving Average'
SWMA = '* Symmetrically Weighted Moving Average'
TEMA = 'Triple Exponential Moving Average'
THMA = 'Triple Hull Moving Average'
TREMA = 'Triangular Exponential Moving Average'
TRSMA = 'Triangular Simple Moving Average'
TT3 = 'Tillson T3'
VAMA = 'Volatility Adjusted Moving Average'
VIDYA = 'Variable Index Dynamic Average'
VWAP = '* VWAP'
VWMA = 'Volume-weighted Moving Average'
WMA = 'Weighted Moving Average'
WWMA = 'Welles Wilder Moving Average'
XEMA = 'Optimized Exponential Moving Average'
ZEMA = 'Zero-Lag Exponential Moving Average'
ZSMA = 'Zero-Lag Simple Moving Average'
Money Flow Trend Strength [CraftyChaos]I devised this indicator because I wanted to find a way to track the Money Flow Trend to exhaustion for both directions.
Overview:
I use two MFI series and an EMA of the faster MFI series to derive when the Money Flow is trending in one direction or another.
What does this indicator not do:
This indicator does not give buy and sell signals.
What does this indicator do:
This indicator offers confluence with your other indicators to determine when a reversal is approaching after a sustained trend of money flowing in or out of an asset.
This indicator can help time your trades near reversal points, so you are not entering trades in the middle of some trending move.
How to Tune
I would not recommend changing the settings. I have exposed them for people that want to experiment. The short lengths are key to reducing lag
How to read the indicator:
When a red cross appears at the top, this indicates money flow into the asset is strong. Do not short an asset while there are red crosses. You will get REKT
When a green cross appears at the bottom, this indicates money flow exiting the asset is strong. DO NOT buy an asset while there are green crosses. You will get REKT.
When the white step line enters the top, but no crosses appear, this indicates money is flowing into the asset, but is weak. The trend will either gain strength soon or will collapse.
When the white step line enters the bottom, but no crosses appear, this indicates money is flowing out of the asset, but is weak. The trend will either gain strength soon or will collapse.
The green line is the slower MFI. I would not use any crosses with the white step line and the green line. These two lines can cross frequently and show divergences with price. very frequent crossing may indicate sideways movement with no real price movement.
I often see the white step line enter the bottom and top zones under two primary conditions:
Secondary tests of support and resistance zone which fail
Failed breakouts/pullbacks after a pump or dump
Additionally, I use my indicator with the following indicators. You may find them useful:
Jurik Filtered, Composite Fractal Behavior (CFB) Channels (on current timeframe). Note: I often find strong trends trace the upper/lower bands, and end when the upper or lower band flattens
Jurik Filtered, Composite Fractal Behavior (CFB) Channels (on smaller timeframe, i.e., 2hr on a 4h or 15m on the 1hr). Note: I often find weak trend pullbacks/breakouts touch the channel bands
Session Volume Profile. Note: find trend completion corresponds to price above/below VAL areas
Moving Averages RefurbishedIntroduction
This is a collection of multiple moving averages, where you can have a rainbow of moving averages with different types that can be defined by the user.
There are already other indicators in this rainbow style, however certain averages are absent in certain indicators and present in others,
needing the merge to have a more complete solution.
Resources
Here there is the possibility to individually define each moving average.
In addition, it is possible to adjust some details, such as themes, coloring and periods.
Regarding the calculation of averages, credit goes to the following authors.
What I've done here is to group these averages together and allow them to combine.
Credits
TradingView
PineCoders
CrackingCryptocurrency
MightyZinger
Alex Orekhov (everget)
alexgrover
paragjyoti2012
Moving averages available
1. Exponential Moving Average
2. Simple Moving Average
3. Relative Moving Average
4. Weighted Moving Average
5. Ehlers Dynamic Smoothed Moving Average
6. Double Exponential Moving Average
7. Triple Exponential Moving Average
8. Smoothed Moving Average
9. Hull Moving Average
10. Fractal Adaptive Moving Average
11. Kaufman's Adaptive Moving Average
12. Volatility Adjusted Moving Average
13. Jurik Moving Average
14. Optimized Exponential Moving Average
15. Exponential Hull Moving Average
16. Arnaud Legoux Moving Average
17. Coefficient of Variation Weighted Exponential Moving Average
18. Coefficient of Variation Weighted Moving Average
19. * Ehlrs Modified Fractal Adaptive Moving Average
20. Exponential Triangular Moving Average
21. Least Squares Moving Average
22. RSI Moving average
23. Simple Triangular Moving Average
24. Triple Hull Moving Average
25. Variable Index Dynamic Average
26. Volume-weighted Moving Average
27. Zero-Lag Exponential Moving Average
28. Zero-Lag Simple Moving Average
29. Elastic Volume Weighted Moving Average
30. Tillson T3
31. Geometric Moving Average
32. Welles Wilder Moving Average
33. Adjusted Moving Average
34. Corrective Moving average
35. Exponentially Deviating Moving Average
36. EMA Range
37. Sine-Weighted Moving Average
38. Adaptive Moving Average TABLE
39. Following Adaptive Moving Average
40. Hilbert based Kaufman's Adaptive Moving Average
41. Median
42. * VWAP
43. * Rolling VWAP
44. Triangular Simple Moving Average
45. Triangular Exponential Moving Average
46. Moving Average Price Correlation
47. Regularized Exponential Moving Average
48. Repulsion Moving Average
49. * Symmetrically Weighted Moving Average
* fixed period averages

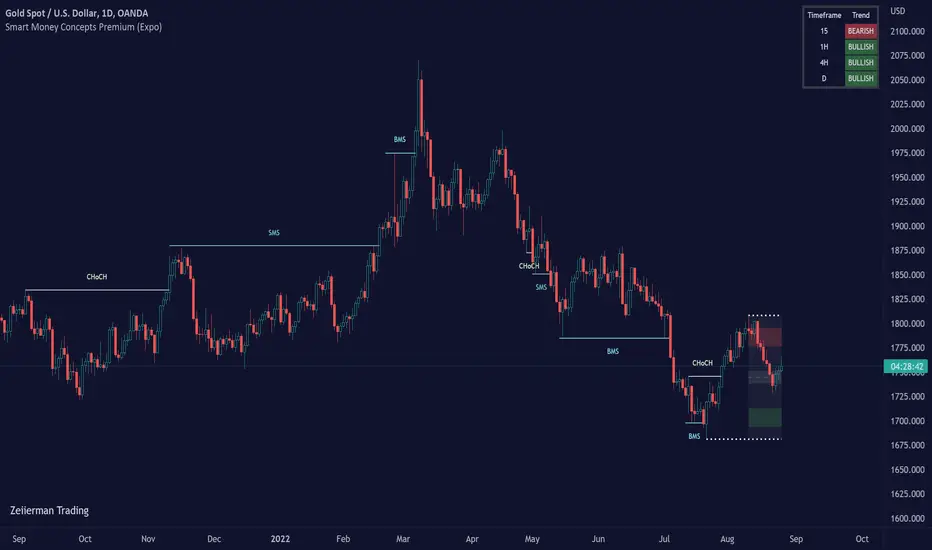
Smart Money Concepts Premium (Expo)Are you a professional Smart Money Concept Trader?
█ This premium version of our SMC indicator includes all advanced Smart Money Concept Trading techniques. The indicator includes all the important concepts such as Market Structure, Change of Character, Current Trading Range, Premium & Discount , Fractals, and Swing Structure. The indicator includes the popular SMC Market Structure Trend to help traders analyze the trend.
In addition to these features, this version adds the following:
Multitimeframe option
Predicted Structure and Range
Backtesting option
External Range Liquidity
Internal Range Liquidity
Liquidity Grab
Fair Value Gap (FVG)
True Fair Value Gap
Imbalance
Order block
Orderflow
Supply & Demand
Equal Highs and Equal Lows
Point of Interest
An alert function that allows you to set any combination of alerts.
This indicator aims to be an all-in-one SMC indicator that helps Smart Money Traders automate their analyzes.
█ HOW TO USE
Use the indicator to trade advanced SMC Trading techniques.
█ Settings
The indicator is fully customized and can be adjusted to fit Swing Trading, Trend Trading, Day Trading, or Scalping.
The indicator works in any market and timeframe.
-----------------
Disclaimer
Copyright by Zeiierman.
The information contained in my Scripts/Indicators/Ideas/Algos/Systems does not constitute financial advice or a solicitation to buy or sell any securities of any type. I will not accept liability for any loss or damage, including without limitation any loss of profit, which may arise directly or indirectly from the use of or reliance on such information.
All investments involve risk, and the past performance of a security, industry, sector, market, financial product, trading strategy, backtest, or individual's trading does not guarantee future results or returns. Investors are fully responsible for any investment decisions they make. Such decisions should be based solely on an evaluation of their financial circumstances, investment objectives, risk tolerance, and liquidity needs.
My Scripts/Indicators/Ideas/Algos/Systems are only for educational purposes!
Script payant
Smart Money Concept (Expo)Are you Trading SMC? - Are you willing to learn how to apply SMC techniques? - Great, this indicator is for you!
█ This Smart Money Concept ( SMC ) indicator is a sophisticated and highly innovative indicator that combines all the necessary features to trade SMC trading techniques. It is built off of Smart Money Concepts inspired by inner trader circle (ICT) teachings. Smart Money is considered the capital allocated by institutional investors, funds, and other larger financial market participants. This indicator takes the Institutional trading behavior and makes it accessible to retail investors. By using an SMC indicator, you get professional insights into the market.
█ This indicator provides you with all of the most important SMC principles in one indicator. Fully automated and real-time Break of Market Structure, Change of Character, Current Trading Range, Premium & Discount , Fractals, and Swing Structure. In addition to the most important features, we have added a highly unique SMC Market Structure Trend based on the market structure principle. A confirmed swing structure trend background enhances the trend feature even more.
Swing Structure
Identifying major market structures with the indicator.
Current Trading Range
The Range feature ensures that traders always know where the current range is and where to find Premium and Discount within that range. In addition, the range is updated in real-time without any delay.
Premium & Discount Zones
Identifying Premium and Discounts zones automatically for you.
Structure break
Break of Market Structure ( BMS ) and Change of Character ( CHoCH ) - are automatically identified and plotted in real-time.
Supply and Demand
Use our Supply/Demand indicator to identify high probabilities trading zones.
█ HOW TO USE
Use the indicator to trade SMC Trading techniques.
Use the indicator to understand the current market structure.
Use the indicator to identify the current range and premium and discount levels.
█ Settings
The Market structure period is fully customized and can be adjusted to fit Swing Trading, Trend Trading, Day Trading, or Scalping.
The indicator works in any market and timeframe.
█ Basic Terminology
S&D - Supply & Demand
S2D - Supply to Demand
D2S - Demand to Supply
OB - Orderblock
AOI - Area of Interest
POI - Point of Interest
LOR - Level of Respect
FLOR - First Level of Respect
IMB - Imbalance
INF - Inefficiency
FVG - Fair Value Gap
IRL - Internal Range Liquidity
ERL - External Range Liquidity
HH - Higher High
HL - Higher Low
LL - Lower Low
LH - Lower High
BOS - Break of Structure
BMS - Break of Market Structure
mBOS - Minor Break of Structure
SMS - Shift in Market Structure
CHoCH - Change of Character
mCHoCH - minor Change of Character
EQH - Equal Highs
EQL - Equal Lows
BSL - Buy Side Liquidity
SSL - Sell Side Liquidity
LQ - Liquidity
EQ - Equilibrium
PA - Price Action
MTF - Multi Timeframe
HTF - Higher Timeframe
LTF - Lower Timeframe
PT - Protrend
CT - Counter trend
OF - Orderflow
EOF - Expectational Orderflow
LOD - Low of the Day
HOD - High of the Day
HOW - High of the Week
LOW - Low of the week
RE - Risk Entry
CE - Confirmation Entry
DCE - Double Confirmation Entry
SL - Stop loss
RR - Risk Reward
BFI - Banks & Financial Institutions
Hedgies - Hedge Funds
-----------------
Disclaimer
Copyright by Zeiierman.
The information contained in my Scripts/Indicators/Ideas/Algos/Systems does not constitute financial advice or a solicitation to buy or sell any securities of any type. I will not accept liability for any loss or damage, including without limitation any loss of profit, which may arise directly or indirectly from the use of or reliance on such information.
All investments involve risk, and the past performance of a security, industry, sector, market, financial product, trading strategy, backtest, or individual's trading does not guarantee future results or returns. Investors are fully responsible for any investment decisions they make. Such decisions should be based solely on an evaluation of their financial circumstances, investment objectives, risk tolerance, and liquidity needs.
My Scripts/Indicators/Ideas/Algos/Systems are only for educational purposes!

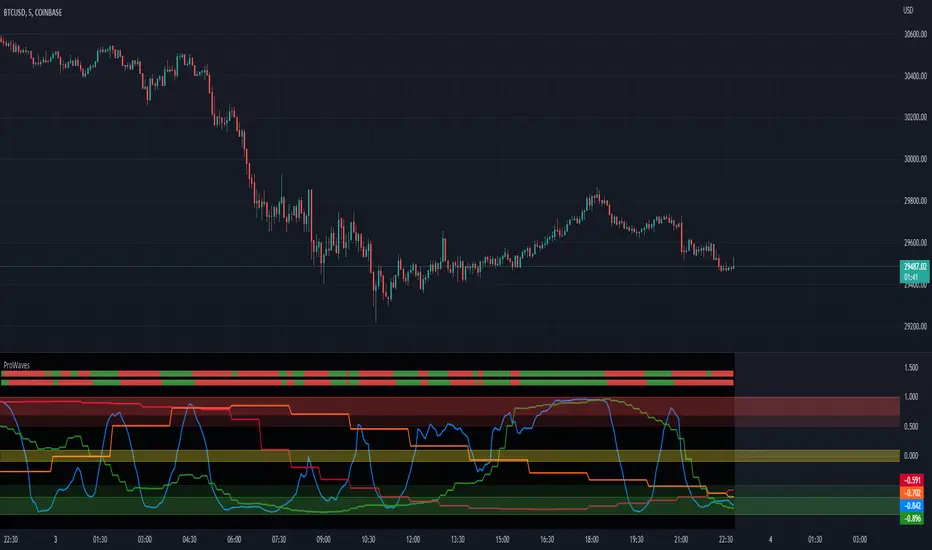
ProWaves - [Soldi]ProWaves
Introducing the latest and greatest tool in the DynaPro Trading Tools! ProWaves is a multi timeframe precision trend tool to help traders identify the waves of the market and trade the convergence, exhaustion points, continuation points of multiple timeframes.
By default you will have a 15m, 1h and 2h Wave on your indicator - this is completely customizable by the user! You can choose up to 3 higher timeframes to display the underlaying wave trend.
How Do I Enter Trades?
To bring ProWaves into a full trading system someone could easily use we have to make a trade trigger system for potential entries - an original and unique Trend Bar system to easily signal a trader that there is an entry present. These trend bars use 2 sensitive weighted moving averages based off the HL2 of the candle, we offset them to create a ribbon like effect to help eliminate any false signals
Include this in your own trading strategy or compile it with DynaPro's other institutional caliber tools!
To use ProWaves effectively you will want to understand wave theory first
This indicator is based off the idea of Elliot wave and fractal cycles of the market, to really understand what this indicator is reading you will need to understand what Elliot Wave is along with fractal cycles in the markets.
What Are The Waves Based On
The waves are primarily a Correlation function to make an oscillated value of "trend", by doing so and measuring this across multiple timeframes we are able to gain a sense of clarity on the tops and bottoms of the markets as well as the trends that take place in between!
NOTE
When the Waves are above/below - 0.5/-0.5 then the wave is in an area of significance for either a reversal or to influence a trend - couple this with the precision of the Trend Bars system then you have a great trading system!
Supply and Demand - Order Block - Energy CandlesSupply and Demand - Order Block - Energy Candles
Description
An experimental script, designed as a visual aid, to highlight the last up or down candle before a fractal break. We can assume these candles where the point of origin that generated enough strength to break recent structure. By using them as reference points, traders are expected to follow their own set of rules and mark higher probability supply and demand zones in the area.
How to use:
Expect a potential retest in these areas, and if they fail, a potential retest in the opposite direction. The greater the number of times a zone is tested, the more likely it is to break. A fresh zone that has not yet been tested will have a higher probability of a bounce.
Fractal period and candle break type can be personalised in settings. Can be used on all timeframes (higher the better).
Indicator in use:
Extras:
An option to flip candle colours if current price is above or below them has been added.

CHOCH - MSB for Supply and DemandChange of Character (CHOCH) - Market Structure Break (MSB) for Supply & Demand
Description
The script is designed as a confirmation entry tool to be used with supply and demand zones (predefined proximal and distal levels).
When price hits a predefined level it will monitor price action using fractals and an algorithm to determine a potential reversal in trend or change of trend direction.
Once this has been identified you will be alerted in order to anticipate a retracement entry. A good understanding of supply and demand concepts, odds enhancers, and how to identify fresh levels is expected to utilise it's full potential.
Indicator in use
How To Use
Apply one indicator on a higher timeframe, and another on a lower timeframe. In settings, select long for a demand zone and short for a supply zone. Use the higher timeframe to plot major supply and demand zones and a lower timeframe of your choice for the alert. You can refine your levels by manually entering the price levels in settings. The alert is set on the timeframe you set it on.
Manual Selection
Check "override custom levels" and manually enter the price levels of your proximal and distal lines. Input the time and date of your pivot point (candle). Manual selection is recommended as you can refine your zones.
Automatic Selection
Drag and drop the pivot on the candle of choice . The pivot point will mark the zone using the candle's high and low (default setting). Source for top and bottom levels can be changed in settings.
Start Control after X Bar
This defines how many bars is required (from your pivot point) before it sets to anticipate a breach.

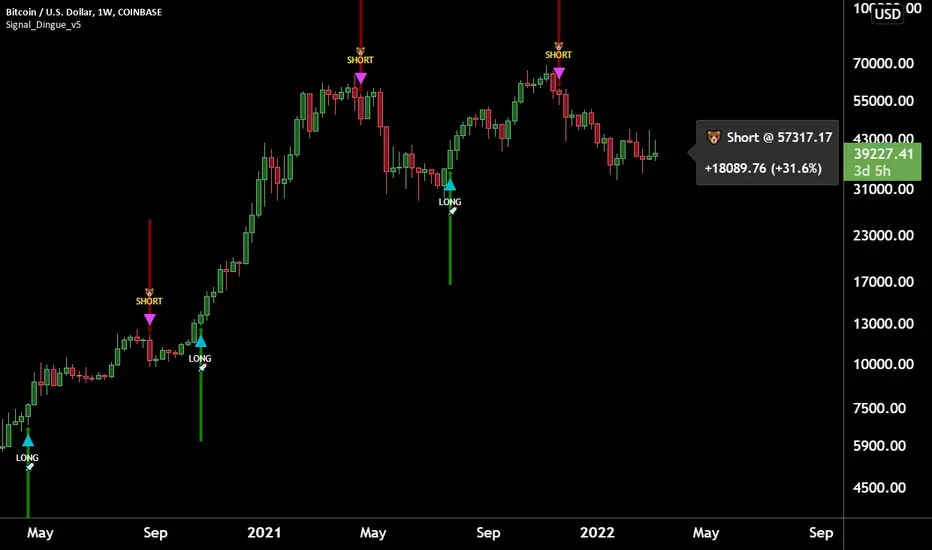
Trading Assistant DiNGUETrading Assistant DiNGUE This indicator is like a trading assistant for your charts.
It helps set your biases and emotions aside and lets you focus on managing trades in an easy visual way.
Get various types of signals to enter your trades (either Long or Short). Then use take profits, stops, or the opposite signal to exit trades.
The signals are created from various indicators and sensibility options you can customize any way you want. Works on every timeframe.
You can customize every setting or used the preset ones. Preset settings adjust automatically based on the timeframe you are using on the chart.
The 12 Indicators are Volume - RSI - Stochastic - MacD - Moving Averages (MA) - Rate of Change (ROC) - ADX DMI Directional Movement Index - On Balance Volume (OBV) - Bollinger Bands - VWAP - ATR - Parabolic SAR.
Every indicator can be turned On or Off.
You can adjust the way it creates signals by selecting either 'rise-fall', 'crosses' or by combining both.
You can select the sensitivity of the signal from Normal - Safe - Safer.
You can adjust lengths or use the preset ones.
There are also additional options for each indicator, you can filter weak levels for ADX, filter for tight bands, have ROC above 0…
You can also plot several of those indicators on the screen. 2x Moving Averages, 2x VWAP, 2x ATR, 2x SAR for even easier visualization of the trend.
You can also plot fractals to facilitate once again on trend visualization. Higher high, lower low, higher low, lower high.
Trade with the Trend and Safe Trades:
If you want to have a higher chance of success, you can trade with the trend. First, select the trend timeframe you would like to use. Let's say the “Weekly” trend. Meaning it will generate a signal on the weekly timeframe and based on the result (Long or Short) it will only take trades in that direction. So the trend is LONG on the Weekly and you get a “Long” signal, it will take it. “Short” signals on the other hand will be treated as “stops” and won’t want to go against the trend by going ‘short’.
Safe Trend works in the same manner, but instead of using the signal on a bigger timeframe, it uses an indicator as to the deciding factor. Let's say you select the 200SMA as the “Safe signal”. The indicator will only go “Long” when above the 200SMA and “Short” under the 200SMA. Otherwise, it will put a stop instead of going against the trend.
Stop Loss:
There are 4 different types of stop-loss that you can use at the same time.
- Indicator Stop
- Fib stop
- Fix % stop
- Trailing stop
You can plot the stops directly on the chart AND OR add them to the panel for an easy visualization once again.
With the ‘indicator stop’, you can select one of the two: MA ATR SAR VWAP as a stop.
Fib stop, it uses fib numbers to calculate a stopping point.
Fix %, you can select your max loss in percent. Could be 2%, 5%
A trailing stop is like a fixed stop but that will trail as the price moves in the right direction.
Take Profit:
There are 4 different types of take profit that you can use simultaneously.
- Fix % Take Profit
- ATR multiple Take Profit
- Fib multiple Take Profit
- Bollinger Band Take Profit
Fix % just let you set a fix take profit target in percent.
ATR multiple lets you select a target based on a multiple of the average true range.
Fib multiple lets you select a target based on a fib multiple
Bolling Band lets you take profit based on the Bollinger band settings you select.
Visual Panel:
The visual panel lets you see exactly how is the last trade progressing. It will give you the entry price, profit, stop, and target. You can turn it on or off, as is for the stop and target.
You can also decide to plot 1 position or more, you can even show all the possible signals, add backgrounds with colors. You can also plot the bigger Trend and Safe Signals explained above.
If you have any questions, suggestions, or comments, feel free to do so!
Fx Crusher Scalping Indicator V1█ OVERVIEW
Scalping Indicator with Buy and Sell Signals for the 15 min and 5 min Chart. Works on all assets (Crypto, Forex, Stocks, Indices, Commodities and Metals)
Only use in trending markets. Signals in a ranging market are useless.
This Scalping Indicator is different from others because most of the Buy/ Sell signals actually make sense. No counter trend trading and most signals can be very profitable when used right.The single most important goal was to have an indicator that shows signals with a big possible risk reward ratio. Most false signals are filtered out. The Fx Crusher Scalping Indicator is not perfect but it is amazing. You can customize the indicator to get the highest signal quality.
█ HOW DOES IT WORK?
The indicator determines the trend direction by using 3 different smoothed moving averages. A green background shows an uptrend and a red background shows a downtrend.
The strength of the trend is determined by the slope of the individual SMMAs. You can set the slope of every single SMMA for buys and sells individually.
The indicator only shows signals when there is a clear trend on the current timeframe.
Entry signals are generated by a combination of Williams fractals, SMMA crossover, trend angle and RSI condition.
█ HOW TO USE?
Draw Support & Resistance lines on the 4H Chart
Determine the overall trend on the 1H Timeframe
Go to the 15 min or 5 min Time Frame and have a look at the signals
Adjust the slope of every single SMMA in 0.01 steps until the signals look good
Adjust the RSI settings for overbought and oversold condition if necessary
Only enter a trade after the candle that prints a signal is closed.
Only take buy positions when all SMMAs are going up and don’t touch each other
Only take sell positions when all SMMAs are going down and don’t touch each other
Only use this Scalping Indicator with proper Risk management and a risk reward ratio of around 1:2.
Trail your stop to get the most pips out of the signals. Very often the indicator shows signals right before major moves.
█ ADDITIONAL INFO
Be careful with buy signals when the market on the higher timeframe (4H and 1H) is in a downtrend and vice versa.
You can make the most profit out of this Indicator when you enter with 2 positions. A quick scalp and a runner. Because there's a lot of signals with huge risk reward ratios but also some unprofitable signals . Therefore make sure you make the best out of the good signals and apply proper risk management to limit losses with bad signals. Stop loss placement according to market structure.
Multiple Signals in a row can show a high probability of a very strong upcoming move. Monitor your trades and secure partials to make the best out of it.
You can select how many signals it is going to show once trend conditions are met. Please be aware that the longer a trend goes, the higher is the probability of a reversal. Therefore the first few signals after all conditions are met are most likely the most profitable.
By setting the slope of the slow SMMA correctly you can filter out most signals in a ranging market.
█ DISCLAIMER
This is not financial advice. I do everything I can to provide the most accurate buy and sell signals for scalping but past results are no guarantee for future performance.

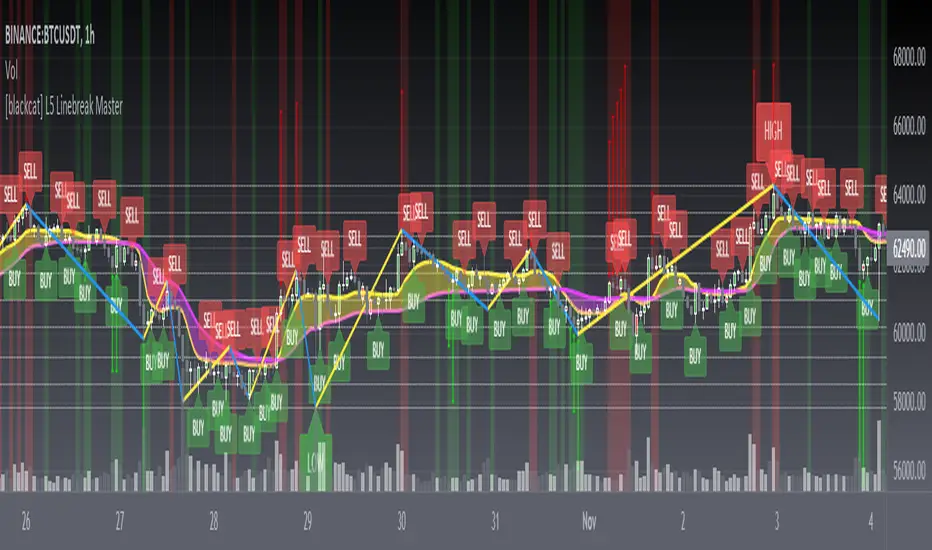
[blackcat] L5 Linebreak MasterLevel: 5
Background
Like many people in the Tradingview community, I have been studying how to apply Line Break Chart to backtesting and live trading for long. However, as we all know, the official Tradingview Line Break Chart is not recommended for backtesting because it will lead to unrealistic backtesting results. So, I thought about developing a Line Break Chart that can be used for backtesting and trading. This "L5 Linebreak Master" is one of them that I am introducing today.
This indicator is based on OHLC data, because this kind of chart can be used for reliable backtesting and live trading in Tradingview. Therefore, the Linebreak Master in this script can actually coexist with the standard Japanese candlestick chart, but the trend reversal information it prompts is based on a principle similar to Line Break Chart. When the two can coexist and produce trading signals at the same time, this is really a very interesting invention.
Function
Linebreak charts were developed in Japan and popularized here by Steve Nisson in his book Beyond Candlesticks. The purpose of linebreak charts is to filter out market noise and give a clear indication of the current trend and trend reversals. As you may know, sometimes determining the current trend can be difficult due to market price movement that consolidates, and a trend reversal can be just as difficult. The green and red bars are called lines. Notice that whenever we have consecutive green lines, each line has a higher close than the previous one; when we have consecutive red lines each line has a lower close than the previous line.
First of all, this Linebreak chart can coexist in the main chart with the Japanese candlestick chart. However, many parts may be overlapped with Japanese candle stick to see it clearly. My recommendation is that users can click "Settings" of main chart and turn off default candle chart.
Secondly, this Linebreak chart can be used for backtesting strategies, because it is essentially OHLC data. And the absolute values of the price is based on the original OHLC data. The certainty of the trend reversal is relatively high. It can be compared with Japanese candlesticks on the timeline.
Finally, this Linebreak chart is embedded with a Linebreak intrinsic trading strategy, which can be used to locate entry points through red and green labels. This strategy supports Tradingview alerts. You can get "LONG" or "SHORT" trading reminders by creating alerts. In order to obtain a clear market structure, Zen Stroke (Autolength ZigZag ), Zen Kiss (Special Moving Averages), Fibnacci Retracement Golden Levels, Unique Fibnacci Time windows and Dynamic Fibonicci support and resistance arrows can be checked to be superimposed and displayed on the main chart to facilitate understanding of the temporal and spatial position of prices in the market.
A trading system based on linebreak charts must must have all entries and exits based on the close or open of a line. The two key values of a linebreak chart are the linebreak number and the underlying time interval. We can construct linebreak charts based on daily, weekly, 5 minute, hourly, any time frame. This allows us to adapt it for day trading or swing trading systems. I developped an inheret linebreak strategy with labels facilitate you to locate trend reversals.
Indicator Set
Linebreak Master Chart (新价图)
Zen Stroke (Auto ZigZag , 自动画缠论笔)
Zen Kiss Moving Averages (缠论均线)
Fibnacci Retracement Golden Levels (半对数-黄金分割线)
Unique Fibnacci Time windows (独创的斐波那契时间窗口)
Dynamic Fibonicci support and resistance arrows (动态斐波那契支撑和阻力箭头)
Inputs
Source Type: Open, High, Low, Close, Hl2, Hlc3, Lx, Vwapc, Vwaplx, Vwaphl2 (Case Sensitive)
Returns source input selection variant, default to "Close" if blank or typo.
Open --> open
High --> High
Low --> Low
Close --> Close
Hl2 --> hl2
Hlc3 --> hlc3
Lx --> Lao Xu 1949 Median Price
Vwapc --> vwap based on close
Vwaplx --> vwap based on Lao Xu 1949 Median Price
Vwaphl2 --> vwap based on hl2
Show Zen Stroke --> True as default
Show Fib Space based on Semi-LOG --> True as default
Zen Fractals Lookback Period --> 377 as default
Key Signal
Bars
Green bars for up trend
Red bars for down trend
Labels
Green labels for buy/long.
Red labels for sell/short.
Zen Stroke ( ZigZag )
Green line section for up stroke
Red line section for down stroke
Moving Averages
Yellow for fast line
Fuchsia for slow line
Pros and Cons
Suitable for discretionary trading and bots via alerts. However, only well selected trading pair and time frame can guarantee bot works.
Intuitive and effective, the output signal is more reliable after multi-indicator resonance
Remarks
My fourth L5 indicator published
Closed-source
Invite-only
How to get it?
500 Tradingview Coins Per Monthly Subscription
5000 Tradingview Coins Per Yearly Subscription
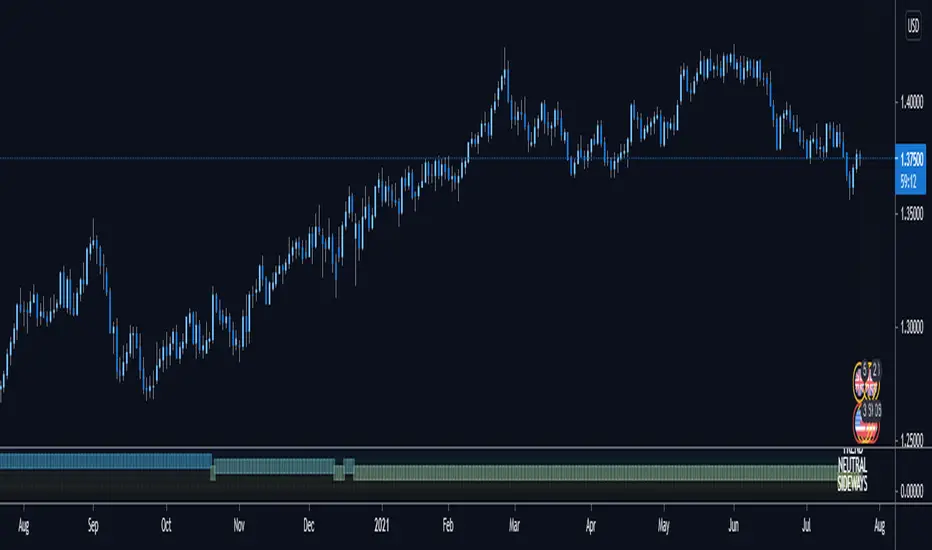
Anticipated Market TypeDisplays the anticipated market type based on the last 300 bars of data:
Trending Market: High probability that the next bar will be in the same direction as previous. Best conditions for a trend trading strategy
Neutral Market: High probability that price is random - the next bar direction is a coin toss. Many "typical" indicators fail in a random market
Sideways Market: High probability that price is autoregressive and the next bar direction is opposite the previous - compressed markets often have sudden fast breakouts
This tool does not give you entries and exits, but assists in deciding to use a Trend-following or Mean-reverting strategy.
Blue (3.5-6) indicates a trending market.
Yellow (0-2.5) indicates a sideways market.
Green (2.5-3.5) indicates a random market
This algorithm tells you when it breaks down by indicating a Neutral/Random market.
In short, it can't say the market type and advises you to not trade or simply use another tool in the meantime.
I personally use this tool to configure my trading robots on a weekly basis. I combine manual TA and stats algos to
try and determine what type of market the next week holds, with a fair bit of success.
The algorithms incorporated are Market Meanness Index (which I've made Open Source) and Fractal Dimension , a significantly faster algo than the MMI, but using a different set of maths.
Cheers!
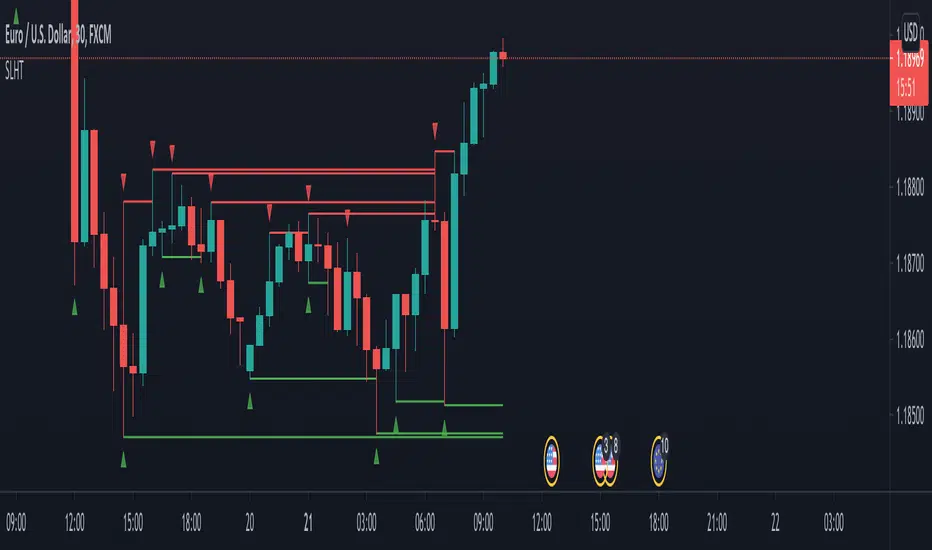
SL Hunter Tracker SL Hunter Tracker
coded by Bogdan Vaida
SL Hunter Tracker is a meticulous hunter that tracks SL hunters.
First it plots the fractals on the chart, then it draws lines from them
to the last wick that touched that height. You can add sweep alerts, once
per bar close, so that you get notified when a wick was touched.
Tested on: EURUSD 30'