Recherche dans les scripts pour "Fractal"


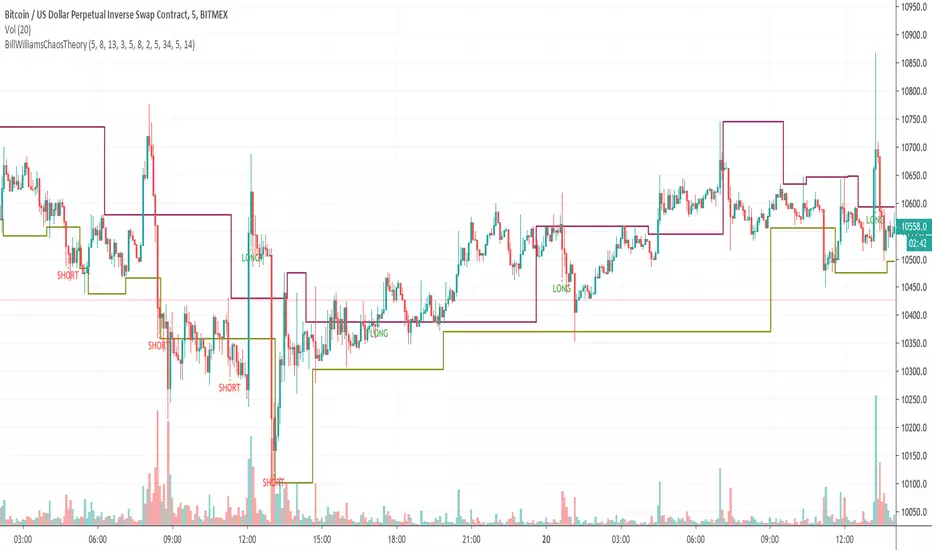
Bill Williams Chaos TheoryBill Williams Chaos Theory
- Alligator
- Fractals
- Accelerator Decelerator Oscillator
- Market Facilitation Index
Combining all of that to generate signal long or short.
Long entry when long signal appears.
Short entry when short signal appears.
For donations
BTC: 3E7rUPX7upS8iTj42JdLt7keJVbJLfvMoH
ETH: 0x094ed88e4c5a9b225e936586cbc2d61f4a027f68
Thank you & happy trading!
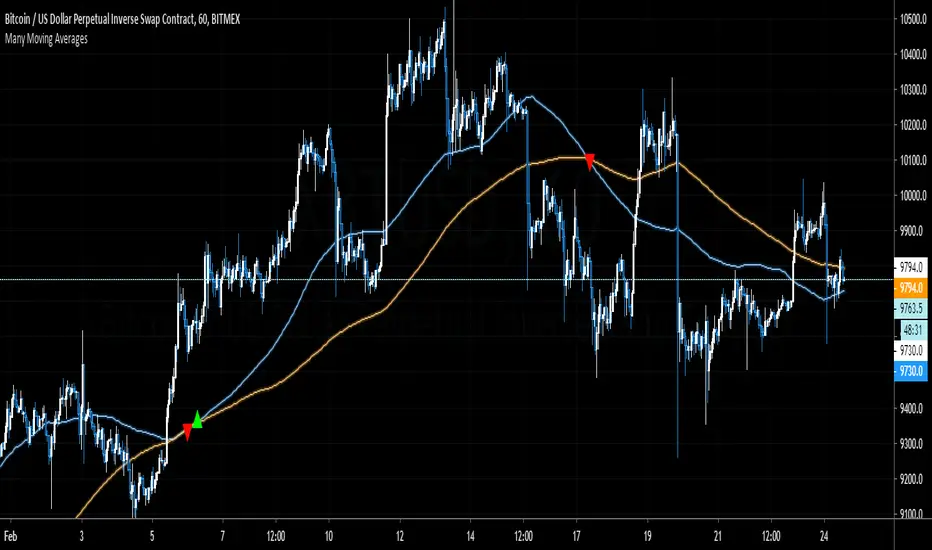
Many Moving AveragesThis script allows you to add two moving averages to a chart, where the type of moving average can be chosen from a collection of 15 different moving average algorithms. Each moving average can also have different lengths and crossovers/unders can be displayed and alerted on.
The supported moving average types are:
Simple Moving Average ( SMA )
Exponential Moving Average ( EMA )
Double Exponential Moving Average ( DEMA )
Triple Exponential Moving Average ( TEMA )
Weighted Moving Average ( WMA )
Volume Weighted Moving Average ( VWMA )
Smoothed Moving Average ( SMMA )
Hull Moving Average ( HMA )
Least Square Moving Average/Linear Regression ( LSMA )
Arnaud Legoux Moving Average ( ALMA )
Jurik Moving Average ( JMA )
Volatility Adjusted Moving Average ( VAMA )
Fractal Adaptive Moving Average ( FRAMA )
Zero-Lag Exponential Moving Average ( ZLEMA )
Kauman Adaptive Moving Average ( KAMA )
Many of the moving average algorithms were taken from other peoples' scripts. I'd like to thank the authors for making their code available.
JayRogers
Alex Orekhov (everget)
Alex Orekhov (everget)
Joris Duyck (JD)
nemozny
Shizaru
KobySK
Jurik Research and Consulting for inventing the JMA.
Very easy scalping indicator for non skilled traderThunderScalp is bundled indicator for scalping trader with simple usage and high winning rate. It works for any time frame.
The indicators are:
Humidity Pole Signal is Buy or Sell signal based on Humidity indicator or volume consolidation mapping
Interactive Signal is Buy or Sell signal based on Chart Pattern analyzer
Pivot Support and Resistance is candle support and resistance up to 3 layer for each
Fractal Support and resistance is support and resistance based on fractal candles
Scalping MA is moving average lines which best suite for scalping

MA-EMA-BB - NakajimaSome MA and EMA that you can hide/show
Bollinger Bands
Ichimoku
Fibonacci
Fractals

Pullback SP-Strategy#9This is my interpretation of Steven Primo's pull back strategy indicator # 9. Seems to work on any time frame or combination high and low. I prefer to use it with the regular fractals and a 20 or 50 SMA and 5 period RSI. I would prefer to have it only paint up arrows when bars close above the SMA and vise versa with down arrows. If someone can help me correct that please contact me.
Thanks, 1776er.

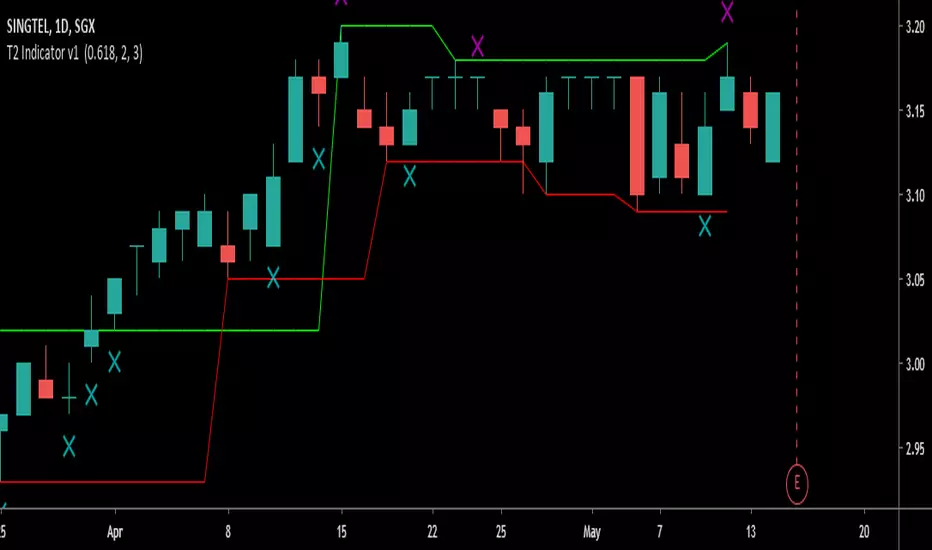
Trend Tracking Indicator v1The Purpose of this Script is to help the user track the trend by
1) Defining clearly Entry and Exit levels
2) Profit Protection Levels
3) Stay in a trend as long as possible
It automatically draws and updates the boxes dynamically as the trend progresses in Stair Stepping Behaviour in uptrend or downtrend
a) Darvas Box (5 Bar System)
b) Fractal Boxes (5 bar System)
There is a switch at the indicator interface for user to choose between Fractal or Darvas boxes to better represent the stock/Crypto/Commodity/Forex
pair the user is trading.
In the event that the trend gears up and runs up in a parabolic behaviour
Alternate Profit Protection Levels based on 2 Bar System is there to provide an alternative to tracking the trend and protecting profits.
In general being a price action indicator, it can apply to any assets or timeframe.
by Crypto DanX.
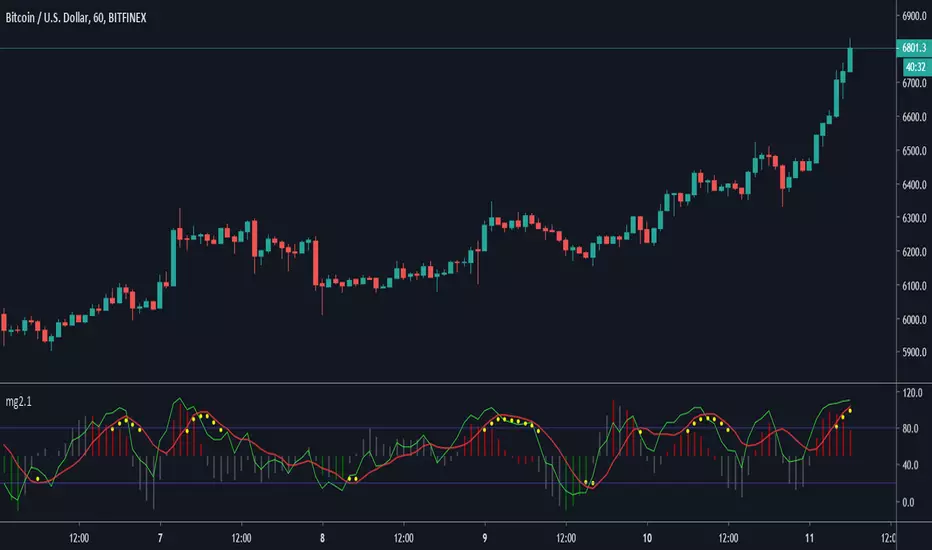
Minimal Godmode 2.1// Acknowledgments:
// Original Godmode Authors:
// @Legion, @LazyBear, @Ni6HTH4wK, @xSilas
// Drop a line if you use or modify this code.
// Godmode 3.1.4: @SNOW_CITY
// Godmode 3.2: @sco77m4r7in and @oh92
// Godmode3.2+LSMA: @scilentor
// Godmode 4.0.0-4.0.1: @chrysopoetics
// Jurik Moving Average: @everget
// Constance Brown Composite Index RSI: @LazyBear
// Wavetrend Oscillator: @fskrypt
// TTM Squeeze: @Greeny
// True TSI/RSI: @cI8DH and @chrysopoetics
// Laguerre RSI (Self-Adjusting Alpha with Fractals Energy): @everget
// RSI Shaded: @mortdiggiddy
// Minimal Godmode v2.0:
// 6 BTC pairs/exchanges (instead of 11) to reduce loading time from the pinescript security() function
// Volume Composite for engine calculation
// TTM Squeeze on Wavetrend Signal
// Constance Brown Composite Index RSI (CBCI)
// TrueTSI (Godmode 4.0.0 implementation)
// Laguerre RSI (LRSI)
// Minimal Godmode v2.1:
// Removed TTM Squeeze and Volume Composite
// EMA for Wavetrend Signal
// Multi-exchange for BTC no longer the default
// mg engine toggle for CBCI, Laguerre RSI, and TTSI
// Wavetrend Histogram component toggle
UMMLMurray math with options to calculate wicks for readjusting of "Frame" ,mtf support to select desired period lines without switching time frames, Fractal and mtf fractal support ,option to keep just extreme deviations, UMML expands and contracts differently than similar scripts in volatile periods and are easily configurable by users for size,style and reactivity of lines
previous version hosted in link below
The Grid
indicator isnt finished yet as smoothening for line expansion and contractions is still being worked on alongside function to average the lines for short-median-long tf in MTF grid mode
Trading ChaosДанный советник создан по мативам бессмертного произведения Билла Вильямса. Для определения наилучшей точки в хода в начале разворотного движения рекомендуется использовать с индикатором "MFI" "Williams Fractals" и "Volume".

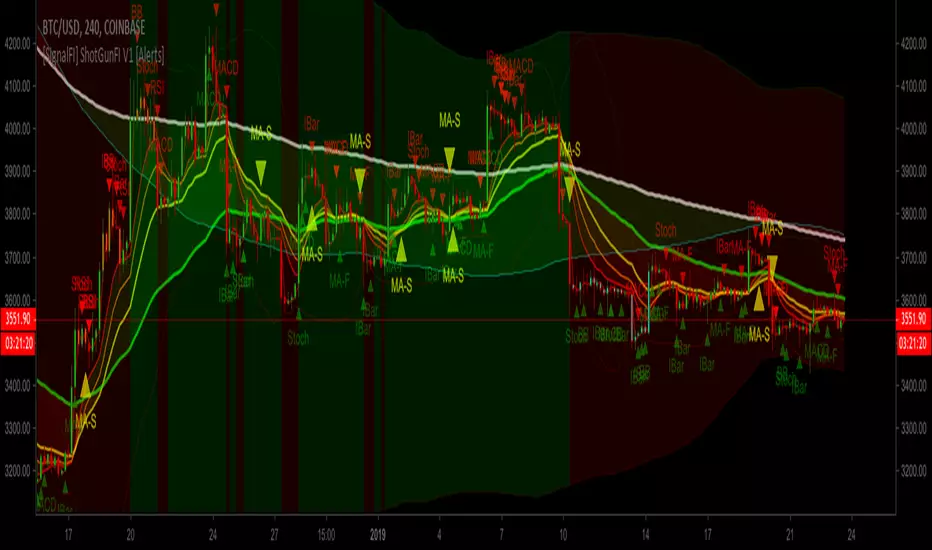
[SignalFI] ShotGunFI V1Welcome to ShotGunFI
In order to help give our members awareness of how major indicators move market price action, we created ShotGunFI. This script provides signals for the following indicators and gives a customizable framework for the user to track how certain indicators impact price and further how those impacts could relate to their overall strategy. We took the major indicators that are used in the market and smashed them into one chart with one indicator so that you can visualize a broad spectrum of strategies that are already driving price action.
This script is enabled with Data Leak and Repaint protection by default. Ensuring that signals are true.
The following indicators are included:
//+RSI Ob/Os Crossover Signals
- Candles are colored Orange and Aqua when RSI is overbought or oversold.
- Arrows and Alerts for crossover 30 and crossunder 70 RSI .
//+Slow Stochastic Signals
- Arrows and Alerts for crossover 20 and crossunder 80 Stoch RSI
//+MACD Bull/Bear Signals
- Arrows and Alerts for MACD Bull and Bear Signal line crossovers
//+MA Cross Bull/Bear Signals
- Arrows and Alerts for MA 1 Cross of MA 1 and MA 1 Cross of MA 4.
By default EMA is enabled, however, we included several other MA types to enhance and expand on this concept.
Included are the following MA types:
Kaufman Adaptive Moving Average ( KAMA )
Hull Moving Average
Smoothed Moving Average
Variable Index Dynamic Average
Fractal Adaptive Moving Average
Fractal Dimension Adaptive Moving Average
Double Exponential Moving Average
Least Squares Moving Average
Coefficient of Variation Weighted Moving Average
Simple Weighted Moving Average
Exponential Moving Average
Weighted Moving Average
Arnaud Legoux Moving Average
Option Types Labels:
"SWMA", "EMA", "WMA", "SMA", "HMA", "KAMA", "SMMA", "VIDYA", "VWMA", "ALMA", "FRAMA", "DEMA", "FDAMA", "LSMA", "COVWMA"
//+BollingBand Bull/Bear Signals
- Arrows and Alerts for lower BB crossover and higher BB crossover
//+Bollinger Band + RSI (BBRSI) Bull/Bear Signals
- Arrows and Alerts for custom higher timeframe Bollinger Band that integrates RSI . 4 Signals total.
//+InsideBar Bull/Bear Signals
- Arrows and Alerts for InsideBar bull/bear break combinations.
ALERTS DISABLED VERSION. Padaone Members Only.
SignalFI was created to help traders and investors to effectively analyze the market based on the Golden Mean Ratio (Fibonacci numbers), plan a trade and ultimately execute it. To help inform and educate market decisions we developed a set of Trading Indicators which are available on TradingView , the most advanced and yet easy to use charting platform available on the web.
SignalFI indicators are just that, indicators. Our indicators are generally configured to use completely historical data (negating repaint), and we advise all alerts created with SignalFI indicators to be fired upon "close" of the current candle. Our indicators can provide valuable context and visualization support when performing market analysis and executing buy and sell decisions. However. we are not financial experts, and all information presented on this site or our other media outlets are for educational purposes only.
For subscription information, visit www.signalfi.net and follow us on twitter.

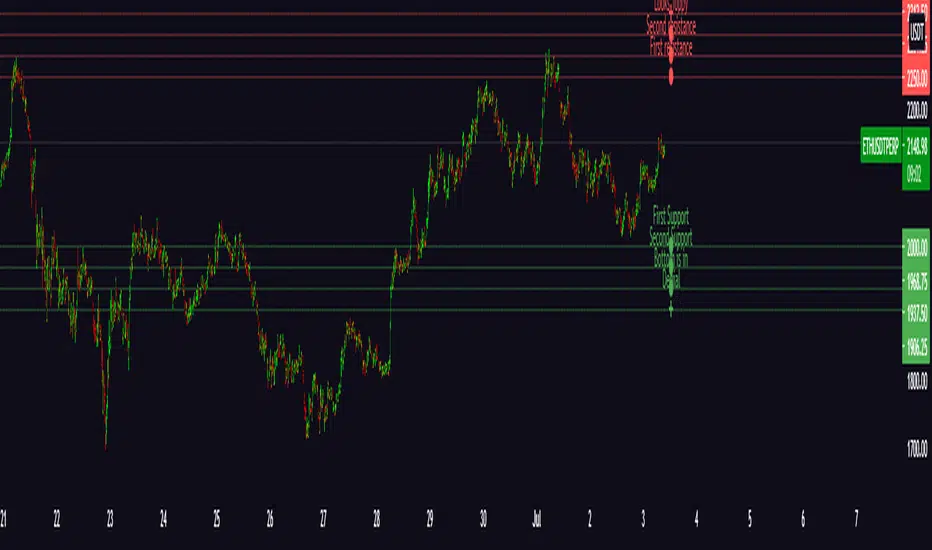
[SignalFI] ShotGunFI V1 [Alerts]Welcome to ShotGunFI
In order to help give our members awareness of how major indicators move market price action, we created ShotGunFI. This script provides signals for the following indicators and gives a customizable framework for the user to track how certain indicators impact price and further how those impacts could relate to their overall strategy. We took the major indicators that are used in the market and smashed them into one chart with one indicator so that you can visualize a broad spectrum of strategies that are already driving price action.
This script is enabled with Data Leak and Repaint protection by default. Ensuring that signals are true.
The following indicators are included:
//+RSI Ob/Os Crossover Signals
- Candles are colored Orange and Aqua when RSI is overbought or oversold.
- Arrows and Alerts for crossover 30 and crossunder 70 RSI.
//+Slow Stochastic Signals
- Arrows and Alerts for crossover 20 and crossunder 80 Stoch RSI
//+MACD Bull/Bear Signals
- Arrows and Alerts for MACD Bull and Bear Signal line crossovers
//+MA Cross Bull/Bear Signals
- Arrows and Alerts for MA 1 Cross of MA 1 and MA 1 Cross of MA 4.
By default EMA is enabled, however, we included several other MA types to enhance and expand on this concept.
Included are the following MA types:
Kaufman Adaptive Moving Average ( KAMA )
Hull Moving Average
Smoothed Moving Average
Variable Index Dynamic Average
Fractal Adaptive Moving Average
Fractal Dimension Adaptive Moving Average
Double Exponential Moving Average
Least Squares Moving Average
Coefficient of Variation Weighted Moving Average
Simple Weighted Moving Average
Exponential Moving Average
Weighted Moving Average
Arnaud Legoux Moving Average
Option Types Labels:
"SWMA", "EMA", "WMA", "SMA", "HMA", "KAMA", "SMMA", "VIDYA", "VWMA", "ALMA", "FRAMA", "DEMA", "FDAMA", "LSMA", "COVWMA"
//+BollingBand Bull/Bear Signals
- Arrows and Alerts for lower BB crossover and higher BB crossover
//+Bollinger Band + RSI (BBRSI) Bull/Bear Signals
- Arrows and Alerts for custom higher timeframe Bollinger Band that integrates RSI. 4 Signals total.
//+InsideBar Bull/Bear Signals
- Arrows and Alerts for InsideBar bull/bear break combinations.
ALERTS VERSION Only for Jedi and Master Subscribers
SignalFI was created to help traders and investors to effectively analyze the market based on the Golden Mean Ratio (Fibonacci numbers), plan a trade and ultimately execute it. To help inform and educate market decisions we developed a set of Trading Indicators which are available on TradingView , the most advanced and yet easy to use charting platform available on the web.
SignalFI indicators are just that, indicators. Our indicators are generally configured to use completely historical data (negating repaint), and we advise all alerts created with SignalFI indicators to be fired upon "close" of the current candle. Our indicators can provide valuable context and visualization support when performing market analysis and executing buy and sell decisions. However. we are not financial experts, and all information presented on this site or our other media outlets are for educational purposes only.
For subscription information, visit www.signalfi.net and follow us on twitter.
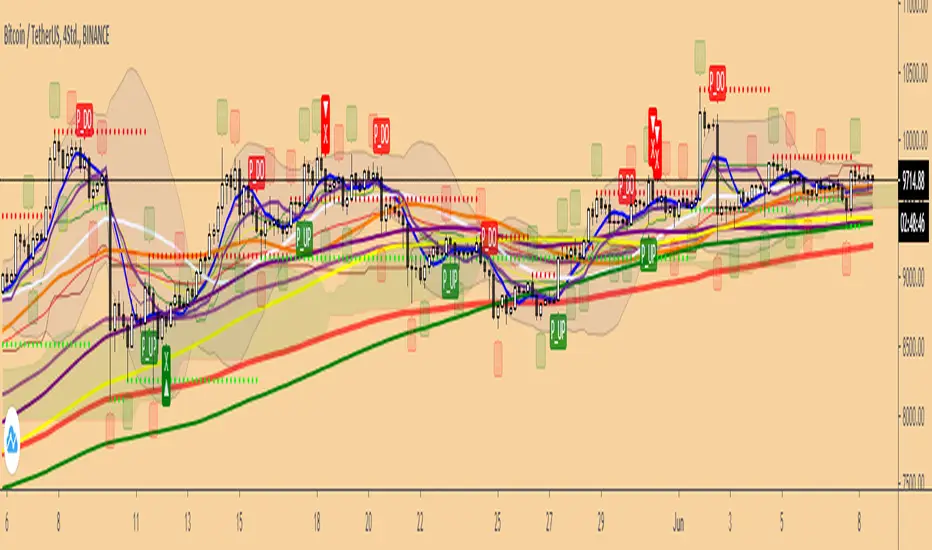
[SignalFI] PhilakOne ExtremeWelcome,
This script is provided for free as a support system for the trading strategy developed by Philakone (@philakonecrypto).
Phil has been providing immense support to the trading community through consistent education, and thats why we decided to adapt and automate his system so that everyone can follow.
Key Features
1. Moving Averages
By default fibonacci based EMA moving averages are included with the script set at:
- MA 1 = 8
- MA 2 = 13
- MA 3 = 21
- MA4 = 55
We also added green and red fill colors to show the current status of each MA with respect to the other MA's.
By default Phil uses EMA, however, we included several other MA types to enhance and expand on this concept. Included are the following MA types:
Kaufman Adaptive Moving Average(KAMA)
Hull Moving Average
Smoothed Moving Average
Variable Index Dynamic Average
Fractal Adaptive Moving Average
Fractal Dimension Adaptive Moving Average
Double Exponential Moving Average
Least Squares Moving Average
Coefficient of Variation Weighted Moving Average
Simple Weighted Moving Average
Exponential Moving Average
Weighted Moving Average
Arnaud Legoux Moving Average
Option Types Labels:
"SWMA", "EMA", "WMA", "SMA", "HMA", "KAMA", "SMMA", "VIDYA", "VWMA", "ALMA", "FRAMA", "DEMA", "FDAMA", "LSMA", "COVWMA"
2. RSI
Phil relies on simple RSI to determine the relative strength of a trend. To display this easily we added bar coloring that matches overbought and oversold situations.
Red Bars = RSI > 70
Green Bars = RSI < 30
3. MACD
Phil also uses MACD to determine the trend. To display this easily we added signals above and below bars to show crossovers between the MACD and the MACD Signal line.
Small Green Triangle UP = MACD bull cross
Small Red Triangle DOWN = MACD bear cross
4. Alerts
We know that everyone can't watch charts all day, so we configured this script with full alerting for each of the components above.
1. Moving Average Bull Cross
2. Moving Average Bear Cross
3. RSI Overbought Cross
4. RSI Oversold Cross
5. MACD Bull Cross
6. MACD Bear Cross
Thanks to Phil for the inspiration and continued community education.
We hope you enjoy!
General Information
SignalFI was created to help traders and investors to effectively analyze the market based on the Golden Mean Ratio (Fibonacci numbers), plan a trade and ultimately execute it. To help inform and educate market decisions we developed a set of Trading Indicators which are available on TradingView , the most advanced and yet easy to use charting platform available on the web.
SignalFI indicators are just that, indicators. Our indicators are generally configured to use completely historical data (negating repaint), and we advise all alerts created with SignalFI indicators to be fired upon "close" of the current candle. Our indicators can provide valuable context and visualization support when performing market analysis and executing buy and sell decisions. However. we are not financial experts, and all information presented on this site or our other media outlets are for educational purposes only.
For subscription information, visit www.signalfi.net and follow us on twitter.

PpSignal The Ultimate Moving Average Crossover 3.0 (CFB)CFB tells you how long the market has been in a quality trend. This value can be used to adjust the period length of other indicators, especially stochastic bands.In order to quantify the overall duration of a market's trend, we replaced classical cycle analysis methods (FFT, MEM, MESA) with a form of analysis that works even when no cycles exist. We accomplished this by examining a time series for specific fractal patterns of any size. We then gather all the patterns found and combine them into one overall index, CFB (Composite Fractal Behavior) Index.For good reason, CFB does not analyze time series data for dominant cycles. Classical cycle analysis examines data points (e.g. prices) and estimates the average presence of a cycle in the window. Now suppose a cycle with a period length of 9 days was strong for 50 days and then disappeared for the next 21 days

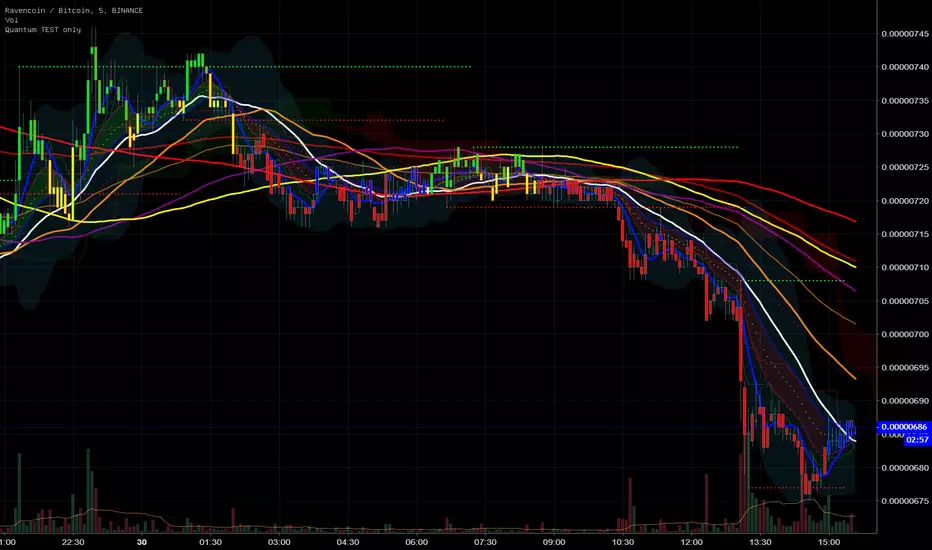
Quantum all in one Crypto indicator V1Quantum all in one Crypto indicator V1
Features:
Bollinger
Ichimoku
6 EMA
6 MA + Fast & Slow
CDC Strategy
Fractals
Pivots
.. and more
V 1.5 in progress
enjoy
Quantum All in One Crypto Indicator V1Quantum All in One Crypto Indicator V1
Features
6 EMA
6 MA + Slow & Fast
Ichimoku
Bollinger
Fractals
CDC Strategy
Colored Bars
Pivot´s and more..
have fun
Version V1.5 in Progress
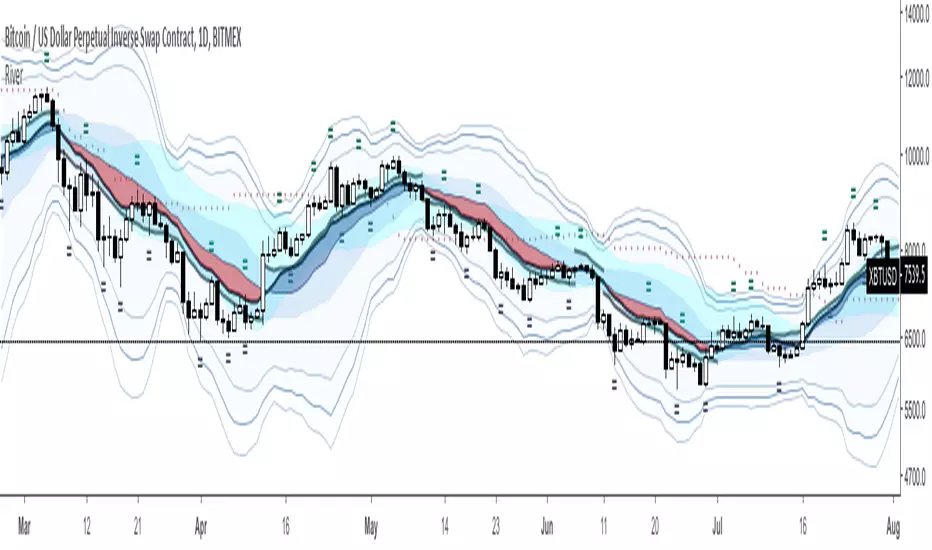
River Scalping (Fibonacci, Pivots, VWMA, BB, EMA)Pictured as a Scalping Indicator, it shines best on the H4 and specially on the D1.
A combination of too many Fibonacci progressions, Pivots, VWMA , EMA's, BB, Stochastic RSI, the Kijun (Doubled Ichimoku Cloud ), William's Fractals ('=') and too many Standard Deviations.
Simple Strategy :
Center Blue: Long
Center Red: Short
The river can unveil the market's momentum and its strength.
Don't only use the simple strategy, there is much more if you decide to fall down the rabbit hole.
Suggestions are, as always, more than welcomed,
Have fun out there and stay safe.
Please be advised, this indicator will only be free for a limited time.
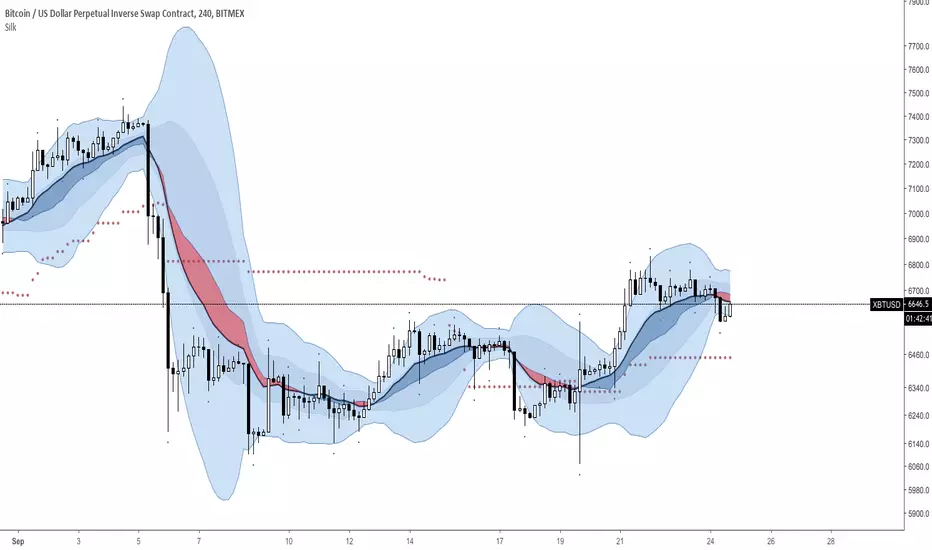
Silk Indicator (H4 & D1) : VWMA Flow vs EMA // BB vs Dev. St.RSIPictured as a Momentum Indicator, it shines best on the H4 and the D1.
A combination of VWMA, EMA's, BB, Stochastic RSI, the Kijun (Doubled Ichimoku Cloud), William's Fractals ('.') and too many Standard Deviations.
Simple Strategy:
Center Blue: Long
Center Red: Short
The center of the BB can help understand the market's momentum and its strength.
Please be advised, this indicator will only be free for a limited time.
Double Stochastic DivergenceThis Study plots divergences and overlays a second %K as a fractal and changes the colour of %D for the non fractal
Feel Free to change the indicator values to suit your style / system
The divergence script is thanks to @RicardoSantos, I've just adjusted it to suite my indicator
Remember that divergences work best when traded with the trend or very late in a trend when going against the trend
Common value for %K is 5, I have chosen 3 as it gives faster entries when using multiple time frames
If you are not using a momentum indicator as a trailing stop and using only cycle indicator
then I would recommended %K be 4 for exits

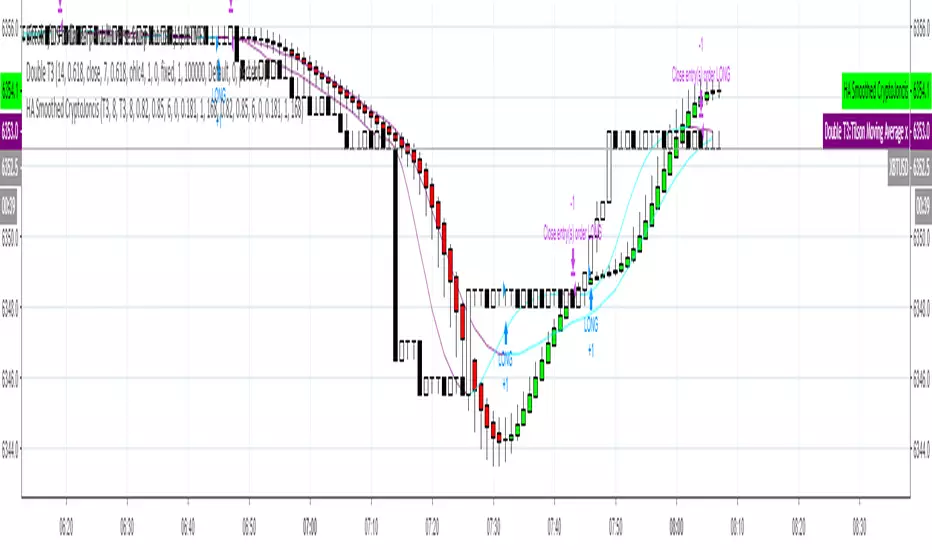
Heikin-Ashi Smoothed with option to change MA types CryptoJoncisPine Script version=3
Author CryptoJoncis
Heikin-Ashi Smoothed
The Heikin-Ashi Smoothed study is based upon the standard Heikin-Ashi study with additional moving average calculations. The following is the calculation formula for the bars:
1. The current bar Open, High, Low, Close values are smoothed individually by using the moving average type specified by the Moving Average Type 1 Input with a length/period specified by the Moving Average Period 1 Input.
2. The Heikin-Ashi bar Open, High, Low, Close values are set using the smoothed values from step 1. This is performed using the standard Heikin-Ashi formula.
3. The final Heikin-Ashi Open, High, Low, Close values are calculated by doing a second smoothing of the bar values from step 2 by using the moving average type specified by the Moving Average Type 2 Input with a length/period specified by the Moving Average Period 2 Input.
If you choose to tick the box where it offers to use only one smoothed HA then it skips the third/final step and you do not need to choose the second MA type for it to work.
Remember, using FRAMA, always make sure you use even number for length.
For simple Heikin-Ashi, please tick single smoothed and DEFAULT (Not smoothed as there are no MA used)
Heikin-Ashi bars are calculated:
1. Close = (Open + High + Low + Close) / 4
This is the average price of the current bar.
2. Open = (Open of Previous Bar + Close of Previous Bar) / 2
This is the midpoint of the previous bar.
3. High = Max of (High, Open, Close)
Highest value of the three.
4. Low = Min of (Low, Open, Close)
Lowest value of the three.
Any questions/suggestions/errors or spelling mistakes? Please leave a comment and let me know. I will try to fix it.
This took me few days to finish, so I hope you will find it useful.
Would you like to have more MA type choices? Please comment down with any other which aren't included in this indicator and I will research them and add.
MA included in this script:
Tillson Moving Average (T3)
Double Exponential Moving Average (DEMA)
Arnaud Legoux Moving Average (ALMA)
Least Squares Moving Average (LSMA)
Simple Moving Average (SMA)
Exponential Moving Average (EMA)
Weighted Moving Average (WMA)
Smoothed Moving Average (SMMA)
Triple Exponential Moving Average (TEMA)
Hull Moving Average (HMA)
Adaptive moving average (AMA)
Fractal Adaptive Moving Average (FAMA)
Variable Index Dynamic Average (VIDYA)
Triangular Moving Average (TRIMA)
You can use,publish,modify this code in any way as you wish, but only if you reference me after.
You are not allowed to sell it as it is.
If this code is useful to you, then consider to buy me a coffee (or better a pint of beer) by donating Bitcoin or Etherium to:
BTC: 3FiBnveHo3YW6DSiPEmoCFCyCnsrWS3JBR
ETH: 0xac290B4A721f5ef75b0971F1102e01E1942A4578
References:
www.sierrachart.com
www.investopedia.com
www.binarytribune.com
www.investopedia.com
www.stockfetcher.com
www.mql5.com
www.incrediblecharts.com
help.cqg.com
www.blastchart.com
ULTIMATE ICHIMOKU TRADING SUITEThis is an update of "Uncle Mo's Ultimate Ichimoku V1"
Main features:
2 x Ichimoku Cloud
5 x EMA
2 x MA
1 x HullMA
Williams Fractal
Bollinger Bands - ***NEW***
ATR - ***NEW***
PSAR - ***NEW***
Candlestick Patterns - ***NEW***
Price Action Bars- ***NEW***
List of credits:
@br0qn for the Ichimoku
@RicardoSantos for the Bill Williams Fractal
@EmilianoMesa for the EMAs/MAs
@mohamed982 for the HullMA
@ymaheshreddy4u for the Bollinger Bands
@ChrisMoody for the Price Action Bars and PSAR
@HPotter for the ATR
@repo32 for the Candlestick Patterns
The script is open source and free to use. Feel free to change it around to suit your needs.
***If you copy & paste code from other traders to make your own script, please do remember to give them credit for their amazing work.***
Happy trading!
