Fractals [NT-DIGITALS]Description:
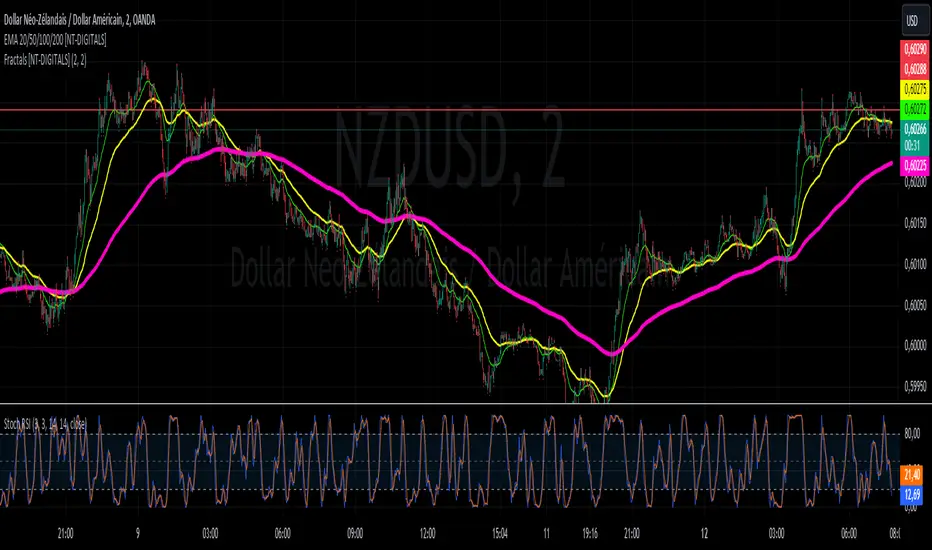
The Fractals Detector indicator in Pine Script version 5 identifies potential turning points using specific candlestick patterns. Fractals are significant in technical analysis as they indicate potential highs or lows in price. A fractal high forms when the highest price of a candlestick is surrounded by two lower highs on either side. Conversely, a fractal low forms when the lowest price of a candlestick is surrounded by two higher lows on either side.
Features:
Detects fractal highs and lows on the chart.
Customizable parameters for the number of bars to the left and right required to form a fractal.
Displays distinct symbols for fractal highs (red upward arrows) and fractal lows (green downward arrows).
Parameters:
Bars to the Left: Number of bars to the left to form a fractal (default: 2).
Bars to the Right: Number of bars to the right to form a fractal (default: 2).
Usage:
This indicator is useful for traders looking to identify potential turning points in prices. Fractals can serve as entry or exit points based on the detected reversals.Description:
The Fractals Detector indicator in Pine Script version 5 identifies potential turning points using specific candlestick patterns. Fractals are significant in technical analysis as they indicate potential highs or lows in price. A fractal high forms when the highest price of a candlestick is surrounded by two lower highs on either side. Conversely, a fractal low forms when the lowest price of a candlestick is surrounded by two higher lows on either side.
Features:
Detects fractal highs and lows on the chart.
Customizable parameters for the number of bars to the left and right required to form a fractal.
Displays distinct symbols for fractal highs (red upward arrows) and fractal lows (green downward arrows).
Parameters:
Bars to the Left: Number of bars to the left to form a fractal (default: 2).
Bars to the Right: Number of bars to the right to form a fractal (default: 2).
Usage:
This indicator is useful for traders looking to identify potential turning points in prices. Fractals can serve as entry or exit points based on the detected reversals.
Recherche dans les scripts pour "Fractal"
BORSA 321 - Care PackageOverview
Care Package is a complete higher-timeframe and intraday context tool designed to map out every important environmental factor on your chart: sessions, opening levels, gaps, market structure, order blocks, fair value gaps, volume imbalance and more.
It automatically plots:
Sessions / killzones (Asia, London, New York AM/Lunch/PM)
Key opening levels (00:00, 08:30, 09:30, 13:30)
Previous day AM/PM high–low ranges
New Day and New Week Opening Gaps (NDOG / NWOG)
RTH gap and RTH zone levels
Multi-timeframe Fair Value Gaps (up to 4)
Fractals and Order Blocks (with optional FVG confirmation)
Market structure (HH/HL/LL/LH, CHoCH, BOS)
Volume Imbalance zones with mitigation logic
All session logic runs on IANA time zones (like America/New_York), giving accurate sessions and market opens regardless of DST or broker feed.
Care Package serves as the full “context layer” for intraday execution charts.
What It Shows
1. Sessions / Killzones
The indicator automatically highlights:
Asia Session
London Session
New York AM
New York Lunch
New York PM
Each session displays:
A high–low range box
Labels for session high and session low
A midline showing the mean price
Optional forward extensions of session levels to the current bar
This cleanly outlines intraday phases for ICT/SMC execution.
2. Opening Price Levels
Key market open levels tracked:
00:00
08:30
09:30
13:30
For each open, the script draws:
A horizontal line at the opening price
A label showing time and price
An optional vertical line marking the opening bar
These opens often act as liquidity or reversal areas.
3. Previous Day AM/PM Levels
The script splits the prior day into:
Previous Day AM (first half)
Previous Day PM (second half)
Both provide:
PD AM High, PD AM Low
PD PM High, PD PM Low
Forward-projected levels
Labels for easy identification
Useful for navigating intraday targets and reaction zones.
4. Last N Days High/Low
Tracks a rolling daily range:
Each day’s High and Low
Labels containing the date
Forward extension into today’s price action
This shows where price sits relative to recent daily extremes.
5. New Day & New Week Opening Gaps (NDOG / NWOG)
The script automatically identifies:
NDOG (New Day Open Gap)
NWOG (New Week Open Gap)
Each gap includes:
A shaded zone between the two opens
Labels showing the gap type and date/week
Forward extension (optional)
Limiting the number of historical gaps (optional)
Critical for identifying unfilled imbalance zones across sessions and weeks.
6. RTH Gap & RTH Zone
You define RTH open/close times, and the indicator:
Detects RTH gaps
Draws a full zone based on direction
Plots subdivision lines (top, 75%, mid, 25%, bottom)
Extends the RTH Close reference line forward
Can extend old RTH zones automatically
Ideal for futures traders and equities.
7. Higher-Timeframe Fair Value Gaps (up to 4 TFs)
Supports up to four selectable FVG timeframes such as:
Chart timeframe
5m, 15m, 1H, 4H, 1D, 1W, 1M
Each FVG includes:
Top and bottom boundary
A midline (mean threshold)
Colored bullish or bearish fill
A label showing FVG + timeframe
Automatic cleanup when mitigated (close/wick based)
You get a clean and accurate HTF FVG map without clutter.
8. Fractals & Order Blocks
Fractals:
Standard or 5-bar fractals
Plotted as swing highs and lows
Order Blocks:
Bullish OB → down candle before up displacement
Bearish OB → up candle before down displacement
Optionally require OB to be near an FVG
Wick-based or body-based OB size
Forward-projected OB boxes
Auto-delete after mitigation
This keeps your OBs clean and execution-focused.
9. Market Structure (HH/HL/LL/LH, CHoCH, BOS)
The indicator automatically detects:
HH (Higher High)
HL (Higher Low)
LH (Lower High)
LL (Lower Low)
And also identifies:
CHoCH (Change of Character)
BOS (Break of Structure)
Each break includes:
A horizontal level at the break point
A color-coded label
Bullish (green) or bearish (red) styling
A complete market structure map is built automatically.
10. Volume Imbalances (VI)
Detects and displays:
Bullish VI (VI+)
Bearish VI (VI-)
Features:
Configurable colors
Custom label size
Max visible boxes
Extension until mitigation
Automatic mitigation detection (close or wick)
Highlight when price enters an active VI
Perfect for tracking aggressive buying/selling footprints.
11. Timezone & Date/Time Widget
Uses IANA timezones for:
Accurate session boundaries
Proper DST handling
Multi-market consistency
Also includes a small on-chart table showing:
Your timezone date/time
Exchange timezone date/time
Great for globally active traders.
12. Max Display Timeframe
To prevent clutter, the script disables visuals above a chosen timeframe.
If you exceed it:
A clean on-chart message appears
Tells you to lower your chart TF or adjust the Max Display TF
Keeps charts fast and clean
Key Inputs & Customization
Timezone (IANA format)
Max Display Timeframe
Session/Killzone toggles, colors, naming
Opening levels (00:00 / 08:30 / 09:30 / 13:30)
Previous Day AM/PM highs/lows
NDOG / NWOG gap settings
RTH gap settings
FVG batching (4 independent timeframes)
Fractal type
Order Block settings (range type, deletion, FVG filter)
Market structure settings
Volume Imbalance settings
Date/time widget settings
Everything is modular — turn features on/off individually.
How It Helps Traders
For Intraday Traders / Scalpers:
Session mapping for timing setups
Exact key opening prices
RTH gaps and internals
Precise daily AM/PM high–low context
HTF FVGs, OBs, VI zones for higher-timeframe bias
Real-time CHoCH/BOS for entry timing
For Swing Traders:
Daily/weekly context plotted automatically
NDOG, NWOG, RTH gap awareness
Macro structure levels
HTF FVGs and OBs for HTF targets

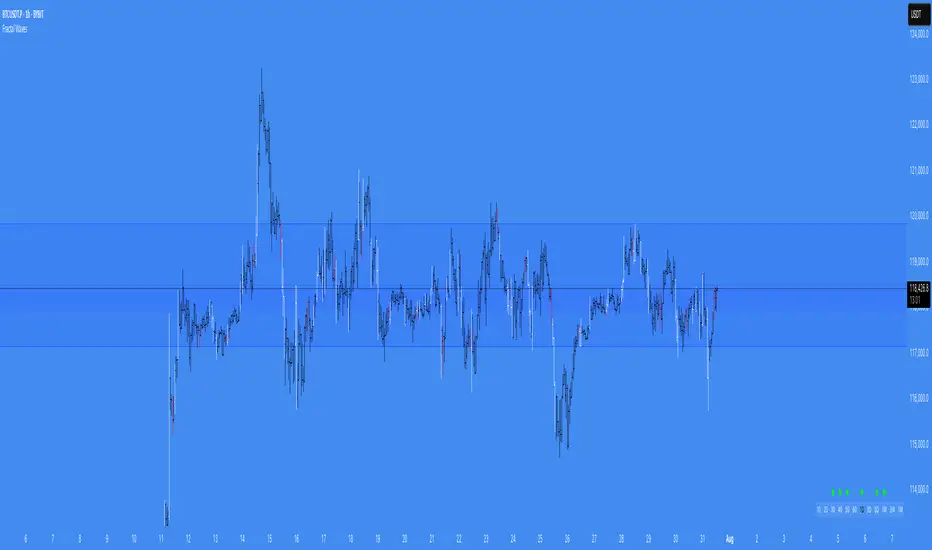
Fractal WavesSummary of the "Fractal Waves" Indicator
The "Fractal Waves" indicator is a multifaceted trading tool designed for TradingView that combines various technical analysis methods to help traders identify potential market trends and trading opportunities. It overlays multiple analyses directly onto price charts, providing a comprehensive visual representation of market dynamics.
Key Features:
Fractal Wave Detection and Visualization:
Purpose: Identifies fractal highs and lows to signal potential trend reversals or continuations.
Functionality: Calculates fractal highs, lows, and midpoints on both the current and an additional user-selected timeframe. Plots lines at these fractal points with color coding to distinguish between bullish and bearish trends. Fills areas between fractal highs and lows with background colors to enhance visual cues. Updates fractal lines dynamically as new fractals are identified. Multiple Time Frame Moving Averages (MTF MA):
Purpose: Provides insight into trend directions across different timeframes.
Functionality: Allows plotting of up to three customizable moving averages from different timeframes on the current chart. Users can select the type of MA (SMA, EMA, DEMA, VWMA, RMA, WMA), length, resolution, and color. Optionally displays labels showing MA details like type, length, and resolution for clarity. Bar Pattern Identification (Inside and Outside Bars):
Purpose: Highlights specific bar patterns that may indicate market indecision or breakout potential.
Functionality: Detects inside bars (where the current bar's range is within the previous bar) and outside bars (where the current bar's range exceeds the previous bar). Colors bars based on whether they are bullish or bearish inside/outside bars using user-defined colors. Utilizes "The Strat" methodology to assign numbers (1 for inside bars, 2 for directional bars, 3 for outside bars) and plots them above the bars. Wicked Wicks Visualization:
Purpose: Highlights significant wicks that may indicate rejection at certain price levels.
Functionality: Identifies long upper wicks (top wicks) and lower wicks (bottom wicks) relative to previous bars. Plots custom candles to emphasize these wicks with specific background and border colors. Aids in recognizing potential reversals or strong buying/selling pressure. Volume Weighted Average Price (VWAP):
Purpose: Helps identify the average trading price weighted by volume, acting as dynamic support or resistance.
Functionality: Calculates and plots the daily VWAP, updating at the start of each session. Changes VWAP line color at session start for visual differentiation. Applicable primarily to intraday charts (60-minute timeframe or lower). Volume and Extreme Volume Reversal (EVR) Analysis:
Purpose: Detects areas of unusually high volume that may precede price reversals.
Functionality: Tracks the highest volume bars of the current and previous day. Plots boxes and lines to highlight extreme volume areas. Changes candle colors for high-volume bars to draw attention. Calculates and plots potential reversal levels based on extreme volume. Rate of Change (ROC) and Average True Range (ATR) Ratio Analysis:
Purpose: Assesses price momentum relative to volatility to predict trend changes.
Functionality: Calculates the ROC and ATR over specified lengths. Computes the ratio of ROC to ATR to gauge momentum. Plots bullish or bearish dots on the chart when ROC-ATR ratio aligns with the fractal trend, indicating potential trend shifts. Provides alerts when a new bullish or bearish trend is detected. Average Volume Weighted Average Price (AVWAP) with Dynamic Lookback Periods:
Purpose: Identifies key price levels based on volume-weighted averages over specific lookback periods.
Functionality: Calculates AVWAPs from the highest and lowest points over dynamic or manual lookback periods. Adjusts lookback periods automatically based on the current chart timeframe or uses user-defined periods. Plots AVWAP lines and fills the area between them, highlighting overlaps which may signify significant support/resistance levels. Fractal Wave Table Across Multiple Timeframes:
Purpose: Provides a quick overview of fractal trends and inside bar patterns across various timeframes.
Functionality: Displays a table at the bottom of the chart showing fractal wave values and inside bar statuses for timeframes from 5 minutes to monthly. Uses color coding to indicate bullish or bearish trends and whether the price is above or below the fractal wave. Indicates inside bars with symbols and colors to quickly identify consolidation periods. Alert Conditions:
Purpose: Keeps traders informed of significant market events without constant monitoring.
Functionality: Triggers alerts for: Bullish or bearish trend changes when the ROC-ATR ratio aligns with the fractal trend. Price crossing above a fractal high or below a fractal low. Formation of new bullish or bearish fractals. EVR-based potential long or short opportunities.
Usage Notes:
Customization: The indicator offers extensive customization options, allowing users to adjust colors, timeframes, calculation periods, and display preferences to suit their trading style. Timeframe Considerations: Some features, like EVR analysis and intraday VWAP, are optimized for intraday timeframes (up to 60 minutes). The indicator adjusts calculations and visualizations based on the current chart's timeframe. Comprehensive Analysis: By combining multiple technical analysis tools—such as fractals, moving averages, volume analysis, and bar patterns—the indicator provides a holistic view of market conditions. Visual Clarity: The use of color coding, labels, and symbols enhances visual interpretation, making it easier for traders to identify patterns and trends at a glance. Alerts and Notifications: Built-in alert conditions help traders stay informed of key market developments, enabling timely decision-making without the need for constant chart monitoring.
Conclusion:
The "Fractal Waves" indicator serves as an advanced analytical tool that synthesizes various technical indicators to support traders in market analysis. By overlaying fractal patterns, moving averages from multiple timeframes, volume analysis, and bar patterns onto price charts, it aids in identifying potential trading opportunities and understanding market dynamics across different timeframes. The combination of visual cues and alert notifications makes it a valuable asset for traders seeking deeper insight into market behavior.
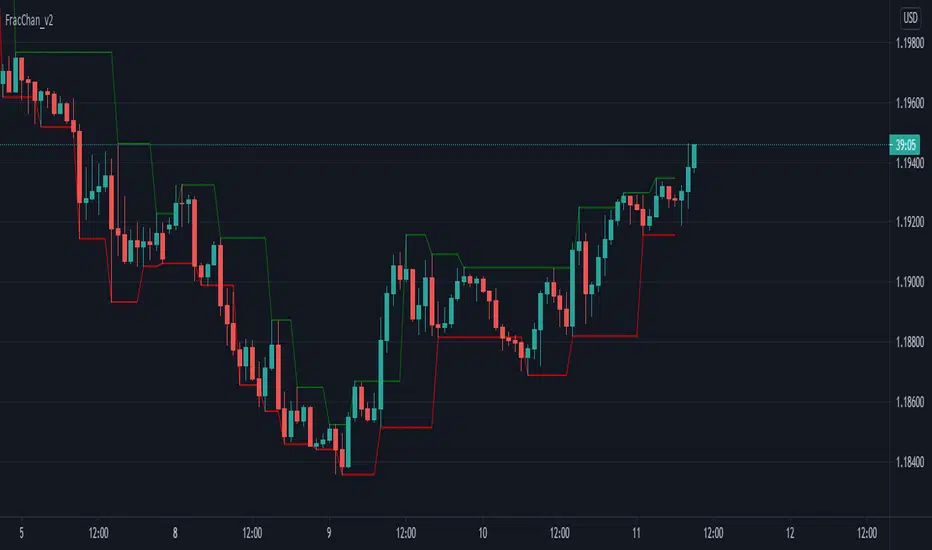
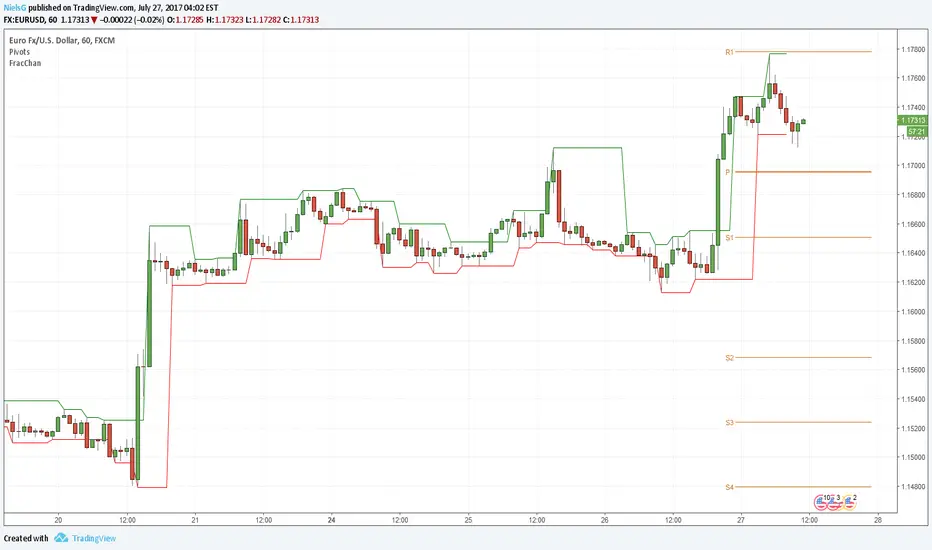
Fractal Channel v2Just another way of visualizing Williams' Fractals: they are now joined in a channel.
You can also create a channel of Fractals from another time frame than the current.
Great for identifying breakout entries, trend direction analysis (i.e. easily visualize Higher Lows, Higher Highs, Lower Lows, Lower Highs) or to trail your Stop Losses.
Version 2 of the Fractal Channel now correctly identifies William's Fractals when the High/Low of the 'Fractal Candle' is equal to the High/Low of the neighbouring 2 candles on both sides.
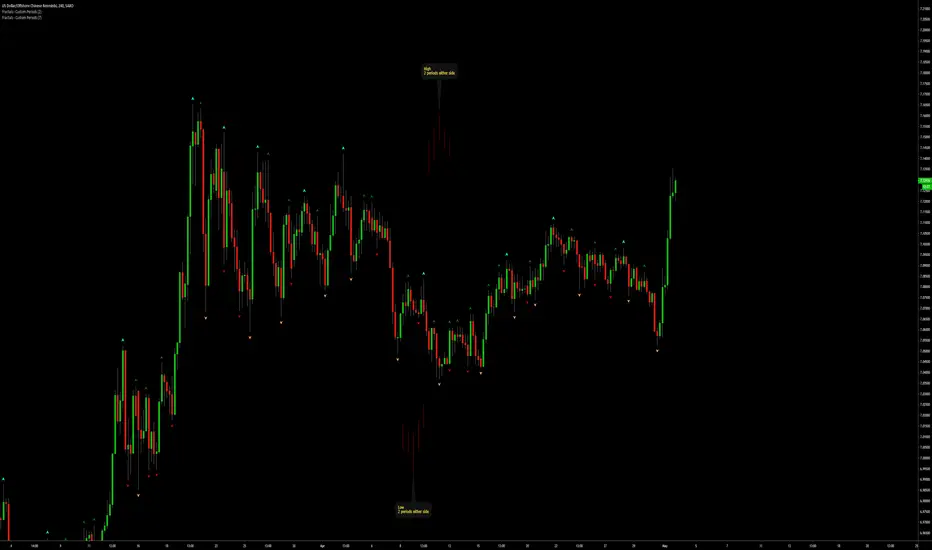
Fractals | Swing Points | Highs & Lows | Custom PeriodsSimple script which marks out key swing highs & lows.
One of the only indicators I have on the chart most days
- perfect for naked charting
- quickly helps you to visually identify key areas of interest
An extension of Bill Williams fractals
- aka short term swing points
Allows you to filter for only the most prominent swing points
- you can even overlay multiple swingpoint filters in different colours (as per example chart)
The number ( Fractal Periods) is simply:
- the number of less prominent points either side of your swing high/low
- example shown on the chart
Otherwise make a fist
- look at your 5 knuckles
- swing high is your middle knuckle
- 2 lower points either side
Bill Williams Original Fractal:
Fractal Periods = 2
Your Fractal Period for Filtering:
3, 4, 5, 30, 365, etc
Allows you to find swing points down to:
Fractal Periods = 1
Simple, easy, shared to enjoy =)

Fractals | Swing Points | Highs & Lows | Custom PeriodsSimple script which marks out key swing highs & lows.
One of the only indicators I have on the chart most days
- perfect for naked charting
- quickly helps you to visually identify key areas of interest
An extension of Bill Williams fractals
- aka short term swing points
Allows you to filter for only the most prominent swing points
- you can even overlay multiple swingpoint filters in different colours (as per example chart)
The number (Fractal Periods) is simply:
- the number of less prominent points either side of your swing high/low
- example shown on the chart
Otherwise make a fist
- look at your 5 knuckles
- swing high is your middle knuckle
- 2 lower points either side
Bill Williams Original Fractal:
Fractal Periods = 2
Your Fractal Period for Filtering:
3, 4, 5, 30, 365, etc
Simple, easy, shared to enjoy =)
Fractal & Entropy Market Dynamics with Mexican Hat WaveletThis indicator combines fractal analysis, entropy, and wavelet theory to model market dynamics using a customized approach. It integrates advanced mathematical techniques to assess the complexity and structure of price action, while also incorporating volume and price volatility.
Key Concepts and Features:
Volume-Weighted Price:
The script calculates a volume-adjusted price using a moving average of volume to give more weight to periods with higher volume. This allows the indicator to account for the impact of trading volume on price movements, enhancing its sensitivity to significant price shifts.
Mexican Hat Wavelet Approximation:
The script employs the Mexican Hat Wavelet, a mathematical tool that approximates price movements based on the Laplacian of the price series. This helps capture localized oscillations in price, acting as a filter to highlight certain price dynamics over the specified length. This wavelet is commonly used to identify key inflection points and trends in financial data.
Fractal Dimension Calculation:
The fractal dimension is calculated to quantify the market's complexity. It measures how price moves between intervals, with higher values indicating chaotic or more volatile market behavior. This dimension captures the self-similarity in price movements across different time frames, a key feature of fractals.
Shannon Entropy Calculation:
Shannon Entropy is used to measure the randomness or uncertainty in the price action. It calculates the degree of unpredictability based on the price changes, providing insight into the market's informational efficiency. Higher entropy indicates more randomness, while lower entropy suggests more predictable trends.
Custom Normalization:
The script includes a custom normalization function that processes the composite score (derived from fractal dimension and entropy). This normalization helps scale the values into a consistent range, making it easier to interpret the output. The smoothing factor and RSI-based approach ensure that the normalized value reacts smoothly to the changes in market dynamics.
Composite Score:
The composite score is a weighted combination of the fractal dimension and entropy. This score aims to provide a holistic view of the market by combining the structural complexity (fractal) and randomness (entropy) into one unified metric.
Plotting and Visuals:
The indicator plots the normalized composite score on a scale where a baseline of 50 is provided for reference. The resulting plot helps traders visualize market dynamics, with the score fluctuating based on changes in the market's fractal dimension and entropy. A score above or below the baseline of 50 indicates potential market shifts.
Use Case:
The "Enhanced Fractal and Entropy Market Dynamics with Mexican Hat Wavelet" is useful for traders looking to identify market conditions where there is a balance between price structure and randomness. By integrating wavelets, fractals, and entropy, the indicator can provide insights into market complexity, helping traders recognize potential trend reversals, periods of consolidation, or increased volatility. This can be particularly effective for those employing swing trading or trend-following strategies

Fractal ChannelJust another way of visualizing Williams' Fractals: they are now joined in a channel.
You can also create a channel of Fractals from another time frame than the current.
Great for identifying breakout entries or to trail your Stop Losses.
Fractal FramerThis indicator constructs dynamic high/low price range levels, based on 3 point fractals. Trend lines are drawn (zigzag style) at fractal points when trend direction is clearly established.
This is a lagging indicator: fractals lag by one bar and trend lines can lag by many bars. However, its strength lays in objectively defining historic price action: e.g. support/resistance levels and waves within a trend.
See the comments at the beginning of the script for a complete description.

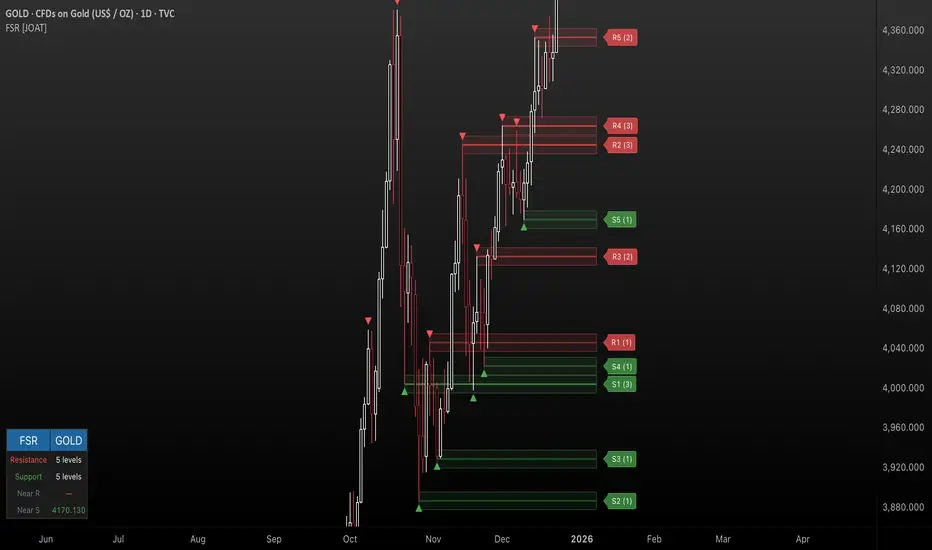
Fractal Support & Resistance [JOAT]
Fractal Support & Resistance — Automatic Level Detection with Volume Weighting
Fractal Support & Resistance automatically identifies key price levels using a proprietary combination of fractal detection, volume analysis, and dynamic touch counting. Levels are intelligently styled based on their strength and how many times they have been tested, giving you instant visual feedback on level importance.
Why This Script is Protected
This script is published as closed-source to protect the proprietary level management algorithm and the unique volume-weighted strength calculation methodology from unauthorized republishing. The specific implementation of touch detection, level merging logic, and dynamic opacity calculations represents original work that differentiates this from standard fractal indicators.
What Makes This Indicator Unique
Unlike basic fractal indicators that simply mark pivot points, this system:
Tracks how many times each level has been tested (touch counting)
Weights level importance by volume at the fractal point
Merges nearby fractals into single levels instead of cluttering the chart
Dynamically adjusts visual opacity based on level strength
Provides zone boxes around levels for realistic price reaction areas
What This Indicator Does
Detects fractal pivot highs and lows to establish support and resistance levels
Tracks how many times each level has been touched or tested
Weights level importance by volume at the fractal point
Draws extending lines and zone boxes for each level
Dynamically adjusts level opacity based on touch count for visual strength indication
Provides a dashboard with nearest levels and counts
Core Methodology
The indicator uses Williams Fractal concepts as a foundation but extends them with proprietary enhancements:
Fractal Detection — Identifies pivot highs and lows where price creates local extremes with confirmation bars on each side. A fractal high requires the highest point with lower highs on both sides; a fractal low requires the lowest point with higher lows on both sides.
Level Clustering — New fractals within a tolerance zone (based on Zone Padding %) update existing levels rather than creating duplicates. This keeps the chart clean and focuses on significant price areas.
Volume Integration — Volume at each fractal point is accumulated to weight level significance. Higher volume fractals are considered more important.
Touch Tracking — The system monitors when price approaches existing levels and increments touch counts. More touches indicate stronger, more significant levels.
Visual Strength System
Level appearance changes dynamically based on market interaction:
Newer or less-tested levels appear more transparent (up to 80% transparency)
Each additional touch reduces transparency by 15%
Heavily tested levels become more prominent and opaque (minimum 20% transparency)
Labels display level number and touch count (e.g., "R1 (3)" = Resistance 1 with 3 touches)
Zone boxes provide visual areas around each level
Color Scheme
Resistance Color — Default: #FF5252 (red) — Used for resistance levels and zones
Support Color — Default: #4CAF50 (green) — Used for support levels and zones
Zone Fill — 90% transparent version of level color
Zone Border — 70% transparent version of level color
Labels — 30% transparent background with white text
Dashboard Information
The on-chart table (bottom-left corner) displays:
Number of active resistance levels meeting minimum touch requirement
Number of active support levels meeting minimum touch requirement
Nearest resistance level above current price
Nearest support level below current price
Inputs Overview
Fractal Settings:
Fractal Period — Bars on each side for fractal confirmation (default: 2, range: 1-10)
Max Levels Per Side — Maximum resistance and support levels to track (default: 5, range: 1-20)
Zone Padding (%) — Level zone width as percentage of price (default: 0.2%, range: 0-2%)
Filtering:
Volume Weight Levels — Toggle volume-weighted level importance (default: on)
Min Touches to Show — Filter out levels with fewer touches (default: 1, range: 1-10)
Lookback Period — Historical bars to analyze for level detection (default: 200, range: 50-500)
Visual Settings:
Resistance/Support Colors — Customizable color scheme
Show Zone Boxes — Toggle filled zone areas around levels
Show Level Labels — Toggle level labels with touch counts
Show Fractal Markers — Toggle small triangles at fractal points
Show Dashboard — Toggle the information table
Line Width — Thickness of level lines (default: 2, range: 1-5)
How to Use It
For Support/Resistance Trading:
Use levels with higher touch counts as stronger support/resistance references
More opaque levels have been tested more times and are more significant
Watch for price reactions at zone boundaries, not just exact level prices
Combine with candlestick patterns at levels for entry signals
For Breakout Trading:
Watch for breakouts when price closes beyond a level
Levels with many touches that finally break often produce strong moves
Use the zone box—a close beyond the zone is more significant than just touching the level
Set alerts for resistance/support breaks
For Target Setting:
Use the nearest resistance as a profit target for long positions
Use the nearest support as a profit target for short positions
Dashboard shows these levels for quick reference
Alerts Available
FSR Resistance Break — Price closes above a resistance level
FSR Support Break — Price closes below a support level
FSR New Fractal High — Fresh fractal high detected
FSR New Fractal Low — Fresh fractal low detected
Best Practices
Increase Fractal Period for fewer but more significant levels
Use Min Touches filter to show only well-tested levels
Volume weighting helps identify institutionally significant levels
Combine with trend indicators—trade with the trend at levels
This indicator is provided for educational purposes. It does not constitute financial advice. Past performance does not guarantee future results. Always conduct your own analysis and use proper risk management before making trading decisions.
— Made with passion by officialjackofalltrades
Fractal ConvergenceThis is an indicator, ideally for use with the 15M charts, will mark out both buy and sell signals based on Fractal Convergence. If based on the direction and layout of the EMA (8/20 from 60 min) it determines the market to be sell biased it will look for a higher low fractal to the preceding low fractal. For a Buy biased market it will look for a lower high fractal to the preceding high fractal. The indicator will mark out the entry, stop-loss, and take profit, based on the convergence it sees. You should manage your risk as per your trading plan. A further extension to this Indicator is the ability to look for confluence with the higher timeframe i.e. H4(240M). With this it will require the EMAs for the 1 hour and 4 hour to be pointing in the right direction before looking for fractal convergence.
There is a balance to be met, and a decision to be made around whether to seek confluence with HTFs or not. In some market conditions waiting will mean fewer opportunities, but at the same time, it is supposed to be a higher probability move. At the same time if you are looking for higher risk to reward opportunities you will want to be looking to get in as soon after the crossover as possible. This will "likely" give you the run up to when the higher timeframe catches up (but not always).
As with any indicator it carries the risk that it may not always work in all conditions. One should test it out and be comfortable with the likeliness of the indicator use resulting in a loss as well as a win.
To further help you get in on those early entries the indicator has an alert condition that can alert you to the first signal after the EMA cross. Please use trader discretion when deciding to take this first signal i.e. presence of horizontal, trend and direction, any fundamentals (eg. avoid trading within 2 hours of news).
One might choose to incorporate other indicators to help in decision making. One such idea would be to combine it with pivot points and maybe using them for advanced stop loss placement, or ATR for deciding if the stop placement is too close for current market conditions, Stochastic for determining if there is likely going to be a pull back(overbought/oversold), RSI to determine if the market is in an established trend (above/below 50 and inside 70/30 respectively). Lots can be done - but it is just an idea and you must decide if the entry looks good for you and you are comfortable with the risk.

Fractal and Alligator Alerts by JustUncleLThis is based on two well known Bill Williams Fractal and Alligator strategies.
The following code is an implementation is similar to reversal strategy specified here:
forexwot.com
and another well know Alligator break out strategy.
This was achieved by combining some of the ideas from two other indicators:
True Williams Alligator (SMMA) by the_batman
Fractals and Levels by JustUncleL
There are two types of Fractal + Alligator Strategies included in this indicator:
Fractal Reversal : In an uptrend defined by Low Fractal that is above the Alligator teeth and the Alligator mouth is completed open in an uptrend. The opposite for downtrends. (Green and Red Arrows)
Fractal BreakOut : In an uptrend, at the start of Alligator open we look back for the first Fractal High above Alligator Teeth. Alligator teeth must be above mouth. (Aqua and Fuchsia arrows)

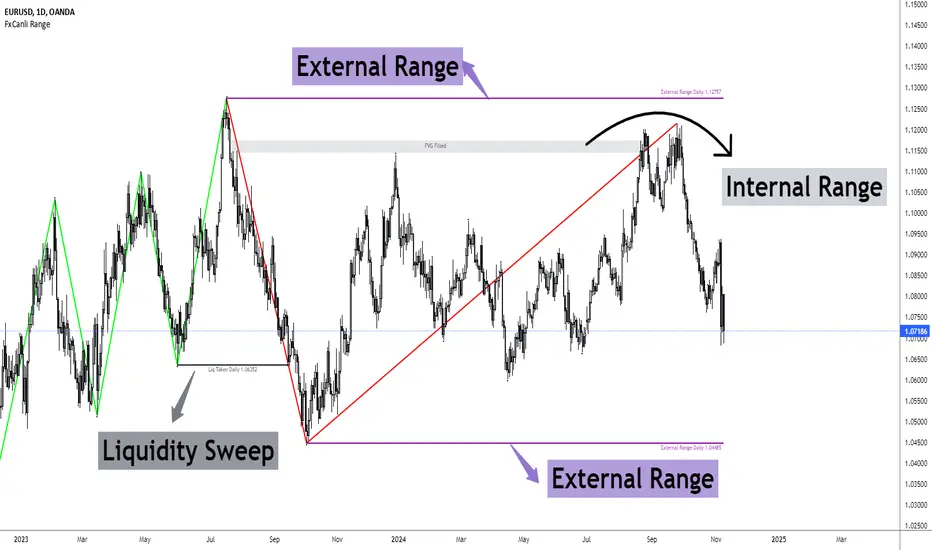
FxCanli RangeFxCanli Range is an indicator based on ICT Internal Range and External Range concept.
What is ICT Internal Range Liquidity?
The Fair Value Gap is marked as the ICT internal range liquidity.
ICT Fair Value Gap is marked as the liquidity because it is a formation of three candles leaving an area between high and low of 1st and 3rd candle where price do not overlap.
FxCanli Range Indicator draws all Internal Ranges above explaining the ICT internal range liquidity.
What is Imbalance (FVG)?
Fair Value Gaps are price jumps caused by imbalanced buying and selling pressures.
A bullish Fair Value Gap is created when there is a gap between the high of the first candle and the low of the third candle.
A bearish Fair Value Gap is created when there is a gap between the low of the first candle and the high of the third candle.
What is ICT External Range Liquidity?
The swing high and swing low of an ICT dealing range are termed as external range.
The high of an ICT dealing range is termed as “buy side liquidity” assuming the buy stops rest above the high of dealing range.
While the low of an ICT dealing range is known as “sell side liquidity” assuming the sell stops resting below the low of dealing range.
FxCanli Range Indicator draws all External Ranges above explaining the ICT external range liquidity
🔶 USAGE & EXAMPLES
As ICT said us, Price moves 2 side, Internal Liquidity or External Liquidity
External Range Liquidity to Internal Range Liquidity
When price reached to External Range, it will sweep the External Range Liquidity
at that time, we have to wait price to reverse and start to move to Internal range liquidity (FVG)
our strategy has to be like this; we have to open 2 time less lower time frame
if we are at 1 hour chart, we have to open 1Hour - 15 min - 5 min chart
and wait for Trend Reversal pattern at there
Internal Range Liquidity to External Range Liquidity
When price reached to Internal Range(FVG), it will fill the imbalance
at that time, we have to wait price to reverse and start to move to External Range Liquidity.
Again we have to decrease our time frame 2 times.
if we are at 1 hour chart, we have to open 1Hour -> 15 min -> 5 min chart
and wait for Trend Reversal pattern at there
🔶 SETTINGS
With the settings;
▪️ Fractal Properties;
it will show fractals or not, you will decide the period of fractals, Style, Color and also Size of the fractal
▪️ Trend Line Properties;
it will show trend or not, you will decide the color of the trend, line style, and line width.
▪️ External Range Properties;
it will show external range or not, Color of the level, line style, line witdh, show text of the external range, what will it write at the text, place/size/color of the text, show time frame, show price,
▪️ Internal Range Properties;
it will show internal range or not, Color of the level, line style, line witdh, show text of the external range, what will it write at the text, place/size/color of the text, show time frame, show price,
▪️ Alert Conditions
you will set alerts at this part
Alert or not, liquidity(External Range) alerts, FVG(Internal Range) alerts, FVG filled alert
Part 1
Part 2
Wish you great trades...
Event Locator BasicUsable under any conditions and in all markets, the 'event locator' provides a foundational layer for any count-based trading strategy or system. This specific installment color codes events - all down events are green, up events are blue, double-marked events are red, and smooth events are gray. It also wraps the price sequence in a 3-d line landscape plot - providing a visual using lines that are event sensitive. Though events are sometimes referred to as 'fractals,' this is not a fractal tool. These marks are based on 3 candles, not 5 as is common with the Bill Williams fractal scripts. Every countable event on the chart will be marked using this tool. Really, Elliott Wave should have told you about this... (because you can't legitimately count w/o it)
//This indicator was originally a mod of the 'Williams Fractals' indicator - modified by Erek A.D., Nov. 2017
//It was rewritten from the ground up by 'Brobear' in Sept./Oct. 2018
//This code marks 'rough' AND 'smooth' EVENTS in price flow
//EVENTS are naturally created in markets when SEPARATION occurs at candle tips
//SEPARATION happens when a high is flanked by lower highs or a low is flanked by higher lows
//EVENT LOCATORS like this provide an objective foundation for counting price movement

STP Fractal CorridorsFractal Corridors is a lagging channel connecting Fractal highs and lows each with added/substracted pre-set value.
It is inspired and designed for Vladimir Poltoratskiy's trading style with his ST patterns (book: Forex Strategy: ST Patterns Trading Manual).
This uses fractals with one candle lower/higher on each side as in the book.
You may choose to disable fractals and view the channel only.
Good luck trading!

Fractals with HH/LLStandard fractals indicator with an additional signal to show if it was higher than the last "up" or lower than the last "down"
A blue dot indicates the higher/lower fractal.
Working on an update to add a counting feature which will indicate when a certain number of higher highs from a given starting point has been achived.

Fractal Regression Bands [DW]This study is an experimental regression curve built around fractal and ATR calculations.
First, Williams Fractals are calculated, and used as anchoring points.
Next, high anchor points are connected to negative sloping lines, and low anchor points to positive sloping lines. The slope is a specified percentage of the current ATR over the sampling period.
The median between the positive and negative sloping lines is then calculated, then the best fit line (linear regression) of the median is calculated to generate the basis line.
Lastly, a Golden Mean ATR is taken of price over the sampling period and multiplied by 1/2, 1, 2, and 3. The results are added and subtracted from the basis line to generate the bands.
Williams Fractals are included in the plots. The color scheme indicated whether each fractal is engulfing or non-engulfing.
Custom bar color scheme is included.

Fractal Suite: MTF Fractals + BOS/CHOCH + OB + FVG + Targets Kese Way
Fractals (Multi-Timeframe): Automatically detects both current-timeframe and higher-timeframe Bill Williams fractals, with customizable left/right bar settings.
Break of Structure (BOS) & CHoCH: Marks structural breaks and changes of character in real time.
Liquidity Sweeps: Identifies sweep patterns where price takes out a previous swing high/low but closes back within range.
Order Blocks (OB): Highlights the last opposite candle before a BOS, with customizable extension bars.
Fair Value Gaps (FVG): Finds 3-bar inefficiencies with a minimum size filter.
Confluence Zones: Optionally require OB–FVG overlap for high-probability setups.
Entry, Stop, and Targets: Automatically calculates entry price, stop loss, and up to three take-profit targets based on risk-reward ratios.
Visual Dashboard: Mini on-chart table summarizing structure, last swing points, and settings.
Alerts: Set alerts for new fractals, BOS events, and confluence-based trade setups.

Fractals V9 ModifiedSo taking Ricardo Santos script for fractals V9 -I change the time function of the high TF fractal to non repainting one
adding daily fib levels
This hybrid seems to look nice . I have to admit that all credit to Ricardo Santos for his exelent script.
thi work it hybrid work and not so much original work....
The main improvment is the signals which are not reapinting as we remove security from that.
Security function exist for daily fib but it has nothing to do wih signal generation so i did not touch it

Fractal Basic Chart Patterns [MyTradingCoder]This script is something that I made a long time ago in my early days of learning Pine. It is not in development anymore but has some unique and impressive utility that will help the community. This script will fractally identify chart patterns(iH&S,H&S,W,M) on any chart and timeframe. Most scripts have limitations that make the user have to adjust various parameters to get the desired result to show up on the chart. Lower input values may show smaller patterns, whereas vise versa, higher input values may show larger patterns, but you never seem to get the best of both worlds with these types of scripts. Some users may appreciate the vast majority of input parameters that most scripts provide, but others like myself may find it restrictive and annoying, as you wont get large patterns AND small patterns simultaneously.
All details needed to understand how to use the script are listed below. I will be creating new and well written scripts in the near future moving forward to help the community as best as I can, and just wanted to make it clear that this particular script is just something that I had on the backburner from a very long time ago, before I was a "Pinescript Maven" :) Enjoy!
Available Patterns:
- W Pattern
- M Pattern
- Head and Shoulders Pattern
- Inverse Head and Shoulder Pattern
Customizable inputs:
- Option to specify minimum bars required to consider a pattern.(Can be helpful if you don't want to see lower timeframe patterns, as some may not look like patterns, but if you drop the timeframe and go to the same time, there will be a pattern there on a lower scale)
- Boolean Inputs to Enable/Disable Certain Patterns
Available Alert Options:
- W Pattern Alert
- M Pattern Alert
- H&S Pattern Alert
- iH&S Pattern Alert
User Manual:
- Patterns will be drawn/detected/finalized on the bar close when the neckline is broken
- Green/Red lines represent the historical structure used to identify each pattern
- Blue dashed lines represent the projected price action based on the pattern completing
- Alerts/Indicator will not repaint(Can use 'once per bar' or 'once per bar close' and behavior will be identical. Code is optimized.)
- May have trouble on assets with daily/weekend time gaps with the projected price action dashed line due to time being used as the xloc. If this becomes a problem, leave a comment below and I will consider bringing this back into development and convert to bar_index as xloc to fix the issue.
- Patterns can be all shapes and sizes, hence the beauty of this indicator
- Leave a comment below for any questions or requests and give the indicator a like if you find it useful

fractaltheory BBIMKLS 2.1
In this indicator I would like you to read the exact support and resistance according to fractal reaction of Bollinger bands and Ichimoku cloud we can also see a lagging span in it which can affirm the market trends and crossing MA's giving buy and sell signal which indicates uptrend and downtrend it will be more powerful in future updates.
I am explaining every point in mentioned image so you can easily understand what my indicator does and why i am using these things to make a strategy.
1 & 2 - Red and Green Cloud of Ichimoku:
The cloud provides support/resistance levels that can be projected into the future. This sets the Ichimoku Cloud apart from many other technical indicators that only provide support and resistance levels for the current date and time. How ever the clouds are displayed in either green or red - to make the reading easier. A green cloud is created when the Leading Span A (green cloud line) is higher than Leading Span B (red cloud line). Naturally, a red cloud results from the opposite situation.
3 - Blue lines - Bollinger Bands®:
When prices continually touch the upper Bollinger Band®, the prices are thought to be overbought; conversely, when they continually touch the lower band, prices are thought to be oversold, triggering a buy signal.
4 - Lagging Span of Ichimoku:
A trend is deemed to be upward when the Legging span appears above the price, and downward when the indicator appears below the price. Many traders watch for the Legging span to cross with prior prices to signal a potential trend change. It is created by plotting closing prices 26 periods behind the last candlestick/bar. It is used to gauge the momentum of an asset and to help identify potential trend changes.
5 - Super Trend tracement:
A super-trend indicator is plotted on either above or below the closing price to signal a buy or sell. The indicator buy and sell signals based on whether or not you should be buying and it signals an entry point or points to buy.
By the very nature of the super trend indicator, it offers firm support and resistance levels for traders to enter and exit trades. Additionally, it also provides signals for setting stop losses.
The way it works is, for example when the buy signal (green) is on, when prices dip towards the indicator, you can enter or go long at this level, which doubles up as support level. Similarly, when the sell signal is on, in red, price points nearing or touching the indicator can act as levels of resistance.
6 - Buy and Sell indication:

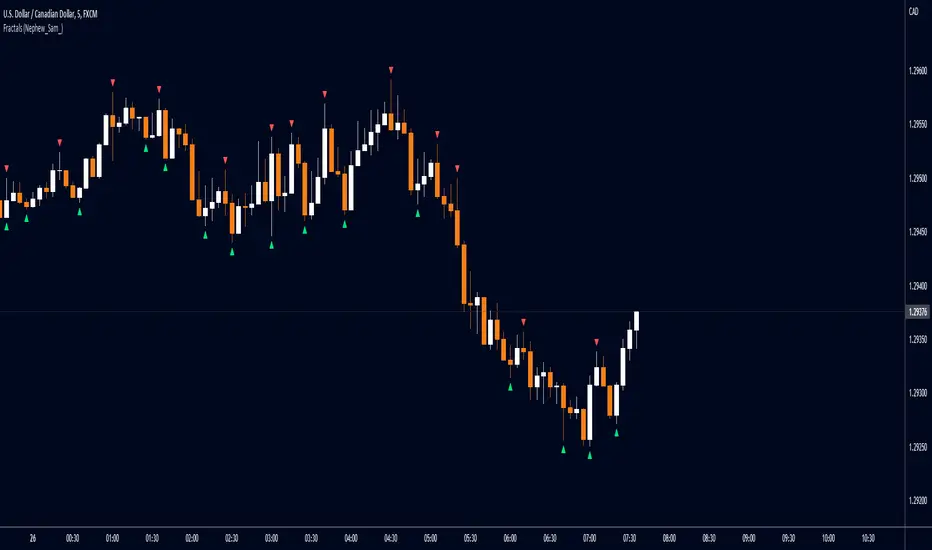
Fractals (Nephew_Sam_)Regular and Williams fractal
1. Plots 3 and 5 bar fractal point
2. Plots significant highs/lows lines
Credits to @RicardoSantos, Code taken from his open source script (V9).
FriendlyTrend Signal//FriendlyTrend Signal//
Our Tradingview representation of our strategy. Trend-Following techniques combining analysis of buying and selling on fractals, entering low-risk positions at counter-trend points, and trailing-stop orders along moving averages.
//Strategy//
Red/Green circles indicate counter-trend entry positions. These are not lagging and form on the closing of the corresponding bar. Best opportunities for a credit, debit, or other defined-risk options spreads and closed if the trade goes against us directionally with the stop loss above the high or below the low of the previous bar on market close.
Lines represent fractal support and resistance. We execute a buy if the moving average cloud is green and the green line is broken and the price closes above. Reverse for selling.
Cloud represents long or short opportunities. If the top cloud and bottom cloud are intertwined we are sidelined & wait for a large move in one direction or the other. The middle moving average is our trailing stop & another counter-trend entry point if a major support level is broken at the moving average itself.
//Still refining the code into a Tradingview Strategy form. More to come...//
