Historical VolatilityHistorical Volatility Indicator with Custom Trading Sessions
Overview
This indicator calculates **annualized Historical Volatility (HV)** using logarithmic returns and standard deviation. Unlike standard HV indicators, this version allows you to **customize trading sessions and holidays** for different markets, ensuring accurate volatility calculations for options pricing and risk management.
Key Features
✅ Custom Trading Sessions - Define multiple trading sessions per day with precise start/end times
✅ Multiple Markets Support - Pre-configured for US, Russian, European, and crypto markets
✅ Clearing Periods Handling - Account for intraday clearing breaks
✅ Flexible Calendar - Set trading days per year for different countries
✅ All Timeframes - Works correctly on intraday, daily, weekly, and monthly charts
✅ Info Table - Optional display showing calculation parameters
How It Works
The indicator uses the classical volatility formula:
σ_annual = σ_period × √(periods per year)
Where:
- σ_period = Standard deviation of logarithmic returns over the specified period
- Periods per year = Calculated based on actual trading time (not calendar time)
Calculation Method
1. Computes log returns: ln(close / close )
2. Calculates standard deviation over the lookback period
3. Annualizes using the square root rule with accurate period count
4. Displays as percentage
Settings
Calculation
- Period (default: 10) - Lookback period for volatility calculation
Trading Schedule
- Trading Days Per Year (default: 252) - Number of actual trading days
- USA: 252
- Russia: 247-250
- Europe: 250-253
- Crypto (24/7): 365
- Trading Sessions - Define trading hours in format: `hh:mm:ss-hh:mm:ss, hh:mm:ss-hh:mm:ss`
Display
- Show Info Table - Shows calculation parameters in real-time
Market Presets
United States (NYSE/NASDAQ)
Trading Sessions: 09:30:00-16:00:00
Trading Days Per Year: 252
Trading Minutes Per Day: 390
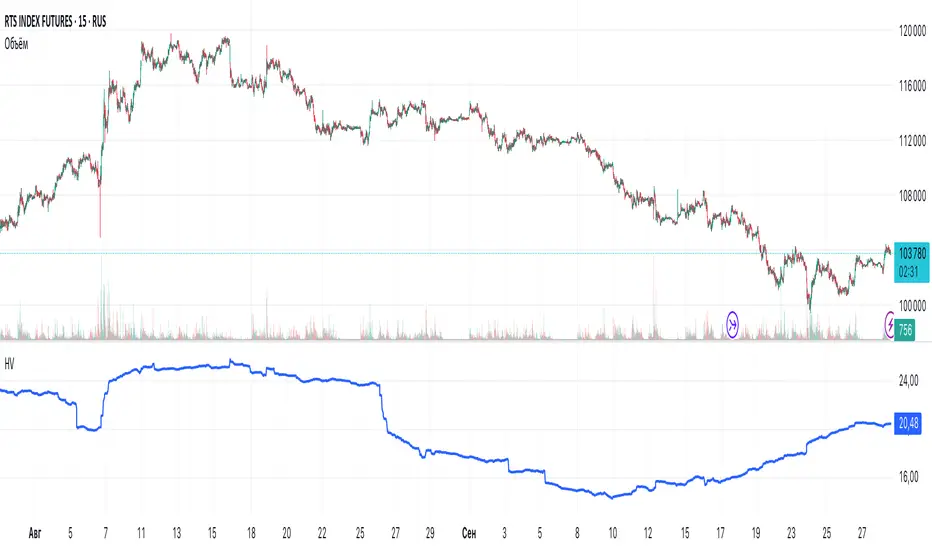
Russia (MOEX)
Trading Sessions: 10:00:00-14:00:00, 14:05:00-18:40:00
Trading Days Per Year: 248
Trading Minutes Per Day: 515
Europe (LSE)
Trading Sessions: 08:00:00-16:30:00
Trading Days Per Year: 252
Trading Minutes Per Day: 510
Germany (XETRA)
Trading Sessions: 09:00:00-17:30:00
Trading Days Per Year: 252
Trading Minutes Per Day: 510
Cryptocurrency (24/7)
Trading Sessions: 00:00:00-23:59:59
Trading Days Per Year: 365
Trading Minutes Per Day: 1440
Use Cases
Options Trading
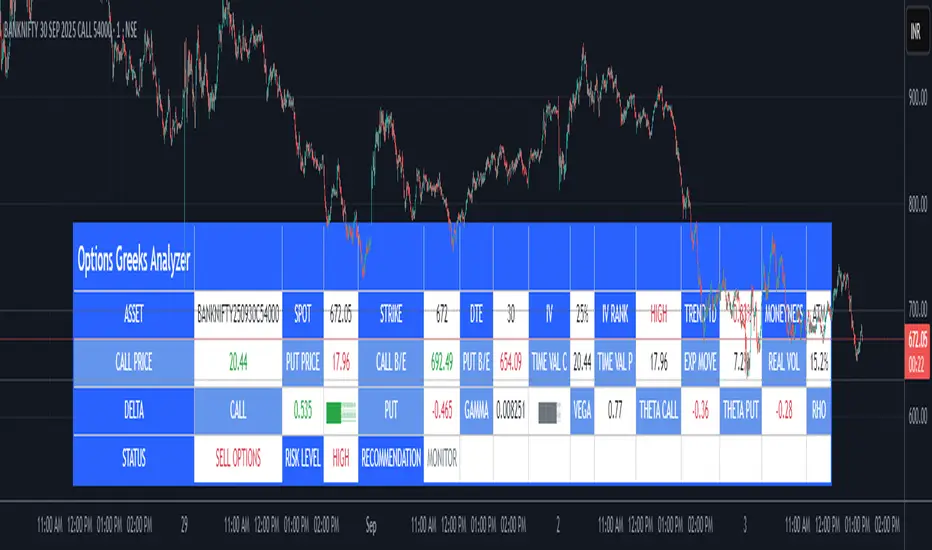
- Compare HV vs IV - Historical volatility compared to implied volatility helps identify mispriced options
- Volatility mean reversion - Identify when volatility is unusually high or low
- Straddle/strangle selection - Choose optimal strikes based on historical movement
Risk Management
- Position sizing - Adjust position size based on current volatility
- Stop-loss placement - Set stops based on expected price movement
- Portfolio volatility - Monitor individual asset volatility contribution
Market Analysis
- Regime identification - Detect transitions between low and high volatility environments
- Cross-market comparison - Compare volatility across different assets and markets
Why Accurate Trading Hours Matter
Standard HV indicators assume 24-hour trading or use simplified day counts, leading to significant errors in annualized volatility:
- 5-minute chart error : Can be off by 50%+ if using wrong period count
- Options pricing impact : Even 2-3% HV error affects option values substantially
- Intraday vs overnight : Correctly excludes non-trading periods
This indicator ensures your HV calculations match the methodology used in professional options pricing models.
Technical Notes
- Uses actual trading minutes, not calendar days
- Handles multiple clearing periods within a single trading day
- Properly scales volatility across all timeframes
- Logarithmic returns for more accurate volatility measurement
- Compatible with Pine Script v6
Author Notes: This indicator was designed specifically for options traders who need precise volatility measurements across different global markets. The customizable trading sessions ensure your HV calculations align with actual market hours and industry-standard options pricing models.
Indicateur Pine Script®