Volumeweighted macd leader with bb squeezethis indicator is very useful for stocks or crytpto especialy 3d and weekly charts
daily shows good too but if u re a daily trader use it if not dont use it coz 4h and daily is noisy some when there is no trend
thats why weekly and 3d is good because it ll give u accurate signal and trend reversals
this is not my script just a combination of lazybear squeeze momentum, macdleader and volume weighted macd of kivanc
i merge them so it also shows bb squeeze on zero line and settings name is median
macd leader is 2 differen color above zero line and below zero line
above zero line if macd leader is green its buy signal and trend is up
if blue it meand no trend or trend reversal so sell or wait if u use 4h or daily but 3d and weekly it means sell
below zero line macd leader color is red and means that there is downtrend and do not buy
when 3d or weekly turns blue on macd leader it means trend reversal about the start
good with heiken ashi candles
DO NOT FORGET THIS IS NOT PERFECT INDICATOR FOR SHORT TERM, PREFER IT 3D AND WEEKLY FR BETTER RESULTS
Recherche dans les scripts pour "LazyBear"

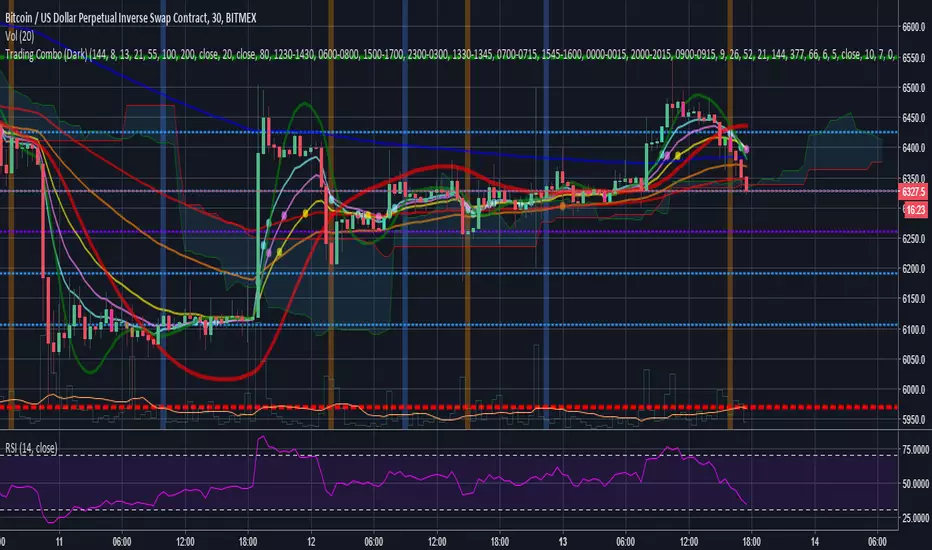
Trading Combo (Dark)This is a combo of many indicators including :
Ichimoku Cloud (With Buy and Sell Signals)
EMA
MA
HULL MA
Fibonacci Lines
Bitcoin 0.57% Kill Zones(Turned off by Default)
MA Turning Points
Reversal(Pin) Bars and Upshaved and Downshaved Bars(Inside and Outside Bars Disabled By default)
Credits to revanchdg for creating the script!
Credits for the source code go to:
Lazybear
ChrisMoody
100kiwi
Gesundheit
Updates:
- Removed all black colors so the script also works fine on the Dark theme
- Changed EMA9 to EMA8 and added EMA13
- Updated some labels for ease of configuration
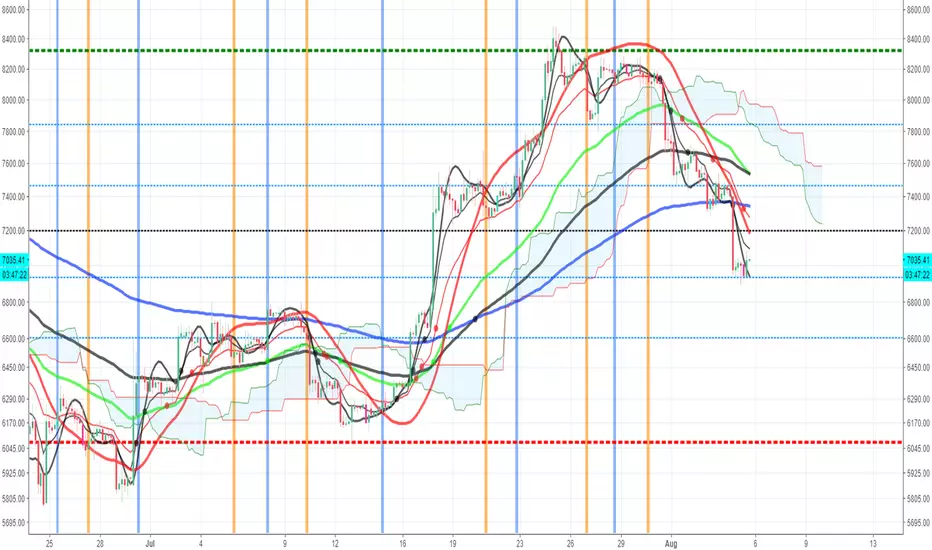
Trading ComboThis is a combo of many indicators including :
Ichimoku Cloud(With Buy and Sell Signals)
EMA
MA
HULL MA
Fibonacci Lines
Bitcoin Kill Zones(Turned off by Default)
MA Turning Points
Reversal(Pin) Bars and Upshaved and Downshaved Bars(Inside and Outside Bars Disabled By default)
Credits to for the source code:
Lazybear
ChrisMoody
100kiwi
Gesundheit

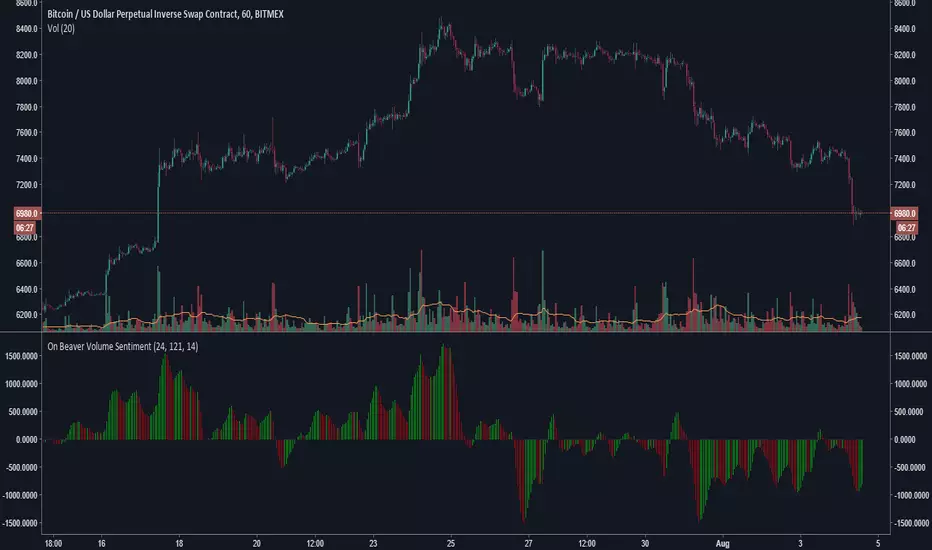
On Beaver Volume SentimentGeneral Market sentiment decoded from two Lazybear OBV's and a CCI.
Lots of strategies with this.
Main point is this indicator tries to be extra sensitive to relative volume changes but keep grounded in sentiment with the cci.
Let me know if you use this!
-Beaverman
RSI Heat Bands [River]This script combines LazyBear's RSI Bands with JayRoger's Bollinger Heat Bands, to give an on chart representation of the price needed to set RSI to each major level, from 20 to 80 (higher values created massive bands).

seven multi indicator-복합지표(Mr.J)//=============================== Vdub Binary Options SniperVX v1 ===============================//
//--------------------Trend colour ema------------------------------------------------//
//--Modified vyacheslav.shindin-------------------------------------------------//
//Modified - Rajandran R Supertrend----------------------------------------------------- //
//===============================Directional Projection=======================================//
//====================================================== 8x MA ======================================================//
//====================================================== Ichimoku Cloud ======================================================//

TripleTrendThreatSignals v1 [hanman]Ideas taken from multiple indicator's..
using LazyBear WTCross, Multiple MA's and Higher Timeframes to determine entry points. works best on 4H or higher tf candles. I personally use on DAILY.
like any other Momentum indicator , it gives OB/OS signals BUT also corrects itself during a momentum run, which is useful.
like all my other indicator's, values are adjustable and Alerting can be put in place.
ENJOY !!

CryptoVN - HawkEye Volume IndicatorThis is HawkEye volume clone by @LazyBear:
I've modified:
- Use ema instead of sma
- Added plot name and vol MA
- Used to Pine Script version 3
(*)Volume bars:
Green bars: Signify BUYER (Bullish)
Red bars: Signify SELLER (Bearish)
White bars: Signify BUYERS = SELLERS (neutral)

VFilterAlthough this script is inspired by the design of Elder Impulse script created by LazyBear, the engine is not the same.
The goal of this indicator is to filter price movement, establish direction, and manage risk. This indicator is not be used on its own, its only to be used to help establish entrys and exits.
The signals are created using a privately developed moving average on multiple time frames.
HOW TO
15, 60, 120, or 240 min chart
Green = Buy signal
Red = Sell signal
Blue = Bullish consolidation, or an aggressive/riskier buy signal
Yellow = Bearish consolidation. or an aggressive/riskier sell signal
Adjustment value is high due to the nature of the moving averages. Try using 400, 700, 900, or 950 for best results.
I suggest using this indicator with MACD and a levels indicator for price targets.

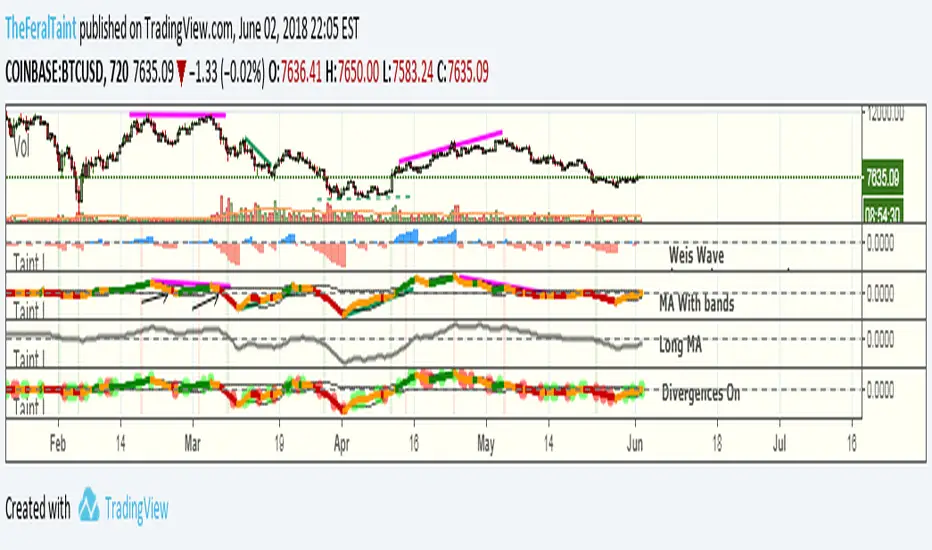
Taintalicious IndicatorThis indicator gathers data from the Weis Wave indicator (thanks to @LazyBear for the original code), and coverts it to something like a VPCI or a Chaikin Oscillator. This indicator is quite versatile. It can be ran with Weis Wave turned on and the Bands + MA turned on together, though I find the scaling becomes an issue. If it is the only indicator you're using, scaling isn't a problem as long as you enlarge it. I prefer to run the Bands + MA + Long MA as one setup, and flip to Weis Wave when I need to see the raw data underneath. You can use this indicator to spot momentum shifts, the strength of bullish or bearish moves, bull/bear divergences, trend reversals, consolidation/squeezes, and even Wyckoff springs. It will take some getting used to though.
Tips for interpretation:
--Bearish/Bearish Divergence: TI diverges from price. TI is making lower highs or higher lows while price is making higher highers or higher lows. You can turn on the setting to highlight some of these divergences, but I find it easier to simply look for them.
--As an Oscillator: TI crossing zero can indicate a shift in momentum. The deeper the initial rise or fall past zero, the stronger the momentum shift.
--Overbought/Oversold: When TI breaches the bands while they are wide--indicating high volatility in the same way Bollinger Bands do--this can be viewed as an overbought or oversold signal. Begin looking for an entry once TI forms a "v" shape, and begins moving back towards the bands. The best entry is typically when TI breaks back into the bands. These breaches are highlighted with either green or red.
--Long MA: This can be used for bull/bear divergence as well as a leading indicator for trend reversals or momentum shifts. TI crossing above or below the Long MA is one signal. Whether the Long MA is above or below zero indicates the market sentiment/trend over the last 100 periods--above zero being bullish and below zero being bearish.
Best setting for Trend Detection Length is 4
Feel free to contact me on Twitter if you have questions: @TheFeralTaint
OBV Divergence Alerts (BETA)This Script uses the original code from the 'PPO Divergence alerts' by Scarf
Only difference is the OBV Ocilator by lazybear is used as the input instead.
Adjust the smoothing setting as required to change sensitivity for alerts.
Feel free to contact me if you would like more info.
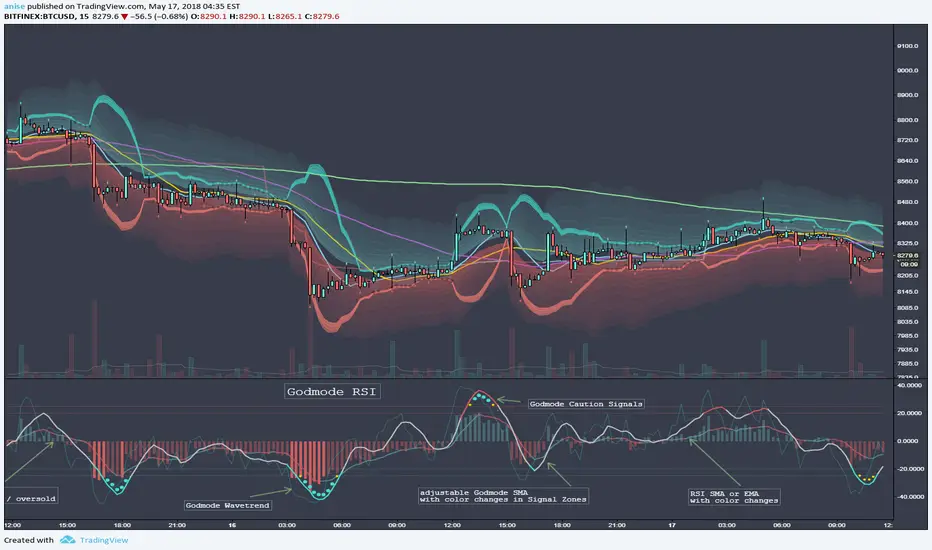
Godmode RSIbased on the popular Godmode Indicator with modifications by LEGION, LAZYBEAR, Ni6HTH4wK, xSilas, oh92, sco77m4r7in
All Credit belongs to them. THX Guys!
This is a Combination of a RSI and Godmode.
RSI has a Simple or Exponential Moving Average, Histogram Color Changes when the RSI reaches the Overbought/Oversold Zones.
Godmode is basicly the same as the Original one only scaled down a bit with slightly adjusted Caution Signal Zones which i like more. I also added the Option to adjust the Length of the 2nd Wavetrend SMA. Removed the Wavetrend Area because it doesnt have any use for me.
Hope you like it.
TD/VixFix/VolatilityStop/Momentum/WeisWave IndicatorsA nice collection of Buy/Sell indicators.
Send me some love if you find this useful:
btc: 1GcWRvkrLwmv2sD8nHYvJ7ZWf4qB1tQ1r9
eth: 0x3061513011c071d9ced8a375e51004aba26410e8
etc: 0xc7ad9ad4d6b0008a1be897666e7f643e7259a509
ltc: LY5pxGhRvNvGJcrb4pnTyH2A2hN1DPjLqt
xvg: DKcou5NyfvVzqLjjDo1eFTNaZuThdZaVUJ
zrx: 0x3061513011c071d9ced8a375e51004aba26410e8
Many thanks to:
glaz, ChrisMoody, admin, LazyBear


Wave & Trend Autoview Advanced Indicator & AlertsWave & Trend Autoview Advanced Indicator & Alerts - Version 1.0
Overview
This Lazybear inspired indicator is a complex and deeply customisable wave based oscillator that allows for full customisation of parameters and 3 toggleable strategies to allow the user to shape their trading methods to their preferences. The indicator was built for use with Autoview using all functionality or in conjunction with Profit Trailer 2.0 to handle the buying side of logic at an even more advanced level. The creation of this was fuelled by the need to create a cheaper alternative to those that charge monthly for similar signals, which I am deeply against.
Features
Wave Based Buying - those familiar with buying based with RSI based approaches will feel very comfortable with this signal as it detects areas of deeply oversold / overbought and buys on the reversal
Fully customisation - All parameters are open for customising to allow the trader to build their own strategy and adapt from market to market
3 Built In Signal Strategies - Clearly labelled in the parameters as A/B/C are the built in strategies that all have completely unique buying / selling logic and are based on different risk / reward levels. Include all 3 or focus on one or two to build your perfect strategy
Downtrend Detection - This indicator has an in-built downtrend detection that is modifiable in the parameters meaning no more deep bags - the strategies will always try to buy on the uptrend.
Access
48H Trial Period By Request
Full Access is 0.15 ETH , one time fee for full unlimited access to the indicator and future updates but also my well received support and mentoring on my work afterwards to help you built a perfect strategy.
Previous owners of my work get 50% off the price for being one of my supporters.

RSI + Volume + Bias linesJust added lines for bullish / bearish bias regions to the indicator from LazyBear

Godmode3.2+LSMAThis script has been based on ProwdClown's instructions of usage.
GM settings 9, 6, 3 should be used, LSMA 25, 0 has been implemented.
Original author for main script: LazyBear, xSilas and Ni6HTH4wK, modified By sco77m4r7in and oh92, later modified By scilentor.


Squeeze CMF IndicatorI changed the indicator code of Lazybear to replace the linreg with the Chaikin money flow. I recommend using a Macd because the chaikin money flow can give false signals, like any other indicator.


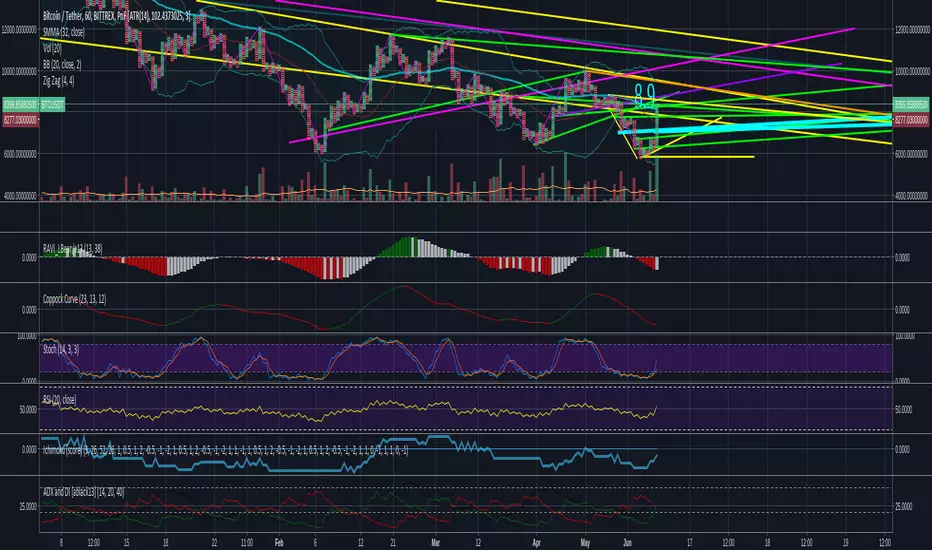
CryptoVN - All-in-One-Trend: Multiple IndicatorAs previous post, I have integrated some indicator in chart into a single package.
Now I'll share you another version : All-in-One-Trend: Multiple Indicator in a separate window.
These are the types of indicators in a separate window., so I called it "All-in-One-Trend".
Indicators included are listed below:
01. Commodity Channel Index (CCI)
02. HawkEye Volume by @LazyBear
03. Stochastic RSI
04. Double Sinewave
05. Woodies CCI
If you like and use this, tips and donations are always welcome. :)
Bitcoin: 3BMEXfdqNNmVmtHYvZ1HqMyXchAGLUrbqF
