Real Price for Heikin Ashi ChartsThe indicator is in the top left of the screen! That's all there is, by design.
This is a super simple indicator that allows you to see what the real price of a candle was when using Heikin Ashi charts, while not cluttering up your screen.
HA charts are a great way to help those who can be spooked by the chaos of the markets (I'm one!), but they have a big drawback in that the price you see on a HA candle is often significantly different from the real price that you would trade on. This brings issues of unrealistic expectations of profits/losses, and also makes back testing a strategy very difficult. I still wouldn't recommend ever using TradingView's "strategy" tool when using HA charts, but using this indicator you can do accurate manual back tests.
There's nothing plotted on the screen given that there's no real point in it, but you can make the lines appear if you wish - just go into settings and change the transparency.
The order of the numbers on the indicator match the OHLC (Open, High, Low, Close) format.
There's also settings to turn off one or more of the OHLC values, simply open the settings and go to Inputs. This could be useful for some people, as the High and Low values of HA candles are the same as regular candles. Only the Open and Close are different.
Any queries let me know.
DreamsDefined
Recherche dans les scripts pour "OHLC"

cooltoyz: ghost candleThis is a tool. Do with it what you like :)
The ghost candle works by drawing a bigger time frame candles in ghost mode over a chart. The time frame is default of 4h, can be changed in the "format" pop-up.
What we see in a time frame as the "wick", is really a set of candles when looked at lower resolutions/timeframes, that info is crunched into the OHLC format. But, when we look at a represntation of the "internals" of a candle, the wicks are not just a single candle that "walked out of the reservation".
So, in this ghost mode, a wick makes no sense visually. In this case, the OHLC is represented as a darker area for the main candle body, and lighter zones for the wicks. Just another way to sing the same song...
Note 1: the ghost candles are skewed, due to the way that TV plots a line. It's most visible when a chart is very zoomed.
Note 2:As result of the TV real time engine, the last candle presents sometimes mixed colors. There's no easy way to fix it, so until the candle closes, if you see weird colors, well, that's life :)

ValueChart Indicator [LazyBear]This indicator displays the trend-adjusted price activity of a security. It oscillates around the zero-line. It is usually plotted as OHLC, but Pine doesn't have this support yet. So, I have rendered OHLC separately (see chart for the details).
This indicator is particularly useful for ‘scalping’ in a sideways market, where there is limited movement taking place, rather than a trending market undergoing larger swing movements.
I am not sure how much this resembles the commercial indicator out there as I don't have access to one. This is a direct port of a similar TOS indicator.
Removed direct links.

cd_VW_CxOverview
The cd_VW_Cx is a sophisticated trend analysis tool designed to quantify market momentum using Multi-Period VWAP (Volume Weighted Average Price). Unlike standard indicators, this script evaluates the current price relationship across multiple historical VWAP anchors to generate a real-time "Confidence Score" ranging from -100 to +100.
💡 Key Features
• Dynamic Anchoring: Seamlessly switch between Daily, Weekly, or Monthly open anchors to align with your trading style (Scalping, Day Trading, or Swing).
• Algorithmic Scoring (The Score Box): The indicator compares the current VWAP against historical periods.
o Score > +70: Strong Bullish Momentum.
o Score < -70: Strong Bearish Momentum.
• Polyline Rendering: Utilizes Pine Script v6’s advanced polyline architecture for high-performance, sleek visual plotting that doesn't clutter your chart.
• Institutional Support/Resistance: Historical VWAP levels are color-coded, often acting as "invisible" magnetic zones where institutional orders are clustered.
🛠 How to Trade with cd_VW_Cx
1. Momentum Confirmation: Look for the Score Box to turn Teal (Bullish) or Red (Bearish). This indicates that the current trend has statistical backing from multiple previous sessions.
2. The Breakout Signal: The script tracks price crossovers of the current VWAP. A "Bullish Breakout" combined with a high score is a high-probability entry signal.
3. Visual Guidance: Use the custom labels to identify which specific day/week/month’s VWAP is currently being tested as support or resistance.
⚙️ Customizable Settings
• Anchor Selection: Choose the calculation basis (Daily, Weekly, Monthly).
• Thresholds: Adjust the sensitivity of the Bullish/Bearish alerts (Default is +/- 70).
• Visuals: Full control over table positioning, font sizes, and color palettes to match your chart theme.
📢 cd_VW_Cx: Multi-Period VWAP Scoring & Analysis Guide
🔍 Overview & Visual Logic
The labels next to the VWAP levels dynamically change based on your Anchor selection:
• Daily Open: Displays the Day Name (e.g., Monday, Tuesday).
• Weekly Open: Displays the Week Number (1 – 52).
• Monthly Open: Displays the Month Number (1 – 12).
•
General View:
________________________________________
🚦 How to Filter & Track Your Assets
You can monitor your favorite assets using two powerful methods:
1. Real-Time Alerts
Stay updated with TradingView notifications:
• Per Asset: Track a single pair.
• Watchlist Basis: Monitor your entire list at once. Alert Setup Guide:
2. Pine Screener Integration
Filter the market effortlessly using the Pine Screener. Pine Screener View:
________________________________________
⚙️ Settings & Configuration
• Timeframe Selection: Your chart timeframe must be lower than the selected Anchor timeframe. (e.g., If "Daily Open" is selected, the timeframe should be lower than 1D).
• Anchor Choice: Select Daily, Weekly, or Monthly opens.
• Source Selection: Default value is set to ohlc4. Source Settings:
Filtering Criteria Examples:
• Bullish Filtering: Find assets with high momentum scores.
• Bullish Breakout (Single Criteria): Filters assets that have closed above the current VWAP level.
• Combined Strength (Score + Breakout): Filters assets that have a Score > 70 AND a fresh VWAP Breakout simultaneously.
________________________________________
⚠️ Important Notes & Warnings
• Calculation Logic: The indicator calculates levels and scores on timeframes lower than the anchor. It is best used on timeframes that are close to but lower than the anchor.
• Avoid Extreme Gaps: Using a very low timeframe (e.g., 1m) with a very high anchor (e.g., Monthly) increases the risk of erroneous results.
• Optimization: The default score threshold of 70 is a starting point; I recommend adjusting it based on your own trading experience.
• The Power of Confluence: VWAP levels are naturally strong. Their significance increases when they coincide with institutional levels like PDH (Previous Day High), Session H/L, or HTF FVG.
• Experience Matters: A high score alone is not enough for an entry. Always combine this data with your personal strategy.
________________________________________
💬 Community & Feedback
I would love to hear your suggestions regarding the scoring logic or visual improvements! Feel free to share your thoughts in the comments.
Happy Trading! 🚀

Golden Volume Lines📌 Golden Volume — Lines (Golden Team)
Golden Volume — Lines is an advanced volume-based indicator that detects Ultra High Volume candles using a statistical percentile model, then automatically draws and tracks key price levels derived from those candles.
The indicator highlights where real market interest and liquidity appear and shows how price reacts when those levels are broken.
🔍 How It Works
Volume Measurement
Choose between:
Units (raw volume)
Money (Volume × Average Price)
Average price can be calculated using HL2 or OHLC4.
Percentile-Based Classification
Volume is classified into:
Medium
High
Ultra High Volume
Thresholds are calculated using a rolling percentile window.
Ultra Volume candles are colored orange.
Dynamic High & Low Levels
For every Ultra Volume candle:
A High and Low dotted line is drawn.
Lines extend to the right until price breaks them.
Smart Line Break Detection (Wick-Based)
A line is considered broken when price wicks through it.
When a break occurs:
🟧 Orange line → broken by an Ultra Volume candle
⚪ White line → broken by a normal candle
The line stops exactly at the breaking candle.
🔔 Alerts
Alert on Ultra High Volume candles
Alert when a High or Low line is broken
Separate alerts for:
Break by Ultra Volume candle
Break by Normal candle
🎯 Use Cases
Breakout & continuation confirmation
Liquidity sweep detection
Volume-validated support & resistance
Market reaction after extreme participation
⚙️ Key Inputs
Volume display mode (Units / Money)
Percentile thresholds
Lookback window size
Maximum number of active Ultra levels
Optional dynamic alerts
⚠️ Disclaimer
This indicator is a volume and market structure tool, not a standalone trading system.
Always use proper risk management and additional confirmation.

VB-MainLiteVB-MainLite – v1.0 Initial Release
Overview
VB-MainLite is a consolidated market-structure and execution framework designed to streamline decision-making into a single chart-level view. The script combines multi-timeframe trend, volatility, volume, and liquidity signals into one cohesive visual layer, reducing indicator clutter while preserving depth of information for active traders.
Core Architecture
Trend Backbone – EMA 200
Dedicated EMA 200 acts as the primary trend filter and higher-timeframe bias reference.
Serves as the “spine” of the system for contextualizing all secondary signals (swings, reversals, volume events, etc.).
Custom MA Suite (Envelope Ready)
Four configurable moving averages with flexible source, length, and smoothing.
Default configuration (preset idea: “8/89 Envelope”):
MA #1: EMA 8 on high
MA #2: EMA 8 on low
MA #3: EMA 89 on high
MA #4: EMA 89 on low
All four are disabled by default to keep the chart minimal. Users can toggle them on from the Custom MAs group for envelope or cloud-style configurations.
Nadaraya–Watson Smoother (Swing Framework)
Gaussian-kernel Nadaraya–Watson regression applied to price (hl2) to build a smooth synthetic curve.
Two layers of functionality:
Swing labels (▲ / ▼) at inflection points in the smoothed curve.
Optional curve line that visually tracks the turning structure over the last ~500 bars.
Designed to surface early swing potential before standard MAs react.
Hull Moving Average (Trend Overlay)
Optional Hull MA (HMA) for faster trend visualization.
Color-coded by slope (buy/sell bias).
Default: off to prevent overloading the chart; can be enabled under Hull MA settings.
Momentum, Exhaustion & Pattern Engine
CCI-Based Bar Coloring
CCI applied to close with configurable thresholds.
Overbought / oversold CCI zones map directly into candle coloring to visually highlight short-term momentum extremes.
RSI Top / Bottom Exhaustion Finder
RSI logic applied separately to high-driven (tops) and low-driven (bottoms) sequences.
Plots:
Top arrows where high-side RSI stretches into high-risk territory.
Bottom arrows where low-side RSI indicates exhaustion on the downside.
Useful as confluence around the Nadaraya swing turns and EMA 200 regime.
Engulfing + MA Trend Engine (“Fat Bull / Fat Bear”)
Detects bullish and bearish engulfing patterns, then combines them with MA trend cross logic.
Only when both pattern and MA regime align does the engine flag:
Fat Bull (Engulf + MA aligned long)
Fat Bear (Engulf + MA aligned short)
Candles are marked via conditional barcolor to highlight strong, structured shifts in control.
Fat Finger Detection (Wick Spikes / Stop Runs)
Identifies abnormal wick extensions relative to the prior bar’s body range with configurable tolerance.
Supports detection of potential liquidity grabs, stop runs, or “excess” that may precede reversals or mean-reversion behavior.
Volume & Liquidity Intelligence
Bull Snort (Aggressive Buy Spikes)
Flags events where:
Volume is significantly above the 50-period average, and
Price closes in the upper portion of the bar and above prior close.
Plots a labeled marker below the bar to indicate aggressive upside initiative by buyers.
Pocket Pivots (Accumulation Flags)
Compares current volume vs prior 10 sessions with a filter on prior “up” days.
Highlights pocket pivot days where current green candle volume outclasses recent down-day volumes, suggesting stealth accumulation.
Delta Volume Core (Directional Volume by Price)
Internal volume-by-price style engine over a user-defined lookback.
Splits volume into up-close and down-close buckets across dynamic price bins.
Feeds into S&R and ICT zone logic to quantify where buying vs selling pressure built up.
Structural Context: S&R and ICT Zones
S&R Power Channel
Computes local high/low band over a configurable lookback window.
Renders:
Upper and lower S&R channel lines.
Shaded support / resistance zones using boxes.
Adds Buy Power / Sell Power metrics based on the ratio of up vs down bars inside the window, displayed directly in the zone overlays.
Drops ◈ markers where price interacts dynamically with the top or bottom band, highlighting reaction points.
ICT-Style Premium / Discount & Macro Zones
Two tiered structures:
Local Premium / Discount zones over a shorter SR window.
Macro Premium / Discount zones over a longer macro window.
Each zone:
Uses underlying directional volume to annotate accumulation vs distribution bias.
Provides Delta Volume Bias shading in the mid-band region, visually encoding whether local power flows are net-buying or net-selling.
Enables traders to quickly see whether current trade location is in a local/macro discount or premium context while still respecting volume profile.
Positioning Intelligence: PCD (Stocks)
Position Cost Distribution (PCD) – Stocks Only
Available for stock symbols on intraday up to daily timeframe (≤ 1D).
Uses:
TOTAL_SHARES_OUTSTANDING fundamentals,
Daily OHLCV snapshot, and
A bucketed distribution engine
to approximate cost basis distribution across price.
Outputs:
Horizontal “PCD bars” to the right of current price, density-scaled by estimated share concentration.
Color-coding by profitability relative to current price (profitable vs unprofitable positions).
Labels for:
Current price
Average cost
Profit ratio (share % below current price)
90% cost range
70% cost range
Range overlap as a measure of clustering / concentration.
Multi-Timeframe Trend: Two-Pole Gaussian Dashboard
Two-Pole Gaussian Filter (Line + Cloud)
Smooths a user-selected source (default: close) using a two-pole Gaussian filter with tunable alpha.
Plots:
A thin Gaussian trend line, and
A thick Gaussian “cloud” line with transparency, colored by slope vs past (offsetG).
Functions as a responsive trend backbone that is more sensitive than EMA 200 but less noisy than raw price.
Multi-Timeframe Gaussian Dashboard
Evaluates Gaussian trend direction across up to six timeframes (e.g., 1H / 2H / 4H / Daily / Weekly).
Renders a compact bottom-right table:
Header: symbol + overall bias arrow (up / down) based on average trend alignment.
Row of colored cells per timeframe (green for uptrend, magenta for downtrend) with human-readable TF labels (e.g., “60M”, “4H”, “1D”).
Gives an immediate read on whether intraday, swing, and higher-timeframe flows are aligned or fragmented.
Default Configuration & Usage Guidance
Default state after adding the script:
Enabled by default:
EMA 200 trend backbone
Nadaraya–Watson swing labels and curve
CCI bar coloring
RSI top/bottom arrows
Fat Bull / Fat Bear engine
Bull Snort & Pocket Pivots
S&R Power Channel
ICT Local + Macro zones
Two-pole Gaussian line + cloud + dashboard
PCD engine for stocks (auto-active where data is available)
Disabled by default (opt-in):
Custom MA suite (4x MAs, preset as EMA 8/8/89/89)
Hull MA overlay
How traders can use VB-MainLite in practice:
Use EMA 200 + Gaussian dashboard to define top-down directional bias and avoid trading directly against multi-TF trend.
Use Nadaraya swing labels, RSI exhaustion arrows, and CCI bar colors to time entries within that higher-timeframe bias.
Use Fat Bull / Fat Bear events as structured confirmation that both pattern and MA regime have flipped in the same direction.
Use Bull Snort, Pocket Pivots, and S&R / ICT zones to align execution with liquidity, volume, and location (premium vs discount).
On stocks, use PCD as a positioning map to understand trapped supply, support zones near crowded cost basis, and where profit-taking is likely.

Cumulative Volume Delta CandlesCVD Trend Candles
Visualize buying and selling pressure directly on your price candles. This indicator colors your candlesticks based on Cumulative Volume Delta (CVD), helping you see the underlying order flow driving price action.
WHAT IS CVD?
Cumulative Volume Delta estimates the difference between aggressive buying and selling volume on each bar. Positive delta indicates more aggressive buying; negative delta indicates more aggressive selling.
COLOR METHODS
▸ CVD Raw
The simplest view—candles are colored based purely on the raw delta of each bar.
• Cyan = Positive delta (net buying)
• Red = Negative delta (net selling)
▸ Rule-Based (Default)
Uses Heikin Ashi-smoothed CVD candles with intensity based on trend strength:
• Bright colors = Strong conviction (larger body + continuation)
• Medium colors = Moderate conviction (continuation)
• Dark colors = Weak/indecision (inside candles, hesitation)
▸ Size-Based
Colors intensity based on z-score of delta changes:
• Bright colors = Statistically significant delta (above strong threshold)
• Medium colors = Moderate delta (above moderate threshold)
• Dark colors = Normal/quiet delta
KEY FEATURES
◆ Kalman Filter Smoothing
Adaptive filtering reduces noise while staying responsive to genuine shifts in order flow. Adjust sensitivity with the Responsiveness and Kalman Gain settings.
◆ Inside Candle Rule
When enabled, prevents false signals from inside candles that show a direction change but lack conviction. The candle retains the previous trend's color (dimmed) instead of flipping.
◆ Session Anchoring
Optionally reset cumulative delta at a specific time (e.g., market open) for intraday analysis.
◆ Z-Score Thresholds
Fine-tune what constitutes "strong" vs "moderate" delta activity for Size-Based coloring.
HOW TO USE
1. Add the indicator to your chart
2. Set your chart type to "Line" or bring the indicator to front via Visual Order → Bring to Front
3. Select your preferred Color Method
4. Look for:
• Sequences of bright cyan candles → Strong buying pressure / bullish momentum
• Sequences of bright red candles → Strong selling pressure / bearish momentum
• Fading colors → Weakening conviction, potential reversal or consolidation
• Color flips → Shift in order flow dominance
Notes
• This indicator estimates delta from OHLCV data. For true order flow analysis, consider using tick or trade data from your broker/exchange.
• Works on all timeframes and instruments with volume data.
• Best used in conjunction with support/resistance levels, market structure, or other confluence factors.

Order Flow AnalysisOrder Flow Pressure Suite — Wick, Volume & Absorption-Based Pressure Map
This indicator builds a composite buying/selling pressure score from candle structure, volume behavior, and absorption signals.
It is designed to infer the “intent” behind price moves by looking at how candles form, where they close, and how volume behaves — even without access to true bid/ask or footprint data.
Core Concepts
Wick-to-Body Analysis
The script evaluates the ratio of upper and lower wicks to the total candle range.
Strong wicks with relatively small bodies are treated as rejections :
Long upper wick → potential selling pressure / rejection of higher prices
Long lower wick → potential buying pressure / rejection of lower prices
Close Position Analysis
The close is normalized within the candle range:
Close near the high → bullish pressure
Close near the low → bearish pressure
Close near the middle → more neutral , context taken from wicks and volume
Volume Delta Estimation
Since true bid/ask data is not available on standard charts, the script estimates “volume delta” by distributing total volume between buyers and sellers based on candle characteristics:
Bull candles receive more “buying volume,” weighted toward closes near the high
Bear candles receive more “selling volume,” weighted toward closes near the low
This is an approximation of order flow, not a direct time & sales feed.
Absorption Detection
The script looks for candles where volume is high but price movement is relatively small .
This combination often suggests:
Bullish absorption → buyers absorbing aggressive selling (potential accumulation)
Bearish absorption → sellers absorbing aggressive buying (potential distribution)
Absorption zones are tracked over a configurable lookback and can be shaded in the background.
Composite Pressure Oscillator
All the above components (wicks, close position, heuristic volume delta, absorption bias) are blended into a single pressure score :
Values > 0 → net buying pressure
Values < 0 → net selling pressure
The raw score is smoothed with an EMA to reduce noise and create a cleaner oscillator line.
Divergence Detection
The indicator compares price pivots to pressure pivots:
Bullish divergence : price makes a lower low while pressure makes a higher low
Bearish divergence : price makes a higher high while pressure makes a lower high
These conditions can help highlight potential exhaustion or hidden participation from larger players.
Visual Elements
Histogram showing the intensity of buying/selling pressure
Color-coding for increasing vs. decreasing pressure
Background shading for detected absorption zones
Status table summarizing current pressure, trend bias, volume delta, wick signal, and absorption state in real time
How To Use
Use the pressure oscillator to gauge whether the current bar sequence is dominated by buyers or sellers. Strong positive readings may indicate sustained buying pressure; strong negatives may indicate sustained selling pressure.
Watch for divergences between price and the pressure oscillator around key levels, swings, or zones you already care about.
Use absorption zones and wick rejection signals as additional context around support/resistance, breakouts, or failed moves.
Treat all signals as context and confluence , not as stand-alone trade entries or exits. This tool is best used alongside your existing price action, volume, and risk management framework.
Important Notes & Limitations
This script does not access real bid/ask, footprint, or order book data . All volume delta and absorption interpretations are heuristic estimates derived from OHLCV candles.
Signals are probabilistic , not guarantees. They can be early, late, or outright wrong in fast or low-liquidity markets.
Always validate signals with your own analysis, timeframe alignment, and risk management. This indicator is intended as an analytical tool , not financial advice.

X rVPoCOverview
The rVPoC indicator isolates and displays the Volume Point of Control — the price level within a chosen lookback window that has accumulated the highest traded volume.
Unlike typical volume profiles that analyze an entire session or day, this version is designed for rolling intraday precision. It continually updates the VPoC using data from a lower “zoomed-in” timeframe (e.g., 1-minute) to refine accuracy, even when viewed on higher-timeframe charts.
How It Works
At its core, the indicator “zooms in” via Pine Script’s multi-timeframe engine:
Lower timeframe aggregation:
A secondary (zoomed) timeframe — by default 1-minute — is used to pull detailed OHLCV data through request.security().
Rolling window analysis:
The user-defined bars_per_current parameter determines how many of those lower-timeframe bars to include (e.g., 15 → a 15-minute rolling window).
Volume binning:
The high-to-low range of that window is divided into evenly spaced price bins (vp_price_levels). Each bin accumulates the volume of trades overlapping its range.
Point of Control selection:
The bin with the greatest accumulated volume is located, and its volume-weighted midpoint is plotted as the VPoC.
Visual output:
Discrete line-break markers are plotted for each bar, preventing the “connecting line” distortions common in continuous plots.
Use Case
This indicator is ideal for intraday traders who want to:
Track how the most active traded price shifts over time.
Identify short-term value zones forming within a 15-minute (or custom) rolling range.
Observe micro-structure behavior during developing sessions without committing to full volume profile tools.
Overlay a lightweight VPoC on top of other tools such as open-range or VWAP-based frameworks.
It is particularly effective on 1-minute and 5-minute charts, providing a granular yet efficient measure of volume concentration that updates bar-by-bar.
Summary
The VPoC indicator delivers a continuously updating micro-profile of where trading volume is most active within a chosen intraday window.
It’s designed to complement range, VWAP, and order-flow analysis by highlighting evolving value zones without visual clutter or session-anchoring logic.
Traders can interpret shifts in the VPoC as changes in short-term control — where buyers or sellers are concentrating their activity within the evolving price structure.

Quantum Flux Universal Strategy Summary in one paragraph
Quantum Flux Universal is a regime switching strategy for stocks, ETFs, index futures, major FX pairs, and liquid crypto on intraday and swing timeframes. It helps you act only when the normalized core signal and its guide agree on direction. It is original because the engine fuses three adaptive drivers into the smoothing gains itself. Directional intensity is measured with binary entropy, path efficiency shapes trend quality, and a volatility squash preserves contrast. Add it to a clean chart, watch the polarity lane and background, and trade from positive or negative alignment. For conservative workflows use on bar close in the alert settings when you add alerts in a later version.
Scope and intent
• Markets. Large cap equities and ETFs. Index futures. Major FX pairs. Liquid crypto
• Timeframes. One minute to daily
• Default demo used in the publication. QQQ on one hour
• Purpose. Provide a robust and portable way to detect when momentum and confirmation align, while dampening chop and preserving turns
• Limits. This is a strategy. Orders are simulated on standard candles only
Originality and usefulness
• Unique concept or fusion. The novelty sits in the gain map. Instead of gating separate indicators, the model mixes three drivers into the adaptive gains that power two one pole filters. Directional entropy measures how one sided recent movement has been. Kaufman style path efficiency scores how direct the path has been. A volatility squash stabilizes step size. The drivers are blended into the gains with visible inputs for strength, windows, and clamps.
• What failure mode it addresses. False starts in chop and whipsaw after fast spikes. Efficiency and the squash reduce over reaction in noise.
• Testability. Every component has an input. You can lengthen or shorten each window and change the normalization mode. The polarity plot and background provide a direct readout of state.
• Portable yardstick. The core is normalized with three options. Z score, percent rank mapped to a symmetric range, and MAD based Z score. Clamp bounds define the effective unit so context transfers across symbols.
Method overview in plain language
The strategy computes two smoothed tracks from the chart price source. The fast track and the slow track use gains that are not fixed. Each gain is modulated by three drivers. A driver for directional intensity, a driver for path efficiency, and a driver for volatility. The difference between the fast and the slow tracks forms the raw flux. A small phase assist reduces lag by subtracting a portion of the delayed value. The flux is then normalized. A guide line is an EMA of a small lead on the flux. When the flux and its guide are both above zero, the polarity is positive. When both are below zero, the polarity is negative. Polarity changes create the trade direction.
Base measures
• Return basis. The step is the change in the chosen price source. Its absolute value feeds the volatility estimate. Mean absolute step over the window gives a stable scale.
• Efficiency basis. The ratio of net move to the sum of absolute step over the window gives a value between zero and one. High values mean trend quality. Low values mean chop.
• Intensity basis. The fraction of up moves over the window plugs into binary entropy. Intensity is one minus entropy, which maps to zero in uncertainty and one in very one sided moves.
Components
• Directional Intensity. Measures how one sided recent bars have been. Smoothed with RMA. More intensity increases the gain and makes the fast and slow tracks react sooner.
• Path Efficiency. Measures the straightness of the price path. A gamma input shapes the curve so you can make trend quality count more or less. Higher efficiency lifts the gain in clean trends.
• Volatility Squash. Normalizes the absolute step with Z score then pushes it through an arctangent squash. This caps the effect of spikes so they do not dominate the response.
• Normalizer. Three modes. Z score for familiar units, percent rank for a robust monotone map to a symmetric range, and MAD based Z for outlier resistance.
• Guide Line. EMA of the flux with a small lead term that counteracts lag without heavy overshoot.
Fusion rule
• Weighted sum of the three drivers with fixed weights visible in the code comments. Intensity has fifty percent weight. Efficiency thirty percent. Volatility twenty percent.
• The blend power input scales the driver mix. Zero means fixed spans. One means full driver control.
• Minimum and maximum gain clamps bound the adaptive gain. This protects stability in quiet or violent regimes.
Signal rule
• Long suggestion appears when flux and guide are both above zero. That sets polarity to plus one.
• Short suggestion appears when flux and guide are both below zero. That sets polarity to minus one.
• When polarity flips from plus to minus, the strategy closes any long and enters a short.
• When flux crosses above the guide, the strategy closes any short.
What you will see on the chart
• White polarity plot around the zero line
• A dotted reference line at zero named Zen
• Green background tint for positive polarity and red background tint for negative polarity
• Strategy long and short markers placed by the TradingView engine at entry and at close conditions
• No table in this version to keep the visual clean and portable
Inputs with guidance
Setup
• Price source. Default ohlc4. Stable for noisy symbols.
• Fast span. Typical range 6 to 24. Raising it slows the fast track and can reduce churn. Lowering it makes entries more reactive.
• Slow span. Typical range 20 to 60. Raising it lengthens the baseline horizon. Lowering it brings the slow track closer to price.
Logic
• Guide span. Typical range 4 to 12. A small guide smooths without eating turns.
• Blend power. Typical range 0.25 to 0.85. Raising it lets the drivers modulate gains more. Lowering it pushes behavior toward fixed EMA style smoothing.
• Vol window. Typical range 20 to 80. Larger values calm the volatility driver. Smaller values adapt faster in intraday work.
• Efficiency window. Typical range 10 to 60. Larger values focus on smoother trends. Smaller values react faster but accept more noise.
• Efficiency gamma. Typical range 0.8 to 2.0. Above one increases contrast between clean trends and chop. Below one flattens the curve.
• Min alpha multiplier. Typical range 0.30 to 0.80. Lower values increase smoothing when the mix is weak.
• Max alpha multiplier. Typical range 1.2 to 3.0. Higher values shorten smoothing when the mix is strong.
• Normalization window. Typical range 100 to 300. Larger values reduce drift in the baseline.
• Normalization mode. Z score, percent rank, or MAD Z. Use MAD Z for outlier heavy symbols.
• Clamp level. Typical range 2.0 to 4.0. Lower clamps reduce the influence of extreme runs.
Filters
• Efficiency filter is implicit in the gain map. Raising efficiency gamma and the efficiency window increases the preference for clean trends.
• Micro versus macro relation is handled by the fast and slow spans. Increase separation for swing, reduce for scalping.
• Location filter is not included in v1.0. If you need distance gates from a reference such as VWAP or a moving mean, add them before publication of a new version.
Alerts
• This version does not include alertcondition lines to keep the core minimal. If you prefer alerts, add names Long Polarity Up, Short Polarity Down, Exit Short on Flux Cross Up in a later version and select on bar close for conservative workflows.
Strategy has been currently adapted for the QQQ asset with 30/60min timeframe.
For other assets may require new optimization
Properties visible in this publication
• Initial capital 25000
• Base currency Default
• Default order size method percent of equity with value 5
• Pyramiding 1
• Commission 0.05 percent
• Slippage 10 ticks
• Process orders on close ON
• Bar magnifier ON
• Recalculate after order is filled OFF
• Calc on every tick OFF
Honest limitations and failure modes
• Past results do not guarantee future outcomes
• Economic releases, circuit breakers, and thin books can break the assumptions behind intensity and efficiency
• Gap heavy symbols may benefit from the MAD Z normalization
• Very quiet regimes can reduce signal contrast. Use longer windows or higher guide span to stabilize context
• Session time is the exchange time of the chart
• If both stop and target can be hit in one bar, tie handling would matter. This strategy has no fixed stops or targets. It uses polarity flips for exits. If you add stops later, declare the preference
Open source reuse and credits
• None beyond public domain building blocks and Pine built ins such as EMA, SMA, standard deviation, RMA, and percent rank
• Method and fusion are original in construction and disclosure
Legal
Education and research only. Not investment advice. You are responsible for your decisions. Test on historical data and in simulation before any live use. Use realistic costs.
Strategy add on block
Strategy notice
Orders are simulated by the TradingView engine on standard candles. No request.security() calls are used.
Entries and exits
• Entry logic. Enter long when both the normalized flux and its guide line are above zero. Enter short when both are below zero
• Exit logic. When polarity flips from plus to minus, close any long and open a short. When the flux crosses above the guide line, close any short
• Risk model. No initial stop or target in v1.0. The model is a regime flipper. You can add a stop or trail in later versions if needed
• Tie handling. Not applicable in this version because there are no fixed stops or targets
Position sizing
• Percent of equity in the Properties panel. Five percent is the default for examples. Risk per trade should not exceed five to ten percent of equity. One to two percent is a common choice
Properties used on the published chart
• Initial capital 25000
• Base currency Default
• Default order size percent of equity with value 5
• Pyramiding 1
• Commission 0.05 percent
• Slippage 10 ticks
• Process orders on close ON
• Bar magnifier ON
• Recalculate after order is filled OFF
• Calc on every tick OFF
Dataset and sample size
• Test window Jan 2, 2014 to Oct 16, 2025 on QQQ one hour
• Trade count in sample 324 on the example chart
Release notes template for future updates
Version 1.1.
• Add alertcondition lines for long, short, and exit short
• Add optional table with component readouts
• Add optional stop model with a distance unit expressed as ATR or a percent of price
Notes. Backward compatibility Yes. Inputs migrated Yes.

ADAM Projection - Efficiency Ratio Adaptive)Overview
The ADAM Projection is a visualization of how a price path might extend from its recent motion, expressed as a continuation (trend reflection) or anti-trend (mean reversion) pattern. This indicator expands upon Jim Sloman’s original ADAM projection—introduced in “The Adam Theory of Markets or What Matters Is Profit” (1983)—by adding a modern quantitative framework for Efficiency Ratio (ER) weighting, time-scaled path normalization, and smooth blending between continuation and anti-trend projections.
What Is the ADAM Theory?
Jim Sloman’s original ADAM projection was designed to model pure trend continuation. He proposed that every market motion could be mirrored around a central anchor price (the “Adam line”), effectively reflecting past price movements forward in time to visualize what a continuation of the same geometric path would look like. This reflection concept captured the idea that market structure exhibits self-similarity and that price trends often extend symmetrically beyond recent pivots.
How This Script Extends It
This version generalizes Sloman’s concept by introducing an adjustable blend between continuation (reflection) and anti-trend (forward paste) behavior, weighted by an adaptive ER domain.
Anchor Axis
The reflection axis (anchorPrice) can be Close, HL2, HLC3, or OHLC4.
The projection is drawn forward from this anchor for a user-defined horizon (len bars).
Dual Paths
Continuation (Reflection): Mirrors historical closes across the anchor.
Anti-trend (Forward Paste): Extends historical closes directly forward without inversion.
Efficiency Ratio (ER)
The Efficiency Ratio measures how directional recent price movement has been: ER = |Net Change| / Σ|Δi|
Values near +1 indicate strong directionality (favoring continuation); values near 0 indicate noise or consolidation (favoring anti-trend behavior).
Signed ER Normalization
ER values are mapped into a user-defined domain between erMin and erMax, with:
erSharp (γ) controlling the steepness of the blend curve
erFloor providing stability when ER ≈ 0
beta (β) weighting volatility across time (β = 0.5 approximates √time scaling)
Blended Projection
Each projected point is a weighted combination of the two paths: y_proj = (1 − w) * y_fade + w * y_cont
The blend factor w is derived from the normalized ER domain and gamma shaping, producing a smooth morph between the anti-trend and continuation geometries.
Visualization
The teal projection line shows the dynamically blended continuation/anti-trend forecast for the next len bars.
The gray anchor line marks the reflection axis.
Each segment adapts in real time based on ER magnitude and recent path structure.
Key Parameters
Core: len, anchorPrice, lineThin — projection horizon and appearance
Lines: showProj, colProj — show or recolor projection
ER Domain: erMin, erMax, erSharp, erFloor, beta — control domain scaling, shaping, and time weighting
Practical Use
High ER values emphasize continuation (trend-following behavior).
Low or negative ER values emphasize fading or mean reversion.
The projection helps visualize whether recent structure supports trend persistence or weakening.
Interpretation
The ADAM Projection is not a predictive indicator but a geometric tool for studying market symmetry and efficiency. It provides a structured way to visualize how recent movements would look if extended forward under both continuation and anti-trend assumptions. This blends Sloman’s original reflection concept with modern ER-based adaptivity.
Summary
Origin: Jim Sloman (1983) — trend continuation via reflection symmetry.
Extension: Adds ER-driven blending to model both continuation and anti-trend regimes.
Concept: Price reflection vs. direct forward extension.
Purpose: Study of geometric price symmetry and efficiency, not a trade signal.

Wickless Heikin Ashi B/S [CHE]Wickless Heikin Ashi B/S \
Purpose.
Wickless Heikin Ashi B/S \ is built to surface only the cleanest momentum turns: it prints a Buy (B) when a bullish Heikin-Ashi candle forms with virtually no lower wick, and a Sell (S) when a bearish Heikin-Ashi candle forms with no upper wick. Optional Lock mode turns these into one-shot signals that hold the regime (bull or bear) until the opposite side appears. The tool can also project dashed horizontal lines from each signal’s price level to help you manage entries, stops, and partial take-profits visually.
How it works.
The indicator computes standard Heikin-Ashi values from your chart’s OHLC. A bar qualifies as bullish if its HA close is at or above its HA open; bearish if below. Then the wick on the relevant side is compared to the bar’s HA range. If that wick is smaller than your selected percentage threshold (plus a tiny tick epsilon to avoid rounding noise), the raw condition is considered “wickless.” Only one side can fire; on the rare occasion both raw conditions would overlap, the bar is ignored to prevent false dual triggers. When Lock is enabled, the first valid signal sets the active regime (background shaded light green for bull, light red for bear) and suppresses further same-side triggers until the opposite side appears, which helps reduce overtrading in chop.
Why wickless?
A missing wick on the “wrong” side of a Heikin-Ashi candle is a strong hint of persistent directional pressure. In practice, this filters out hesitation bars and many mid-bar flips. Traders who prefer entering only when momentum is decisive will find wickless bars useful for timing entries within an established bias.
Visuals you get.
When a valid buy appears, a small triangle “B” is plotted below the bar and a green dashed line can extend to the right from the signal’s HA open price. For sells, a triangle “S” above the bar and a red dashed line do the same. These lines act like immediate, price-anchored references for stop placement and profit scaling; you can shift the anchor left by a chosen number of bars if you prefer the line to start a little earlier for visual alignment.
How to trade it
Establish context first.
Pick a timeframe that matches your style: intraday index or crypto traders often use 5–60 minutes; swing traders might prefer 2–4 hours or daily. The tool is agnostic, but the cleanest results occur when the market is already trending or attempting a fresh breakout.
Entry.
When a B prints, the simplest rule is to enter long at or just after bar close. A conservative variation is to require price to take out the high of the signal bar in the next bar(s). For S, invert the logic: enter short on or after close, or only if price breaks the signal bar’s low.
Stop-loss.
Place the stop beyond the opposite extreme of the signal HA bar (for B: under the HA low; for S: above the HA high). If you prefer a static reference, use the dashed line level (signal HA open) or an ATR buffer (e.g., 1.0–1.5× ATR(14)). The goal is to give the trade enough room that normal noise does not immediately knock you out, while staying small enough to keep the risk contained.
Take-profit and management.
Two pragmatic approaches work well:
R-multiple scaling. Define your initial risk (distance from entry to stop). Scale out at 1R, 2R, and let a runner go toward 3R+ if structure holds.
Trailing logic. Trail behind a short moving average (e.g., EMA 20) or progressive swing points. Many traders also exit on the opposite signal when Lock flips, especially on faster timeframes.
Position sizing.
Keep risk per trade modest and consistent (e.g., 0.25–1% of account). The indicator improves timing; it does not replace risk control.
Settings guidance
Max lower wick for Bull (%) / Max upper wick for Bear (%).
These control how strict “wickless” must be. Tighter values (0.3–1.0%) yield fewer but cleaner signals and are great for strong trends or low-noise instruments. Looser values (1.5–3.0%) catch more setups in volatile markets but admit more noise. If you notice too many borderline bars triggering during high-volatility sessions, increase these thresholds slightly.
Lock (one-shot until opposite).
Keep Lock ON when you want one decisive signal per leg, reducing noise and signal clusters. Turn it OFF only if your plan intentionally scales into trends with multiple entries.
Extended lines & anchor offset.
Leave lines ON to maintain a visual memory of the last trigger levels. These often behave like near-term support/resistance. The offset simply lets you start that line one or more bars earlier if you prefer the look; it does not change the math.
Colors.
Use distinct bull/bear line colors you can read easily on your theme. The default lime/red scheme is chosen for clarity.
Practical examples
Momentum continuation (long).
Price is above your baseline (e.g., EMA 200). A B prints with a tight lower wick filter. Enter on close; stop under the signal HA low. Price pushes up in the next bars; you scale at 1R, trail the rest with EMA 20, and finally exit when a distant S appears or your trail is hit.
Breakout confirmation (short).
Following a range, price breaks down and prints an S with no upper wick. Enter short as the bar closes or on a subsequent break of the signal bar’s low. If the next bar immediately rejects and prints a bullish HA bar, your stop above the signal HA high limits damage. Otherwise, ride the move, harvesting partials as the red dashed line remains unviolated.
Alerts and automation
Set alerts to “Once Per Bar Close” for stability.
Bull ONE-SHOT fires when a valid buy prints (and Lock allows it).
Bear ONE-SHOT fires for sells analogously.
With Lock enabled, you avoid multiple pings in the same direction during a single leg—useful for webhooks or mobile notifications.
Reliability and limitations
The script calculates from completed bars and does not use higher-timeframe look-ahead or repainting tricks. Heikin-Ashi smoothing can lag turns slightly, which is expected and part of the design. In narrow ranges or whipsaw conditions, signals naturally thin out; if you must trade ranges, either tighten the wick filters and keep Lock ON, or add a trend/volatility filter (e.g., trade B only above EMA 200; S only below). Remember: this is an indicator, not a strategy. If you want exact statistics, port the triggers into a strategy and backtest with your chosen entry, stop, and exit rules.
Final notes
Wickless Heikin Ashi B/S \ is a precision timing tool: it waits for decisive, wickless HA bars, provides optional regime locking to reduce noise, and leaves clear price anchors on your chart for disciplined management. Use it with a simple framework—trend bias, fixed risk, and a straightforward exit plan—and it will keep your execution consistent without cluttering the screen or your decision-making.
Disclaimer: This indicator is for educational use and trade assistance only. It is not financial advice. You alone are responsible for your risk and results.
Enhance your trading precision and confidence with Wickless Heikin Ashi B/S ! 🚀
Happy trading
Chervolino

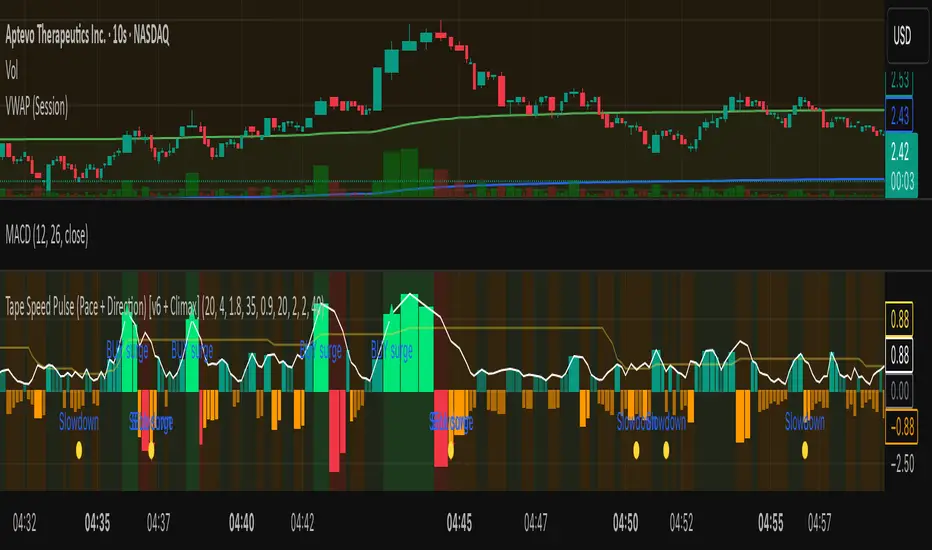
Tape Speed Pulse (Pace + Direction) [v6 + Climax]Tape Speed Pulse (Pace + Direction)
One-liner:
A lightweight “tape pulse” that turns intraday bursts of buying/selling into an easy-to-read histogram, with surge, slowdown, and climax (exhaustion) markers for fast decision-making. Use on sec and min charts.
What it measures
Pace (RVOL): current bar volume vs the recent average (smoothed).
Direction proxy: uptick/downtick by comparing close to close .
Pulse (histogram): direction × pace, so you see who’s pushing and how fast.
Colors
- Lime = Buy surge (pace ≥ threshold & upticking)
- Red = Sell surge (pace ≥ threshold & downticking)
- Teal = Buy pressure, sub-threshold
- Orange = Sell pressure, sub-threshold
- Faded/gray = Near-neutral pace (below the Neutral Band)
Lines (toggleable)
-White = Pace (RVOL)
- Yellow = Slowdown line = a drop of X% from the last 30-bar peak pace
Background tint mirrors the current state so you can glance risk: greenish for buy pressure, reddish for sell pressure.
Signals & alerts
- BUY surge – fires when pace crosses above the surge threshold with uptick direction (optional acceleration & uptick streak filters; cooldown prevents spam).
- SELL surge – mirror logic to downside.
- Slowdown – fires when pace crosses below the yellow slowdown line while direction ≤ 0 (early fade warning).
Climax (exhaustion)
- Buy Climax: previous bar was a buy surge with a large upper wick; current bar slows (below slowdown line) and direction ≤ 0.
- Sell Climax: mirror (large lower wick → slowdown → direction ≥ 0).
- Great for trimming/tight stops or fade setups at obvious spikes.
- Create alerts via Add alert → Condition: this indicator → choose the specific alert (BUY surge, SELL surge, Slowdown, Buy Climax, Sell Climax).
How to use it (playbook)
- Longs (e.g., VWAP reclaim / micro pullback)
- Only take entries when the pulse is teal→lime (buy pressure to buy surge).
- Into prior highs/VWAP bands, take partials on lime spikes.
- If you get a Slowdown dot and bars turn orange/red, tighten or exit.
Shorts (failed reclaim / lower-high)
- Look for teal→orange→red with rising pace at a level.
- Add confidence if a Buy Climax printed right before (exhaustion).
- Risk above the spike; don’t fight true ignitions out of bases.
Simple guardrails
- Avoid new longs when the histogram is orange/red; avoid new shorts when teal/lime.
- Use with VWAP + 9/20 EMA or your levels. The pulse is confirmation, not the whole thesis.
Inputs (what they do & when to tweak)
- Pace lookback (bars) – window for average volume. Lower = faster; higher = steadier.
Too jumpy? raise it. Missing quick bursts? lower it.
- Smoothing EMA (bars) – smooths pace. Higher = calmer.
Use 4–6 during the open; 3–4 midday.
- Surge threshold (× RVOL) – how fast counts as a surge.
Too many surges? raise it. Too late? lower it slightly.
- Slowdown drop from 30-bar max (%) – how far below the recent peak pace to call a slowdown.
Higher % = later slowdown; lower % = earlier warning.
- Neutral band (× RVOL) – paces below this fade to gray.
Raise to clean up noise; lower to see subtle pressure.
- Min seconds between signals – cooldown to prevent spam.
Increase in chop; reduce if you want more pings.
- BUY/SELL: min consecutive upticks/downticks – tiny streak filter.
Raise to avoid wiggles; lower for earlier signals.
Require pace accelerating into signal – ON = avoid stall breakouts; OFF = earlier pings.
Climax options: wick % threshold & “require slowdown cross”.
Raise wick% / require cross to be stricter; lower to catch more fades.
Quick presets
- Low-float runner, 5–10s chart
- Lookback 20, Smoothing 3–4, Surge 2.2–2.8, Slowdown 35–45, Neutral 1.0–1.2, Cooldown 15–25s, Streaks 2–3, Accel ON.
- Thick large-cap, 1-min
- Lookback 20–30, Smoothing 5–7, Surge 1.5–1.9, Slowdown 25–35, Neutral 0.8–1.0, Cooldown 30–60s, Streaks 2, Accel ON.
- Open vs Midday vs Power Hour
- Open: higher Surge, more Smoothing, longer Cooldown.
- Midday: lower Surge, less Smoothing to catch subtler pushes.
- Power hour: moderate Surge; keep Slowdown on for exits.
Reading common patterns
- Ignition (likely continuation): lime spike out of a base that holds above a level while pace stays above yellow.
- Exhaustion (likely fade): lime spike late in a run with upper wick → Slowdown → orange/red. The Buy Climax diamond is your tell.
Limits / notes
This is an OHLCV-based proxy (TradingView Pine can’t read raw tape/DOM). It won’t match Bookmap/Jigsaw tick-for-tick, but it’s fast and objective.
Use with levels and a risk plan. Past performance ≠ future results. Educational only.
Liquidity Void Detector (Zeiierman)█ Overview
Liquidity Void Detector (Zeiierman) is an oscillator highlighting inefficient price displacements under low participation. It measures the most recent price move (standardized return) and amplifies it only when volume is below its own trend.
Positive readings ⇒ strong up-move on low volume → potential Buy-Side Imbalance (void below) that often refills.
Negative readings ⇒ strong down-move on low volume → potential Sell-Side Imbalance (void above) that often refills.
This tool provides a quantitative “void” proxy: when price travels far with unusually thin volume, the move is flagged as likely inefficient and prone to mean-reversion/mitigation.
█ How It Works
⚪ Volume Shock (Participation Filter)
Each bar, volume is compared to a rolling baseline. This is then z-scored.
// Volume Shock calculation
volTrend = ta.sma(volume, L)
vs = (volume > 0 and volTrend > 0) ? math.log(volume) - math.log(volTrend) : na
vsZ = zScore(vs, vzLen) // z-scored volume shock
lowVS = (vsZ <= vzThr) // low-volume condition
Bars with VolShock Z ≤ threshold are treated as low-volume (thin).
⚪ Prior Return Extremeness
The 1-bar log return is computed and z-scored.
// Prior return extremeness
r1 = math.log(close / close )
retZ = zScore(r1, rLen) // z-scored prior return
This shows whether the latest move is unusually large relative to recent history.
⚪ Void Oscillator
The oscillator is:
// Oscillator construction
weight = lowVS ? 1.0 : fadeNoLow
osc = retZ * weight
where Weight = 1 when volume is low, otherwise fades toward a user-set factor (0–1).
Osc > 0: up-move emphasized under low volume ⇒ Buy-Side Imbalance.
Osc < 0: down-move emphasized under low volume ⇒ Sell-Side Imbalance.
█ Why Use It
⚪ Targets Inefficient Moves
By filtering for low participation, the oscillator focuses on moves most likely driven by thin books/noise trading, which are statistically more likely to retrace.
⚪ Simple, Robust Logic
No need for tick data or order-book depth. It derives a practical void proxy from OHLCV, making it portable across assets and timeframes.
⚪ Complements Price-Action Tools
Use alongside FVG/imbalance zones, key levels, and volume profile to prioritize voids that carry the highest reversal probability.
█ How to Use
Sell-Side Imbalance = aggressive sell move (price goes down on low volume) → expect price to move up to fill it.
Buy-Side Imbalance = aggressive buy move (price goes up on low volume) → expect price to move down to fill it.
█ Settings
Volume Baseline Length — Bars for the volume trend used in VolShock. Larger = smoother baseline, fewer low-volume flags.
Vol Shock Z-Score Lookback — Bars to standardize VolShock; larger = smoother, fewer extremes.
Low-Volume Threshold (VolShock Z ≤) — Defines “thin participation.” Typical: −0.5 to −1.0.
Return Z-Score Lookback — Bars to standardize the 1-bar log return; larger = smoother “extremeness” measure.
Fade When Volume Not Low (0–1) — Weight applied when volume is not low. 0.00 = ignore non-low-volume bars entirely. 1.00 = treat volume condition as irrelevant (pure return extremeness).
Upper Threshold (Osc ≥) — Trigger for Sell-Side Imbalance (void below).
Lower Threshold (Osc ≤) — Trigger for Buy-Side Imbalance (void above).
-----------------
Disclaimer
The content provided in my scripts, indicators, ideas, algorithms, and systems is for educational and informational purposes only. It does not constitute financial advice, investment recommendations, or a solicitation to buy or sell any financial instruments. I will not accept liability for any loss or damage, including without limitation any loss of profit, which may arise directly or indirectly from the use of or reliance on such information.
All investments involve risk, and the past performance of a security, industry, sector, market, financial product, trading strategy, backtest, or individual's trading does not guarantee future results or returns. Investors are fully responsible for any investment decisions they make. Such decisions should be based solely on an evaluation of their financial circumstances, investment objectives, risk tolerance, and liquidity needs.

Intraday Volume Pulse GSK-VIZAG-AP-INDIAIntraday Volume Pulse Indicator
Overview
This indicator is designed to track and visualize intraday volume dynamics during a user-defined trading session. It calculates and displays key volume metrics such as buy volume, sell volume, cumulative delta (difference between buy and sell volumes), and total volume. The data is presented in a customizable table overlay on the chart, making it easy to monitor volume pulses throughout the session. This can help traders identify buying or selling pressure in real-time, particularly useful for intraday strategies.
The indicator resets its calculations at the start of each new day and only accumulates volume data from the specified session start time onward. It uses simple logic to classify volume as buy or sell based on candle direction:
Buy Volume: Assigned to green (up) candles or half of neutral (doji) candles.
Sell Volume: Assigned to red (down) candles or half of neutral (doji) candles.
All calculations are approximate and based on available volume data from the chart. This script does not incorporate external data sources, order flow, or tick-level information—it's purely derived from standard OHLCV (Open, High, Low, Close, Volume) bars.
Key Features
Session Customization: Define the start time of your trading session (e.g., market open) and select from common timezones like Asia/Kolkata, America/New_York, etc.
Volume Metrics:
Buy Volume: Total volume attributed to bullish activity.
Sell Volume: Total volume attributed to bearish activity.
Cumulative Delta: Net difference (Buy - Sell), highlighting overall market bias.
Total Volume: Sum of all volume during the session.
Formatted Display: Volumes are formatted for readability (e.g., in thousands "K", lakhs "L", or crores "Cr" for large numbers).
Color-Coded Table: Uses a patriotic color scheme inspired by general themes (Saffron, White, Green) with dynamic backgrounds based on positive/negative values for quick visual interpretation.
Table Options: Toggle visibility and position (top-right, top-left, etc.) for a clean chart layout.
How to Use
Add to Chart: Apply this indicator to any symbol's chart (works best on intraday timeframes like 1-min, 5-min, or 15-min).
Configure Inputs:
Session Start Hour/Minute: Set to your market's open time (default: 9:15 for Indian markets).
Timezone: Choose the appropriate timezone to align with your trading hours.
Show Table: Enable/disable the metrics table.
Table Position: Place the table where it doesn't obstruct your view.
Interpret the Table:
Monitor for spikes in buy/sell volume or shifts in cumulative delta.
Positive delta (green) suggests buying pressure; negative (red) suggests selling.
Use alongside price action or other indicators for confirmation—e.g., high total volume with positive delta could indicate bullish momentum.
Limitations:
Volume classification is heuristic and not based on actual order flow (e.g., it splits doji volume evenly).
Data accumulation starts from the session time and resets daily; historical backtesting may be limited by the max_bars_back=500 setting.
This is for educational and visualization purposes only—do not use as sole basis for trading decisions.
Calculation Details
Session Filter: Uses timestamp() to define the session start and filters bars with time >= sessionStart.
New Day Detection: Resets volumes on daily changes via ta.change(time("D")).
Volume Assignment:
Buy: Full volume if close > open; half if close == open.
Sell: Full volume if close < open; half if close == open.
Cumulative Metrics: Accumulated only during the session.
Formatting: Custom function f_format() scales large numbers for brevity.
Disclaimer
This script is for educational and informational purposes only. It does not provide financial advice or signals to buy/sell any security. Always perform your own analysis and consult a qualified financial professional before making trading decisions.
© 2025 GSK-VIZAG-AP-INDIA

Delta Volume BubblesDelta Volume Bubbles
Overview
The Delta Volume Bubbles indicator is an advanced order flow visualization tool that displays buying and selling pressure through dynamic bubble representations on your chart. Unlike traditional volume indicators that only show total volume, this indicator calculates the net delta volume (difference between buying and selling volume) and presents it as color-coded bubbles of varying sizes.
How It Works
Core Calculation Method
The indicator uses a sophisticated approach to estimate delta volume from standard OHLCV data:
1. Price Action Analysis: Analyzes the relationship between open, high, low, and close prices to determine market aggression
2. Body Ratio Calculation: body_ratio = |close - open| / (high - low)
3. Aggressive Factor: Applies multipliers based on price action:
- Strong moves (body_ratio > 0.7): 1.5x multiplier
- Moderate moves (body_ratio > 0.4): 1.2x multiplier
- Weak moves: 1.0x multiplier
4. Delta Volume Estimation:
- Buy Volume: price_change > 0 ? volume × aggressive_factor : 0
- Sell Volume: price_change < 0 ? volume × aggressive_factor : 0
- Net Delta: buy_volume - sell_volume
5. Delta Strength Normalization: delta_strength = |net_delta| / sma(volume, 20)
Percentile-Based Filtering
The indicator uses percentile filtering instead of fixed thresholds, making it adaptive to market conditions:
- Bubble Filter: Only shows bubbles when volume exceeds the specified percentile (default: 60%)
- Label Filter: Only displays numbers when volume exceeds a higher percentile (default: 90%)
- Dynamic Adaptation: Automatically adjusts to changing market volatility
Visual Elements
Bubble Sizes
- Tiny: Delta strength < 0.3
- Small: Delta strength 0.3 - 0.7
- Normal: Delta strength 0.7 - 1.2
- Large: Delta strength 1.2 - 2.0
- Huge: Delta strength > 2.0
Color Coding
- Aggressive Buy (Bright Green): Strong buying pressure with high body ratio
- Aggressive Sell (Bright Red): Strong selling pressure with high body ratio
- Passive Buy (Light Green): Moderate buying pressure
- Passive Sell (Light Red): Moderate selling pressure
Intensity Mode
Alternative coloring based on delta strength rather than flow direction:
- Gray: Low intensity (< 0.5)
- Blue: Medium intensity (0.5 - 1.0)
- Orange: High intensity (1.0 - 2.0)
- Red: Extreme intensity (> 2.0)
Parameters
Order Flow Settings
- Show Bubbles: Toggle bubble display on/off
- Bubble Volume %ile: Percentile threshold for bubble display (0-100%)
- Intensity Mode: Switch between flow-based and intensity-based coloring
Bubble Labels
- Show Numbers in Bubbles: Toggle numerical labels on/off
- Label Volume %ile: Higher percentile threshold for label display (0-100%)
Numbers are displayed in K-notation (e.g., 25000 → 25K, 1500000 → 1.5M) for better readability.
Ideal Usage Scenarios
Best Market Conditions
- High volume sessions: More accurate delta calculations
- Trending markets: Clear directional flow identification
- Breakout scenarios: Spot aggressive buying/selling at key levels
- Support/resistance testing: Identify accumulation vs distribution
Trading Applications
1. Entry Timing: Look for aggressive flow in your trade direction
2. Exit Signals: Watch for opposing aggressive flow
3. Trend Confirmation: Consistent flow direction confirms trends
4. Volume Climax: Huge bubbles may indicate exhaustion points
Optimization Tips
Parameter Adjustment
- Lower percentiles (40-60%): More bubbles, good for active markets
- Higher percentiles (70-90%): Fewer bubbles, focus on significant events
- Label percentile: Set 20-30% higher than bubble percentile for clarity
Visual Optimization
- Intensity mode: Better for identifying unusual volume spikes
- Flow mode: Better for directional bias analysis
- Label toggle: Turn off in crowded markets, on for key levels
Limitations
- Estimation-based: Uses approximation algorithms, not true order flow data
- Volume dependency: Requires accurate volume data to function properly
- Timeframe sensitivity: Works best on intraday timeframes with active volume
- Market hours: Most effective during high-volume trading sessions
Technical Notes
The indicator implements advanced Pine Script features including:
- Dynamic percentile calculations using ta.percentile_linear_interpolation()
- Conditional plotting with multiple size categories
- Custom number formatting functions
- Efficient label management to prevent display limits
This tool is designed for traders who want to understand the underlying buying and selling pressure beyond simple volume analysis, providing insights into market sentiment and potential turning points.

Multitimeframe Order Block Finder (Zeiierman)█ Overview
The Multitimeframe Order Block Finder (Zeiierman) is a powerful tool designed to identify potential institutional zones of interest — Order Blocks — across any timeframe, regardless of what chart you're viewing.
Order Blocks are critical supply and demand zones formed by the last opposing candle before an impulsive move. These areas often act as magnets for price and serve as smart-money footprints — ideal for anticipating reversals, retests, or breakouts.
This indicator not only detects such zones in real-time, but also visualizes their mitigation, bull/bear volume pressure, and a smoothed directional trendline based on Order Block behavior.
█ How It Works
The script fetches OHLCV data from your chosen timeframe using request.security() and processes it using strict pattern logic and volume-derived strength conditions. It detects Order Blocks only when the structure aligns with dominant pressure and visually extends valid zones forward for as long as they remain unmitigated.
⚪ Bull/Bear Volume Power Visualization
Each OB includes proportional bars representing estimated buy/sell effort:
Buy Power: % of volume attributed to buyers
Sell Power: % of volume attributed to sellers
This adds a visual, intuitive layer of intent — showing who controlled the price before the OB formed.
⚪ Order Block Trendline (Butterworth Filtered)
A smoothed trendline is derived from the average OB value over time using a two-pole Butterworth low-pass filter. This helps you understand the broader directional pressure:
Trendline up → favor bullish OBs
Trendline down → favor bearish OBs
█ How to Use
⚪ Trade From Order Blocks Like Institutions
Use this tool to find institutional footprints and reaction zones:
Enter at unmitigated OBs
⚪ Volume Power
Volume Pressure Bars inside each OB help you:
Confirm strong buyer/seller dominance
Detect possible traps or exhaustion
Understand how each zone formed
⚪ Find Trend & Pullbacks
The trendline not only helps traders detect the current trend direction, but the built-in trend coloring also highlights potential pullback areas within these trends.
█ Settings
Timeframe – Selects which timeframe to scan for Order Blocks.
Lookback Period – Defines how many bars back are used to detect bullish or bearish momentum shifts.
Sensitivity – When enabled, the indicator uses smoothed price (RMA) with rising/falling logic instead of raw candle closes. This allows more flexible detection of trend shifts and results in more Order Blocks being identified.
Minimum Percent Move – Filters out weak moves. Higher = only strong price shifts.
Mitigated on Mid – OB is removed when price touches its midpoint.
Show OB Table – Displays a panel listing all active (unmitigated) Order Blocks.
Extend Boxes – Controls how far OB boxes stretch into the future.
Show OB Trend – Toggles the trendline derived from Order Block strength.
Passband Ripple (dB) – Controls trendline reactivity. Higher = more sensitive.
Cutoff Frequency – Controls smoothness of trendline (0–0.5). Lower = smoother.
-----------------
Disclaimer
The content provided in my scripts, indicators, ideas, algorithms, and systems is for educational and informational purposes only. It does not constitute financial advice, investment recommendations, or a solicitation to buy or sell any financial instruments. I will not accept liability for any loss or damage, including without limitation any loss of profit, which may arise directly or indirectly from the use of or reliance on such information.
All investments involve risk, and the past performance of a security, industry, sector, market, financial product, trading strategy, backtest, or individual's trading does not guarantee future results or returns. Investors are fully responsible for any investment decisions they make. Such decisions should be based solely on an evaluation of their financial circumstances, investment objectives, risk tolerance, and liquidity needs.

Multitimeframe Fair Value Gap – FVG (Zeiierman)█ Overview
The Multitimeframe Fair Value Gap – FVG (Zeiierman) indicator provides a dynamic and customizable visualization of institutional imbalances (Fair Value Gaps) across multiple timeframes. Built for traders who seek to analyze price inefficiencies, this tool helps highlight potential entry points, unmitigated gaps, and directional bias using smart volume logic and adaptive visual elements.
A Fair Value Gap (FVG) forms when there's a three-candle sequence in which a market imbalance leaves a "gap" between the wicks of candle 1 and candle 3. These areas are often considered footprints of institutional activity, and this indicator gives you the tools to track them with surgical precision across any timeframe you choose—regardless of the one you're viewing.
This indicator also includes a trend filter powered by a low-pass Butterworth filter, enabling traders to distinguish between countertrend vs. trend-aligned FVGs for more intelligent decision-making. On top of that, it features a dynamic FVG table for live tracking and bull/bear volume power visualization inside each gap, adding powerful clarity to market intent.
█ How It Works
The indicator analyzes the open, high, low, close, and volume of candles from a user-selected timeframe. It identifies Fair Value Gaps based on wick logic and only confirms those that meet customizable strength criteria. Once detected, the indicator visualizes each FVG with dynamically extending boxes, optional buy/sell volume bars, and a real-time mitigation check.
⚪ Multitimeframe Logic
Users can analyze FVGs from a higher or lower timeframe regardless of their current chart.
This is achieved using request.security() to fetch OHLCV data from the chosen timeframe.
⚪ Wick Sensitivity & Impulse Filter
The script measures the wick size of potential FVG candles and compares them to a running average. Only FVGs with wick sizes above a certain sensitivity threshold (user-controlled) are plotted. This ensures only meaningful price dislocations (e.g., strong impulsive moves) are shown, reducing noise.
⚪ Midpoint Mitigation Logic
FVGs are marked as "mitigated" when the price revisits the gap area. Traders can choose whether full gap closure or just a midpoint touch is required. This allows faster reactivity in real-time trading environments.
⚪ Bull & Bear Power – Volume-Weighted Visualization
Every Fair Value Gap box includes sub-bars representing the estimated buy and sell effort that created the gap. These are calculated using the candle's close in relation to its high/low range and volume:
Buy Volume % ≈ effort from low to close
Sell Volume % ≈ effort from high to close
Each sub-bar inside the FVG:
Is color-coded (UpCol for bullish, DnCol for bearish)
Is drawn proportionally to the strength of buyers or sellers
Visually displays who was in control during the imbalance
⚪ FVG Table – Dynamic On-Chart Overview
The indicator includes an optional on-chart table that displays all currently active (unmitigated) FVGs in a side panel format:
Automatic updates as gaps are formed and mitigated
Color-coded rows to show bullish vs. bearish FVGs
Timestamps to know precisely when the gap formed
User-controlled position via Table Left and Table Right
This is a gap watchlist overlay, giving traders a concise view of current inefficiencies without manually scanning the chart.
⚪ FVG Trend Filter (Butterworth Smoother)
Using a two-pole Butterworth low-pass filter, the indicator computes a trendline based on average FVG values, offering a smooth but responsive directional signal.
Passband Ripple (dB): Controls sensitivity and overshoot tolerance
Cutoff Frequency (0–0.5): Sets how quickly the trendline reacts
The trendline helps categorize each FVG:
Trend up → favor bullish FVGs
Trend down → favor bearish FVGs
It adds an extra dimension to FVG entries, helping distinguish between trend-aligned and countertrend signals.
█ How to Use
⚪ Identify Institutional Gaps
Use this tool to identify areas where institutions may have left imbalances behind quickly.
These areas often become:
Strong support/resistance zones
Areas where price might react sharply
Targets for liquidity sweeps or retracements
⚪ React to Trend or Countertrend
The built-in trendline helps categorize each FVG:
Trend up → Bullish FVGs have higher validity
Trend down → Bearish FVGs have higher validity
⚪ Volume Context via Bull/Bear Power
Each Fair Value Gap is more than just a price imbalance — it’s a story of effort and intent. The Bull/Bear Power feature visualizes the buy and sell pressure behind each FVG, helping you understand how the gap was formed and who was in control.
A bullish FVG with a strong buy effort suggests continuation potential — buyers dominated the move.
A bullish FVG with a dominant sell effort could signal a trap or reversal — sellers may have overwhelmed the breakout.
These insights allow you to confirm imbalance strength, spot traps early, and add confidence to entries based on dominant volume profiles.
Instead of viewing gaps as static zones, this feature turns each into a live volume map — a visual breakdown of who moved the market and whether that move had conviction.
⚪ Plan with the FVG Table
The FVG Table acts as your on-chart control center for tracking active imbalances. When enabled, it provides a clear summary of all unmitigated Fair Value Gaps, helping you stay organized and focused during fast-moving sessions.
Track live and historical gaps: See exactly when and where each FVG formed.
Monitor older, still-valid zones: Gaps off-screen but not mitigated remain in play — perfect for anticipating future reactions.
Gauge market bias at a glance: The balance of bullish vs. bearish FVGs helps you understand overall directional pressure.
Plan entries confidently: Use the table to reference all zones for risk management, confluence stacking, or layered execution strategies.
Instead of manually scanning your chart, the FVG Table offers a clean, at-a-glance overview of the market’s inefficiencies — giving you the structure needed to act with precision.
█ Settings
FVG Timeframe
Select any timeframe to source FVGs independent of your current chart.
Sensitivity
Filter FVGs by how impulsive the move is — it helps you eliminate weak gaps.
Mitigated on Mid
Control whether gaps are removed at midpoint touch or full fill.
Table Settings
Control the table position and width. Cleanly view all active FVGs.
FVG Style
Customize gap box colors, length, and bullish/bearish overlays.
Trend Filter
Enable or disable the smoothed FVG-based trendline with customizable smoothing controls.
-----------------
Disclaimer
The content provided in my scripts, indicators, ideas, algorithms, and systems is for educational and informational purposes only. It does not constitute financial advice, investment recommendations, or a solicitation to buy or sell any financial instruments. I will not accept liability for any loss or damage, including without limitation any loss of profit, which may arise directly or indirectly from the use of or reliance on such information.
All investments involve risk, and the past performance of a security, industry, sector, market, financial product, trading strategy, backtest, or individual's trading does not guarantee future results or returns. Investors are fully responsible for any investment decisions they make. Such decisions should be based solely on an evaluation of their financial circumstances, investment objectives, risk tolerance, and liquidity needs.

[blackcat] L2 Waveband Trading█ OVERVIEW
The Waveband Trading script calculates trading signals based on a modified Relative Strength Index (RSI)-like system combined with specific price action criteria. It plots two lines representing different smoothed RSI-like indicators and marks potential buying opportunities labeled as "S" for stronger trends and "B" for weaker but still favorable ones.
█ LOGICAL FRAMEWORK
The script begins by defining the waveband_trading_signals function which computes RSI-like metrics and determines buy signals under certain conditions. The main sections include input parameter definitions, function calls, data processing within the function, and plot commands for visual representation. Data flows from historical OHLCV data to various technical computations like EMAs and SMAs before being evaluated against user-defined thresholds to generate trade signals.
█ CUSTOM FUNCTIONS
Waveband Trading Signals:
• Purpose: Computes waveband trading signals using a customized version of the RSI indicator.
• Parameters:
— overboughtLevel: Threshold level indicating market overbought condition.
— oversoldLevel: Threshold level indicating market oversold condition.
— strongHoldLevel: Strong hold condition threshold between neutral and overbought states.
— moderateHoldLevel: Moderate hold condition threshold below strong hold level.
• [b>Returns: A tuple containing:
— k: Smoothed RSI-like metric.
— d: Further smoothed version of 'k'.
— buySignalStrong: Boolean indicating a strong trend buy signal.
— buySignalWeak: Boolean indicating a weak but promising buy signal.
█ KEY POINTS AND TECHNIQUES
• Utilizes EMA and SMA functions to smooth out price variations effectively.
• Employs crossover logic between fast ('k') and slow ('d') indicators to identify entry points.
• Incorporates volume checks ensuring increasing interest in trades aligns with upwards momentum.
• Leverages predefined threshold levels allowing flexibility to adapt to varying market conditions.
• Uses the new labeling feature ( label.new ) introduced in Pine Script v5 for marking significant chart events visually.
█ EXTENDED KNOWLEDGE AND APPLICATIONS
Potential enhancements could involve incorporating additional filters such as MACD crossovers or Fibonacci retracement levels alongside optimizing current conditions via backtesting. This technique might also prove useful in other strategies requiring robust confirmation methods beyond simple price action; alternatively, adapting it into a more automated form for execution on exchanges offering API access. Understanding key functionalities like relative strength assessment, smoothed averaging techniques, and conditional buy/sell rules enriches one’s toolkit when developing complex trading algorithms tailored specifically toward personal investment philosophies.

BooBee Digital - Enhanced Buy & Sell Alerts Suite
BooBee Digital - Enhanced Buy & Sell Alerts Suite
Introduction:
The “BooBee Digital - Enhanced Buy & Sell Alerts Suite” is a comprehensive trading tool designed to provide traders with precise buy and sell signals by integrating the Average True Range (ATR) trailing stop technique and the Volume Weighted Average Price (VWAP) indicator. This script is tailored to help traders make informed decisions by considering both market volatility and trading volume.
How It Works:
1. ATR Calculation:
• Purpose: Measures market volatility to set dynamic stop levels.
• Details: The Average True Range (ATR) is calculated over a user-defined period. The ATR value reflects the average range of price movements over the specified period, which is crucial for assessing market volatility.
2. ATR Trailing Stop:
• Purpose: Identifies potential trend reversals by setting trailing stops based on market volatility.
• Details: The ATR trailing stop is dynamically adjusted using the ATR value and a user-defined sensitivity factor. This trailing stop level helps identify trend reversals by moving in accordance with price fluctuations.
3. VWAP Calculation:
• Purpose: Provides a volume-weighted average price to benchmark fair value.
• Details: The VWAP is calculated by taking the sum of the product of price and volume, divided by the total volume. This indicator gives traders a reference point for the average price at which the asset has traded throughout the day, considering trading volume.
4. EMA Crossover:
• Purpose: Adds a confirmation layer for buy and sell signals.
• Details: A 1-period Exponential Moving Average (EMA) is used to identify short-term price movements. Buy and sell signals are generated based on the crossover of the EMA and the ATR trailing stop, adding an extra layer of confirmation for trade entries and exits.
Signal Generation:
Buy Signal:
• Generated when the price is above the ATR trailing stop and there is a bullish crossover of the EMA and ATR trailing stop.
• Indicator: Green label below the bar with “Buy” text.
Sell Signal:
• Generated when the price is below the ATR trailing stop and there is a bearish crossover of the EMA and ATR trailing stop.
• Indicator: Red label above the bar with “Sell” text.
VWAP Line:
• The VWAP line is plotted on the chart to help traders identify significant price levels based on trading volume.
• Indicator: Blue line representing the VWAP.
How to Use:
• Chart Type: The script is designed for use on standard chart types such as Candlestick and OHLC. It does not support non-standard chart types like Heikin Ashi, Renko, Kagi, Point & Figure, and Range, as they may produce unrealistic results.
• Clean Chart: Ensure your chart is clean and free of other indicators to avoid confusion. The signals and colors plotted by the script should be easily identifiable.
• Trade Confirmation: Use the buy and sell signals generated by the script in conjunction with other analysis methods to confirm trades.
Key Concepts:
• ATR Trailing Stop: This technique sets dynamic stop levels based on market volatility, helping to identify trend reversals.
• VWAP: This indicator provides a benchmark for the average price considering trading volume, helping traders identify fair value.
• EMA Crossover: This adds a layer of confirmation for buy and sell signals, improving the accuracy of trade entries and exits.

OrderFlow Absorption IndicatorWhat it Does
The OrderFlow Absorption Indicator marks areas where the price absorbs a large volume of aggressive market trades. This indicates areas where price may bounce back due to large limit (resting) orders absorbing significant aggressor volume (market orders). Absorption can also be seen as "preventing" or "stopping" the other side from breaking through a price level (e.g. bids stopping an influx of sell market orders). Absorption may signal a change in sentiment, potentially leading to a pullback or reversal.
An Example of Absorption
Of course, it is not always the case that such bullish absorption will initiate a trend as the example above. The OrderFlow Absorption Indicator merely serves as a tool for spotting possible absorption points in the market which you can incorporate into your trading arsenal.
How it Works
The indicator actively monitors price changes and records volume accumulated at a price level. If the price bounces back to at least where it was before the current price move, the indicator records this as absorption, provided it meets the Volume Requirement and optional Time Requirement.
How to Use it
1. Set Parameters
Choose your desired tick size and volume filter value. If unsure, refer to the table on the top right of the chart for recommended values. An automatic volume limit filter mode is also available.
Automatic Limit Mode : Enable this mode to have the indicator automatically select a volume filter value. It calculates the standard deviation of the last n minutes of volume and multiplies it by a volume multiplier. You can adjust these parameters.
Higher Volume Filter : Setting a higher volume filter value results in fewer, but higher quality detections, reducing noise.
2. Enabling the Time Limit
Enabling the time limit further improves detection quality by filtering out price levels that can defend against quick, sudden aggressive orders, acting as confirmation and indicating strong sentiment and resilient liquidity.
3. Enabling Historical Data Absorption
The indicator can also detect absorption in historical data, though less accurately than in real-time due to OHLCV aggregation.
You can select the granularity of historical data.
Lower granularity (e.g., 1 second) : Provides more accurate detections but may slow down the indicator.
Higher granularity : Improves speed but reduces detection accuracy.
Other Features
Hovering : When hovering over an absorption point, the interface reveals the price where the absorption occurred, along with the volume absorbed by the bids and asks, as well as the volume filter value used.
Delta Mode : In Delta mode, the system calculates the difference between the volume absorbed by bids and asks, revealing points only when the absolute value of this difference exceeds the volume filter value. Especially useful for larger tick sizes.
Troubleshooting
If the indicator doesn't mark anything, it means the traded volume hasn't exceeded the set volume filter value within the specified price intervals(tick size) and time limit. Adjust these settings as necessary.
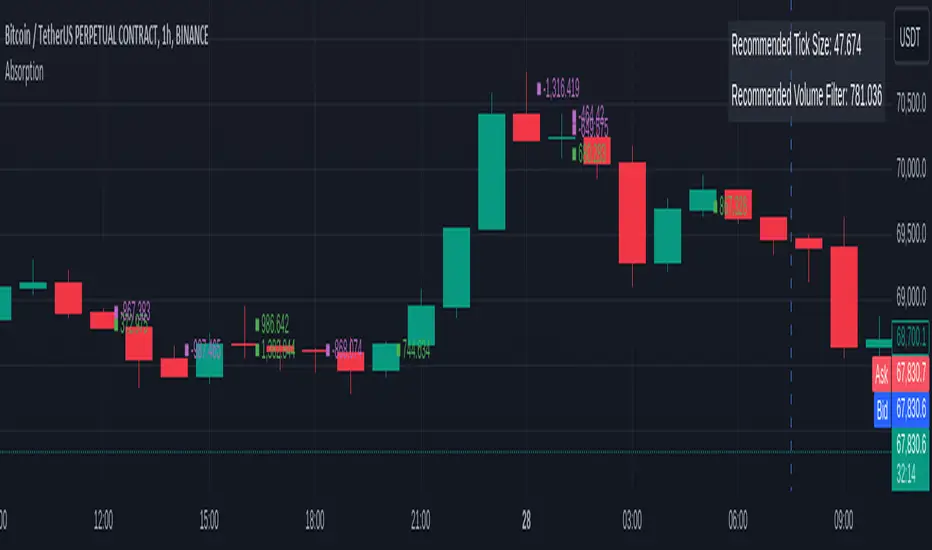
EM Visible Range Volume Profile█ OVERVIEW
ᴇᴍ VRVP (Visible Range Volume Profile) indicator calculates the volume profile within the visible range of prices.
Volume Profile is an advanced technical analysis indicator that shows trading activity over a specified period of time at certain price levels.
The indicator plots a histogram on the chart that reflects dominant or significant price levels based that are based on volume.
VP concept
VP Components
Open, High, Low, Close:
There are different types of volume profile indicators but the majority of them will designate the OHLC.
Point of Control:
A price level with the most traded volume during one session, also known as POC.
High Volume Node (HVN):
Area of high volume relative to surrounding price action.
Low Volume Node (LVN):
Area of low volume relative to surrounding price action.
Analysis of price in relation to high and low volume nodes is useful when building context around your trades.
█ VOLUME PROFILE STRATEGIES
The distribution of a volume profile can help you determine the strength of a trend and spot potential reversal zones. Let’s take a look at the five different distribution types.
Neutral D
In order for price to break away from value, either the buyers or the sellers will have to become more aggressive than the other side. When this occurs, it gives us with a vital piece of information.
Now we know who were the agressors at this price level: either the buyers or the sellers. That's why this is a good level for a trading setup if the price bounces back.
Bearish P and Bullish P
Bearish P — reversal. Bullish P — confirmation.
Bearish Ь and Bullish Ь
Bearish Ь — confirmation. Bullish Ь — reversal.
Examples
█ INPUTS
Width — amplitude of the VP histogram.
Grid — the number of columns of the VP histogram.
Delta of volumes — combinatorial determination of the ratios of sellers and buyers.
In quoted units — conversion in units of quoted currency.
Logarithmic scale — recalculation the grid step to the logarithmic scale of the chart.
HTF — (Higher Timeframe) calculation of VP for the period of the selected timeframe. ISO: Isolated computation in HTF period.
Palette: Total volume, Volume of buyers, Volume of sellers, HTF bars.
Warnings: colour of the «⚠» icon, language of information in the Tooltip.
Addition: ᴇᴍ CHN-RMA — a grid of moving averages with periods of centered hexagonal numbers.
█ ОБЩИЕ СВЕДЕНИЯ
ᴇᴍ VRVP (Visible Range Volume Profile) рассчитывает профиль объёма в видимом диапазоне цен.
Профиль объёма — это продвинутый индикатор технического анализа, который показывает торговую активность за условленный период времени на определённых ценовых уровнях.
Индикатор строит на графике гистограмму, отражающую доминирующие или значимые ценовые уровни, основанные на объёме.
█ НАСТРОЙКИ
Ширина — амплитуда гистограммы VP.
Сетка — количество колонок гистограммы VP.
Дельта объёмов — комбинаторное определение соотношений продаж и покупок.
В котируемых единицах — пересчёт в единицах котируемой валюты.
Логарифмическая шкала — пересчёт шага сетки на логарифмическую шкалу графика.
HTF — (Higher Timeframe) расчёт VP за период выбранного таймфрейма. ISO: Изолированное вычисление в HTF-периоде.
Палитра: Суммарный объём, Объём покупок, Объём продаж, Бары HTF.
Предупреждения: цвет значка «⚠», язык информации в Tooltip.
Дополнение: ᴇᴍ CHN-RMA — сетка скользящих средних с периодами центрированных гексагональных чисел.
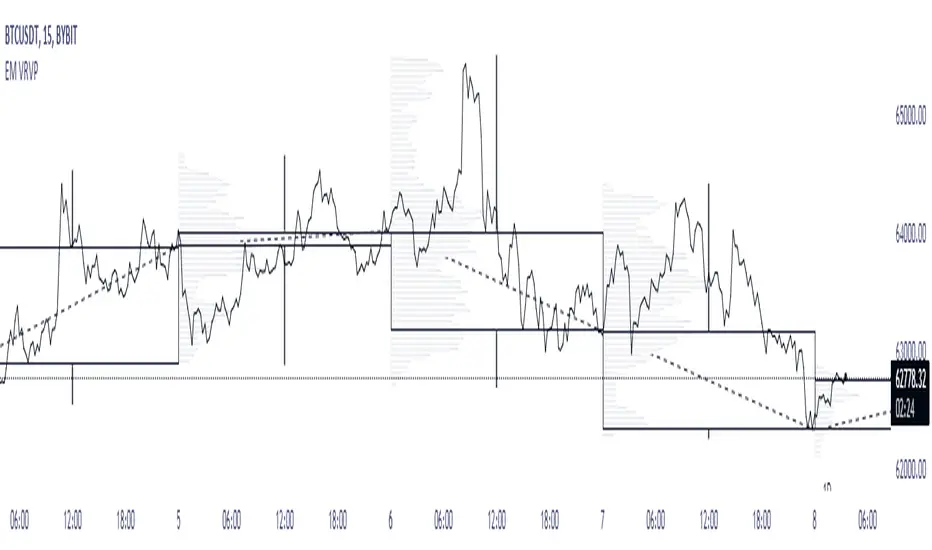
ATR Bands with Optional Risk/Reward Colors█ OVERVIEW
This indicator projects ATR bands and, optionally, colors them based on a risk/reward advantage for those who trade breakouts/breakdowns using moving averages as partial or full exit points.
█ DEFINITIONS
► True Range
The True Range is a measure of the volatility of a financial asset and is defined as the maximum difference among one of the following values:
- The high of the current period minus the low of the current period.
- The absolute value of the high of the current period minus the closing price of the previous period.
- The absolute value of the low of the current period minus the closing price of the previous period.
► Average True Range
The Average True Range was developed by J. Welles Wilder Jr. and was introduced in his 1978 book titled "New Concepts in Technical Trading Systems". It is calculated as an average of the true range values over a certain number of periods (usually 14) and is commonly used to measure volatility and set stop-loss and profit targets (1).
For example, if you are looking at a daily chart and you want to calculate the 14-day ATR, you would take the True Range of the previous 14 days, calculate their average, and this would be the ATR for that day. The process is then repeated every day to obtain a series of ATR values over time.
The ATR can be smoothed using different methods, such as the Simple Moving Average (SMA), the Exponential Moving Average (EMA), or others, depending on the user's preferences or analysis needs.
► ATR Bands
The ATR bands are created by adding or subtracting the ATR from a reference point (usually the closing price). This process generates bands around the central point that expand and contract based on market volatility, allowing traders to assess dynamic support and resistance levels and to adapt their trading strategies to current market conditions.
█ INDICATOR
► ATR Bands
The indicator provides all the essential parameters for calculating the ATR: period length, time frame, smoothing method, and multiplier.
It is then possible to choose the reference point from which to create the bands. The most commonly used reference points are Open, High, Low, and Close, but you can also choose the commonly used candle averages: HL2, HLC3, HLCC4, OHLC4. Among these, there is also a less common "OC2", which represents the average of the candle body. Additionally, two parameters have been specifically created for this indicator: Open/Close and High/Low.
With the "Open/Close" parameter, the upper band is calculated from the higher value between Open and Close, while the lower one is calculated from the lower value between Open and Close. In the case of bullish candles, therefore, the Close value is taken as the starting point for the upper band and the Open value for the lower one; conversely, in bearish candles, the Open value is used for the upper band and the Close value for the lower band. This setting can be useful for precautionally generating broader bands when trading with candlesticks like hammers or inverted hammers.
The "High/Low" parameter calculates the upper band starting from the High and the lower band starting from the Low. Among all the available options, this one allows drawing the widest bands.
Other possible options to improve the drawing of ATR bands, aligning them with the price action, are:
• Doji Smoothing: When the current candle is a doji (having the same Open and Close price), the bands assume the values they had on the previous candle. This can be useful to avoid steep fluctuations of the bands themselves.
• Extend to High/Low: Extends the bands to the High or Low values when they exceed the value of the band.
• Round Last Cent: Expands the upper band by one cent if the price ends with x.x9, and the lower band if the price ends with x.x1. This function only works when the asset's tick is 0.01.
► Risk/Reward Advantage
The indicator optionally colors the ATR bands after setting a breakpoint, one or two risk/reward ratios, and a series of moving averages. This function allows you to know in advance whether entering a trade can provide an advantage over the risk. The band is colored when the ratio between the distance from the break point to the band and the distance from the break point to the first available moving average reaches at least the set ratio value. It is possible to set two colorings, one for a minimum risk/reward ratio and one for an optimal risk/reward ratio.
The break point can be chosen between High/Low (High in case of breakout, Low in case of breakdown) or Open/Close (on breakouts, Close with bullish candles or Open with bearish candles; on breakdowns, Close with bearish candles or Open with bullish candles).
It is possible to choose up to 10 moving averages of various types, including the VWAP with the Anchor Period (2).
Depending on the "Price to MA" setting, the bands can be individually or simultaneously colored.
By selecting "Single Direction," the risk/reward calculation is performed only when all moving averages are above or below the break point, resulting in only one band being colored at a time. For this reason, when the break point is in between the moving averages, the calculation is not executed. This setting can be useful for strategies involving price movement from a level towards a series of specific moving averages (for example, in reversals starting from a certain level towards the VWAP with possible partial take profits on some previous moving averages, or simply in trend following towards one or more moving averages).
Choosing "Both Directions" the risk/reward ratio is calculated based on the first available moving averages both above and below the price. This setting is useful for those who operate in range bound markets or simply take advantage of movements between moving averages.
█ NOTE
This script may not be suitable for scalping strategies that require immediate entries due to the inability to know the ATR of a candle in advance until its closure. Once the candle is closed, you should have time to place a stop or stop-limit order, so your strategy should not anticipate an immediate start with the next candle. Even more conveniently, if your strategy involves an entry on a pullback, you can place a limit order at the breakout level.
(1) www.tradingview.com
(2) For convenience, the code for the Anchor Period has been entirely copied from the VWAP code provided by TradingView.
