Previous Bar OHLC + 5m 20 EMAThis shows previous bar OHLC + 5m 20 EMA in one single text box, so you dont have to find it yourself. hope it helps :)
Recherche dans les scripts pour "OHLC"

JL - DWM OHLCThis indicator plots the following price levels on your chart automatically AND will not show up if you are using a timeframe bigger than 60 minutes, 1 day, or 1 week.
Here are the price levels that are automatically plotted for you, and so you know the styling is different for Daily, Weekly, Monthly levels so you can easily distinguish between them:
- Prior Day: High / Low / Close
- Current Day: Open
- Prior Week: High / Low / Close
- Current Week: Open
- Prior Month: High / Low / Close
- Current Month: Open
These plots are timeframe dependent and will not plot on subsequently higher timeframes, here is how they work:
Daily Price Levels are only shown on timeframes that are smaller than 60 minutes.
Weekly Price Levels are only shown on timeframes smaller than 1 Day.
Monthly Price Levels are only shown on timeframes smaller than 1 Week.
This way, you can turn on the indicator and not have to think about turning off certain price levels if you switch to a larger / longer timeframe than what you typically use.
For example, Daily OHLC price levels will quickly clutter the 60 minute chart, and likely you don't need to know the HLC of the Prior Day if you are looking at the 60 minute chart. Therefor it may be helpful to automatically hide the Daily price level plots, and only show the Weekly and Monthly plots on the 60 minute timeframe.
I hope you find this indicator helpful, thanks for reading.

Last Candle OHLCThis simple yet powerful TradingView indicator displays the Open, High, Low, and Close (OHLC) values of the last completed candle directly on your chart. Whether you're trading stocks, forex, or crypto, having quick access to the most recent candle's price levels can be crucial for decision-making.
✨ Features:
✅ Shows the Open, High, Low, and Close of the last completed candle
✅ Works on any timeframe and asset
✅ Helps traders spot key price levels for entry, stop-loss, or take-profit decisions
Perfect for price action traders, scalpers, and swing traders! 🚀

Last Candle OHLC (Ticks or Points)What the Code Does
1. **Draws Lines and Labels**:
- It draws lines on your chart to show the high, low, open, and close prices from the previous period (like the previous day or week).
- It also labels these lines with numbers that tell you how far the current price is from these levels.
2. **Shows Price Movement**:
- You can see how far the price has moved from these levels in terms of small price changes (ticks) or larger units (points).
- This helps you understand price movements and potential levels of support or resistance.
3. **Customizable**:
- You can choose whether to show these lines and labels, and you can select if you want to see the movement in ticks or points.
- The lines can extend into the future on your chart to help you anticipate where prices might be in the coming days.
### How It’s Useful:
1. **Identify Key Levels**:
- It helps you spot important price levels from past periods, which can act as support or resistance.
2. **Understand Price Movement**:
- You get a visual sense of how much the price has moved from key levels, which can help you gauge market volatility.
3. **Plan Trades**:
- By seeing where the price has been and how it has moved, you can better plan your trades, like deciding where to enter or exit based on these levels.
4. **Flexible for Different Markets**:
- It works across various markets, like stocks, futures, and forex, adjusting to the specific characteristics of each instrument.
In short, this tool helps you visualize and understand past price movements and levels on your chart, aiding in your trading decisions.

Yearly CandlesPlots yearly candles from monthly candles data. This indicator could also be used to view yearly candles of those symbols for which candlesticks are not available in TradingView (for e.g., ECONOMICS:USINTR , ECONOMICS:USIRYY , ECONOMICS:USWG etc)
As these are not out of the box candles they do have these shortcomings -
Last candle's data is not available in status line, a separate label lists OHLC and change details near its close level
The very first candle's width may vary based on how much data is available for that year
Works only with monthly timeframe
Only those indicators that can be added on other indicators can be applied, however, they may still not work as intended as this still technically is a monthly chart!

Lepelle's Key LevelsCredit to original code goes to paaax and NSDT. Modified to include premarket H/L levels and to show only daily levels. Indicator includes Close levels.
-US Premarket High and Low Levels
-Daily OHL Levels (No close included)
-Yesterday and Previous day OHLC level
-Labels and ability to modify user preferences (color, line)

Yesterday's open, high, low and closeA very simple script to plot the yesterday's OHLC, to be used in an intraday graph.
There were other scripts like this, but their code was ugly, filthy, smelly, and WET, so I did this.

L1 Buy after Dump DetectorLevel: 1
Background
The so-called "Buy after Dump" refers to the phenomenon in which the stock price sometimes rebounds temporarily due to the rapid decline in the falling market. The rebound was smaller than the decline, and the downtrend resumed after the rebound.
Function
L1 Buy after Dump Detector is one of my research to see win rate of a "Buy after Dump" chance. The principle is that I use ema() and OHLC to model a whale dump behavior. After the dump wave, I use KDJ to indicate several long entry points.
Key Signal
dump --> whale dump signal
fundready --> it indicate the end of a dump and make fund ready to long entry
longentry --> long entry signal generated from KDJ resonating with dump and fundready signal
Pros and Cons
Pros:
1. it can detect obvious dump and depict the decay of dump wave
2. use resonance to generate long entry
Cons:
1. it may be risky to "buy after dump" which may require take profit method here because the opportunity may be very short
2. KDJ is too sensitive in large time frame and have many long entry signals (the closer to dump wave, the better based on experience)
Remarks
Very interesing stuff, but rare of people trade with such crazy method. I suggest this is ONLY for backtest study of market behavior.
Readme
In real life, I am a prolific inventor. I have successfully applied for more than 60 international and regional patents in the past 12 years. But in the past two years or so, I have tried to transfer my creativity to the development of trading strategies. Tradingview is the ideal platform for me. I am selecting and contributing some of the hundreds of scripts to publish in Tradingview community. Welcome everyone to interact with me to discuss these interesting pine scripts.
The scripts posted are categorized into 5 levels according to my efforts or manhours put into these works.
Level 1 : interesting script snippets or distinctive improvement from classic indicators or strategy. Level 1 scripts can usually appear in more complex indicators as a function module or element.
Level 2 : composite indicator/strategy. By selecting or combining several independent or dependent functions or sub indicators in proper way, the composite script exhibits a resonance phenomenon which can filter out noise or fake trading signal to enhance trading confidence level.
Level 3 : comprehensive indicator/strategy. They are simple trading systems based on my strategies. They are commonly containing several or all of entry signal, close signal, stop loss, take profit, re-entry, risk management, and position sizing techniques. Even some interesting fundamental and mass psychological aspects are incorporated.
Level 4 : script snippets or functions that do not disclose source code. Interesting element that can reveal market laws and work as raw material for indicators and strategies. If you find Level 1~2 scripts are helpful, Level 4 is a private version that took me far more efforts to develop.
Level 5 : indicator/strategy that do not disclose source code. private version of Level 3 script with my accumulated script processing skills or a large number of custom functions. I had a private function library built in past two years. Level 5 scripts use many of them to achieve private trading strategy.

Relative CandleThis script visualizes the relative movement of a single OHLC candle compared to an index (or another symbol). The vertical location of the candle indicates the general positive/negative comparison of the bar vs the index. The color of the candle indicates how the candle moved relative to the index. The wick indicates the closing range compared to the index (did the symbol close at lows of the bar while the index closed at highs).
The area graph in the background shows the average relative close over a 10-day simple moving average.
I use this to pop any behavior that is out of line with the market, whether positive or negative. For example, is a red bar day due to the market pullback or something specific to the stock. Or did the market pull back and the stock did the opposite, strong day!

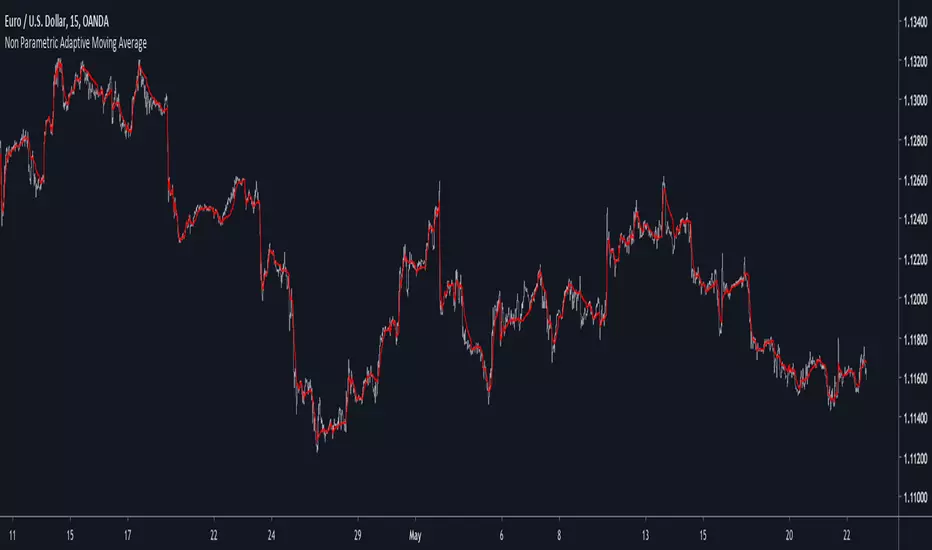
Non Parametric Adaptive Moving AverageIntroduction
Not be confused with non-parametric statistics, i define a "non-parametric" indicator as an indicator who does not have any parameter input. Such indicators can be useful since they don't need to go through parameter optimization. I present here a non parametric adaptive moving average based on exponential averaging using a modified ratio of open-close to high-low range indicator as smoothing variable.
The Indicator
The ratio of open-close to high-low range is a measurement involving calculating the ratio between the absolute close/open price difference and the range (high - low) , now the relationship between high/low and open/close price has been studied in econometrics for some time but there are no reason that the ohlc range ratio may be an indicator of volatility, however we can make the hypothesis that trending markets contain less indecision than ranging market and that indecision is measured by the high/low movements, this is an idea that i've heard various time.
Since the range is always greater than the absolute close/open difference we have a scaled smoothing variable in a range of 0/1, this allow to perform exponential averaging. The ratio of open-close to high-low range is calculated using the vwap of the close/high/low/open price in order to increase the smoothing effect. The vwap tend to smooth more with low time frames than higher ones, since the indicator use vwap for the calculation of its smoothing variable, smoothing may differ depending on the time frame you are in.
1 minute tf
1 hour tf
Conclusion
Making non parametric indicators is quite efficient, but they wont necessarily outperform classical parametric indicators. I also presented a modified version of the ratio of open-close to high-low range who can provide a smoothing variable for exponential averaging. I hope the indicator can help you in any way.
Thanks for reading !
Japanese Correlation CoefficientIntroduction
This indicator was asked and named by a trading meetup participant in Sevilla. The original question was "How to estimate the correlation between the price and a line as easy as possible", a question who got little attention. I previously proposed a correlation estimate using a modification of the standard score (see at the end of the post) for the estimation of a Savitzky-Golay moving average (LSMA) of order 1, however something faster could maybe be done and this is why i accepted the challenge.
Japanese Correlation
Correlation is defined as the linear relationship between two variables x and y , if x and y follow the same direction then the correlation increase else decrease. The correlation coefficient is always equal or below 1 and equal or above -1, it also have to be taken into account that this coefficient is quite smooth. Smoothing is not a problem, scaling however require more attention, high price > closing price > low price, therefore scaling can be done. First we smooth the closing/high/low price with a simple moving average of period p/2 , then we take the difference of the smoothed close with the smoothed close p/2 bars back, this result is then divided by the difference between the highest smoothed high's with the lowest smoothed low's over period p/2 .
Since we use information provided by candlesticks (close/high/low) i have been asked to publish this estimator with the name Japanese correlation coefficient , this name don't imply the use of data from Japanese markets, "Japanese" is used because of the candlestick method coming from Japan.
Comparison
I compare this estimation with the correlation coefficient provided in pinescript by the correlation function.
The estimation in orange with the original correlation coefficient using n as independent variable in blue with both length = 50.
comparison with length = 200.
Conclusion
I have shown that it is possible to roughly estimate the correlation coefficient between price and a linear function by using different price information. Correlation can be further estimated by using homogeneous bridge OHLC volatility estimators thus making able the use of different independent variables. I really hope you like this indicator and thanks to the meetup participant asking the question, i had a lot of fun making the indicator.
An alternative method

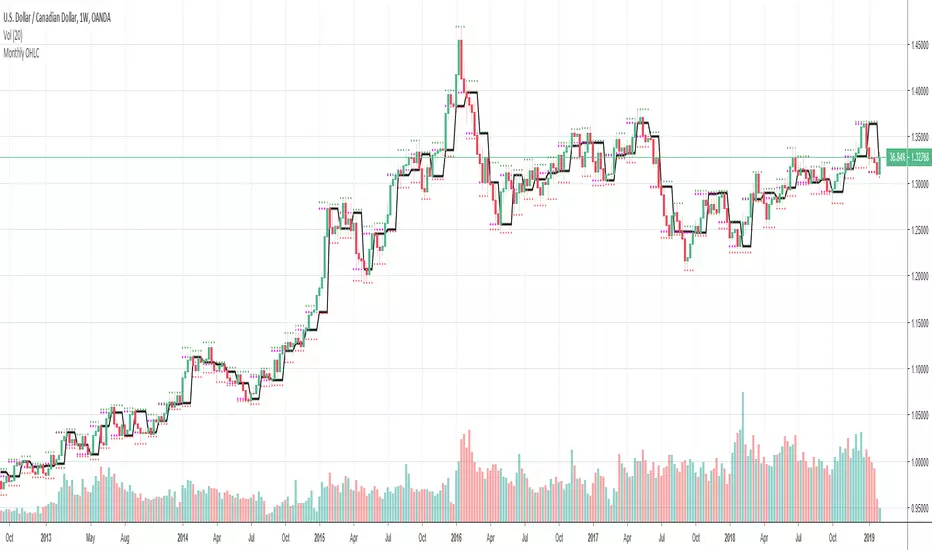
Monthly OHLCThis indicator displays the monthly Open, High, Low and Close price on a chart.
Very helpful indicator for starting your trading week (I use it every week in FOREX, Crypto, and Equities).
In conjunction using this on the Weekly & Daily timerfame with a 200, 10 and 5 EMA you can start your week off with a probable bull or bear bias.
Is Open equal to High or LowMany people are watching opening price on each time axis. Opening price is very important.
This indicator displays OHLC Open as a line in multiple time frame.
If open is close to high or low, the color of the line changes.
The fact that they are close means the strength of the market flow and the firmness of that price range.
Note:
The color of the line will not be fixed until bar is closed.
And when using, please set arbitrary coefficient according to each market.
Coefficient e.g.
EURUSD: 0.00005
BTCUSD: 1
DJI: 5
BTCJPY: 100
USDJPY: 0.01
NI225: 2

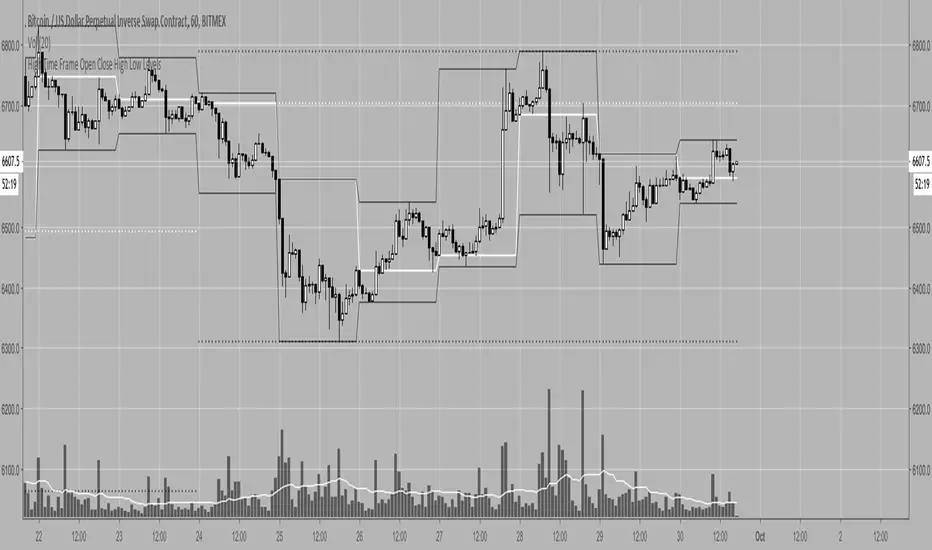
High Time Frame Open Close High Low LevelsGives you the OHLC levels of the weekly and daily candles as levels in whatever timeframe you're on so you can have a macro view in lower timeframes without having to switch timeframes constantly.
You may toggle the visibility of all the daily or weekly levels as well as each individual open/close/high/low.
The line styles and colors are customizable.

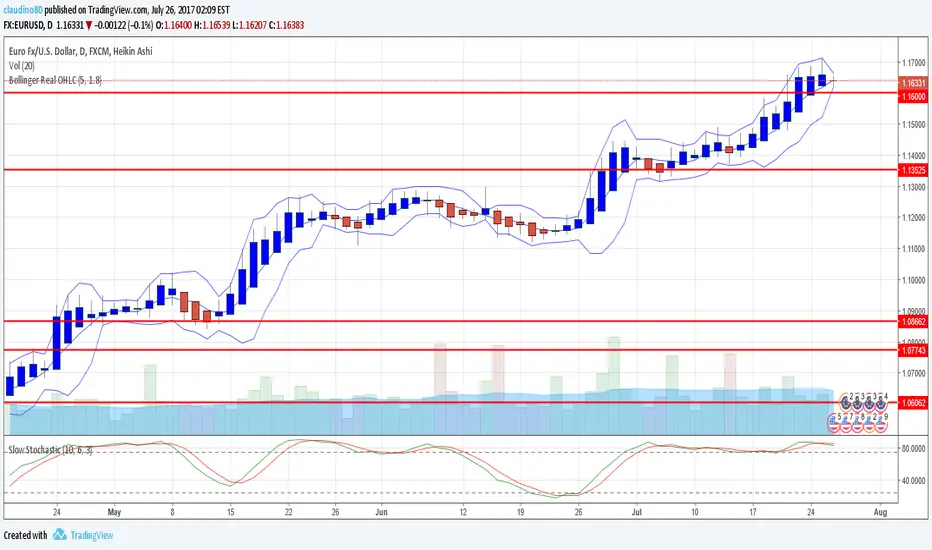
Bollinger Real OHLCThis uses the real OHLC not the one of the chart (useful for not standard chat like Heikin Ashi).
B3 MTF OHLCB3 M ulti T ime F rame - O pen H igh L ow C lose
For showing a 2nd resolution on one chart; Not much more to say about that :)


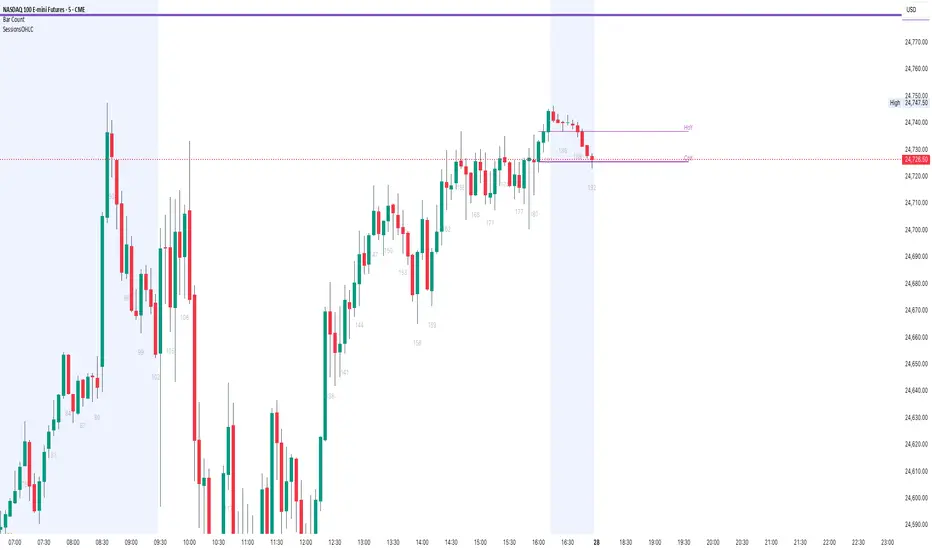
OHLC15mThis indicator simply plots the previous 15m candles High/Low, and the current 15m candles Open.
You can check "DrawHistorical" for back-testing, or leave it unchecked for live trading.
Draw Text option, explains what the lines are.
Max Lookback is 18 segments when using live.
This indicator will be more useful than many similar ones, as I don't like to overcomplicate things. This is simply for the 15m candlesticks to be plotted on ANY timeframe.
No overcomplications.


PP_Day_OHLC[Dallas]OHLC from both 1 day ago and 2 days ago. For previous day, the line is weighted #2 and Plots Blue dashed line for Open, Lime dashed line for High, Red dashed line for Low and Purple dashed line for Close. For two days previous, the line is weighted #1 and Plots Blue dashed line for Open, Lime dashed line for High, Red dashed line for Low and Purple dashed line for Close. This makes it very distinguishable to identify the two sets of levels on the chart.

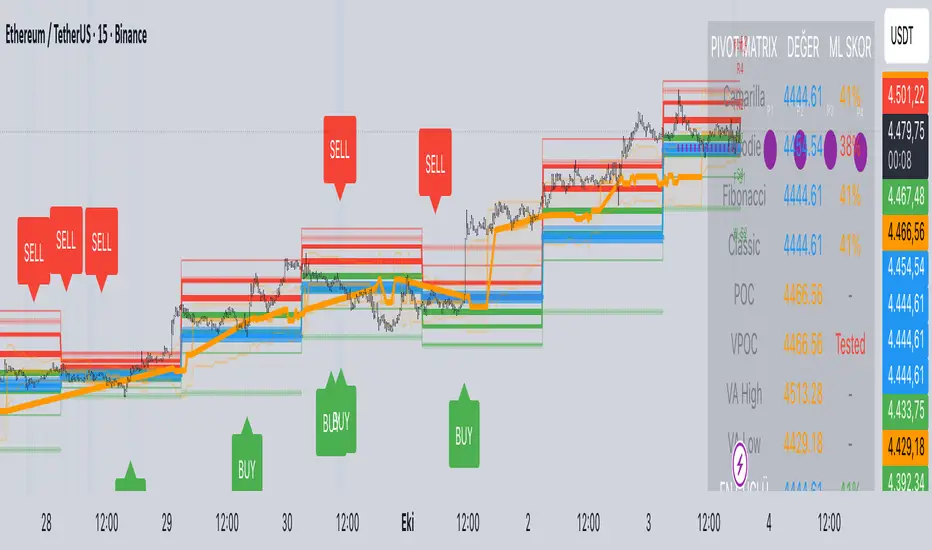
Predictive Pivot Matrix OHLC data, integrates volume profile for POC/Value Area tracking (including virgin POC), applies rule-based "ML" scoring to evaluate pivot strength via factors like proximity, volume, touches, trend, and confluence, monitors adaptive success rates, projects 5-day future pivots using trend/volatility, detects overlapping confluence zones, and generates visuals (lines, labels, table), alerts, and buy/sell signals on key crossings.
OHLC RTH & Globex SessionsHoD (High of Day)
OoD (Open of Day)
LoD (Low of Day)
CoD (Close of Day)
HoG (High of Globex)
LoG (Low of Globex)
HoY (High of Yesterday)
OoY (Open of Yesterday)
LoY (Low of Yesterday)
CoY (Close of Yesterday)