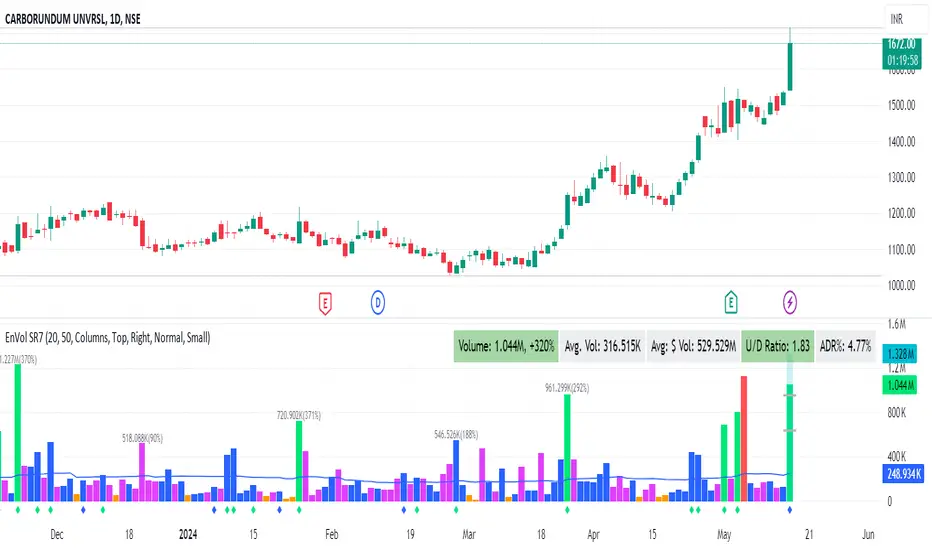
Enhanced Volume by SR7SiddharthaRay007's Enhanced Volume Indicator works on any Timeframe
⦿ Volume Labels:
1. Current Volume, Volume Change%, Average Volume, Average Doller Volume, Up/Down Ratio, ADR%.
=>Average value can be changed using 'Lookback Length' (Default: 20)
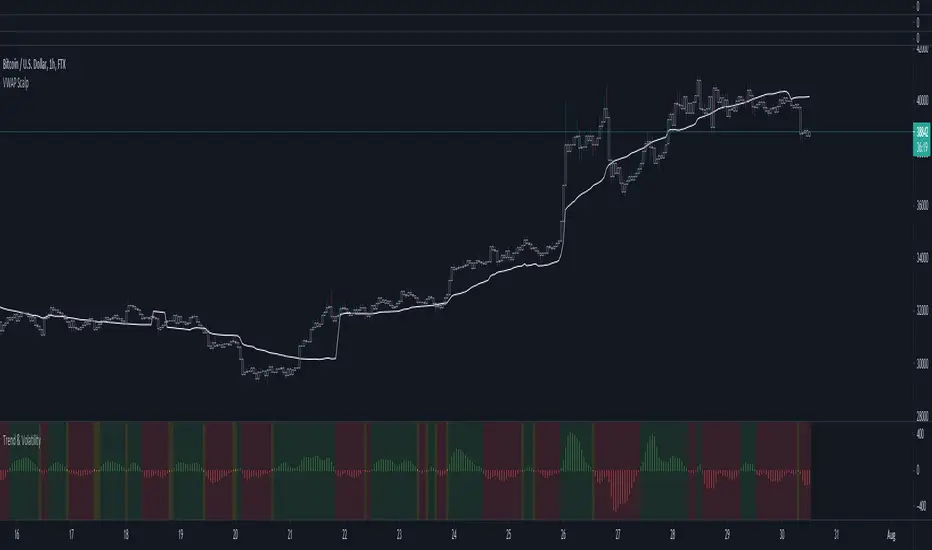
⦿ Simple Moving Average: MA (Default: 50). Color of MA changes based on the up down volume ratio.
1. Up/Down Ratio > 1: Blue
2. Up/Down Ratio < 1: Orange
⦿ Volume Bar Colors:
1. High Relative Volume Positive Candle: Lime Green .
2. High Relative Volume Negative Candle: Red .
3. Normal Volume Positive Candle: Blue .
4. Normal Volume Negative Candle: Fuchsia .
5. Low Relative Volume Positive/Negative Candle: Orange .
=>High Relative Volume > 300% of Average Volume; Low Relative Volume < 30% of Average Volume
⦿ Pocket Pivot (A pocket pivot is an up day with volume greater than any of the down days volume in the past 10 days)
1. 10 day Pocket Pivots: Lime Green Diamond below volume bar
2. 5 day Pocket Pivots: Blue Diamond below volume bar
⦿ 'Highest Volume (HV) ' on top of the Volume Bar:
1. Highest Volume Ever (HVE)
2. Highest Volume in Over a Year (HVY)
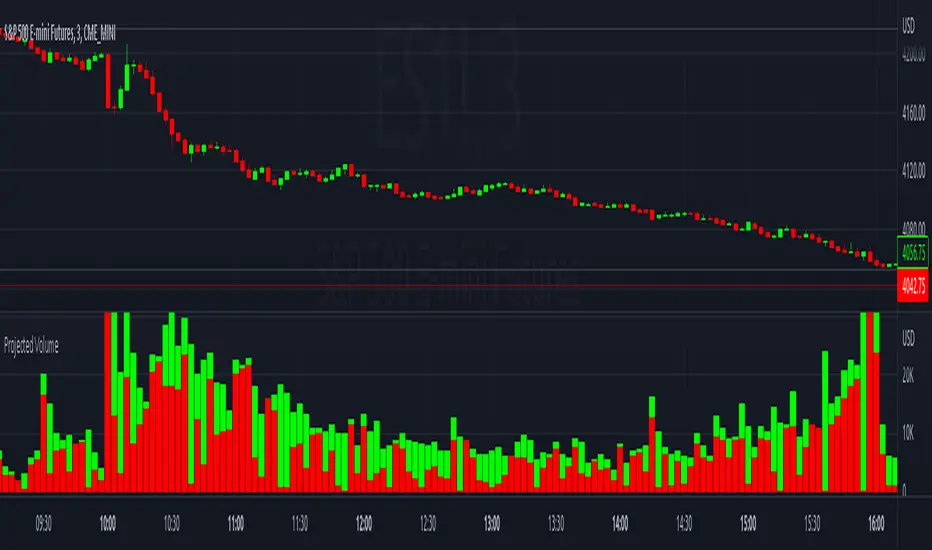
⦿ Projected Volume Bar: Aqua
⦿ Plot a line at 2x and 3x Average Volume and set Alerts
Indicateur Pine Script®