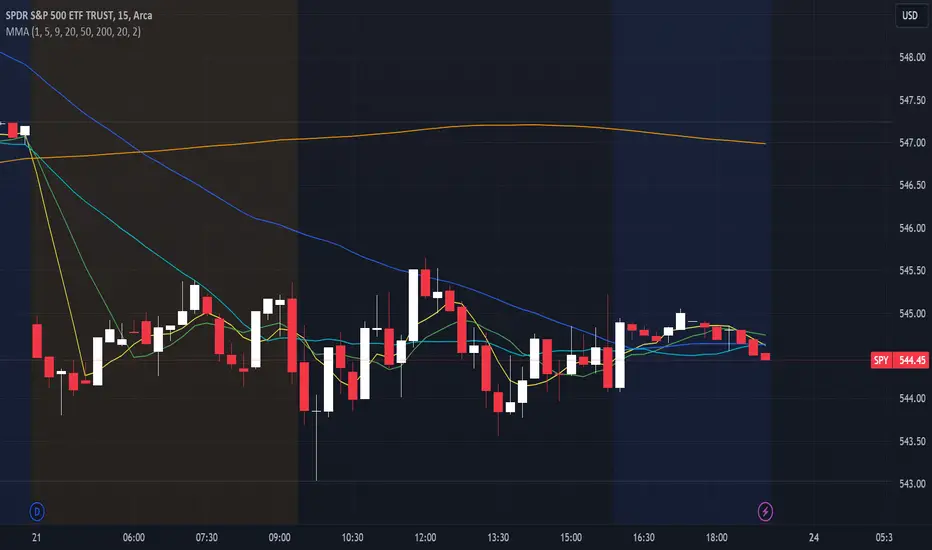
Periodic Moving AveragesIndicator plots three simple moving averages (MA) that are reset at the beginning of period, specified by a user.
Red MA is based on highs
Blue MA is based on close
Green MA one is based on lows.
Moving averages often act as support /resistance levels. They can also help to identify intraday trend. It is important to realize that none of the moving averages is universal as price behavior changes from day to day. On the chart I’ve highlighted several occurrences when one of MAs (different ones) provided support for price.
Parameters:
PERIOD – period for which MAs are plotted. They are reset at the beginning of each period. Period cannot be lower than chart’s timeframe
LENGTH – length of moving averages. If set to 0 then parameter is ignored and MAs are calculated on all bars, available in the period
VWAP? – if checked then moving averages will be calculated as volume weighted price
Disclaimer
This indicator should not be used as a standalone tool to make trading decisions but only in conjunction with other technical analysis methods.
Recherche dans les scripts pour "VWAP"

VWOP: Volume Weighted & Oscillated PriceWhile playing around with the standard "ta.vwap" I wondered why there was no length input, so I did some research on what the underlying calculation actually is, and did my best to augment it so as to allow for a variable length based on an oscillator value.
Normal VWAP = (Number of Shares Bought x Typical Price) / Total Volume
In my VWOP Calculation, typical price is replaced by selected moving average type or "matype" and then multiplied by the volume.
Then a total value is calculated using math.sum with a length value that changes according to a selected oscillator's value. The total is then divided by
the sum of just volume using the same oscillating length value. Result is then passed through the selected"matype" once more to give the final result.
Indicator designed for use as a entry/exit indicator in conjunction with more traditional moving averages and/or signal filters. Useful for taking volume + an oscillator into account along with price, instead of just the price as with a simple moving average.

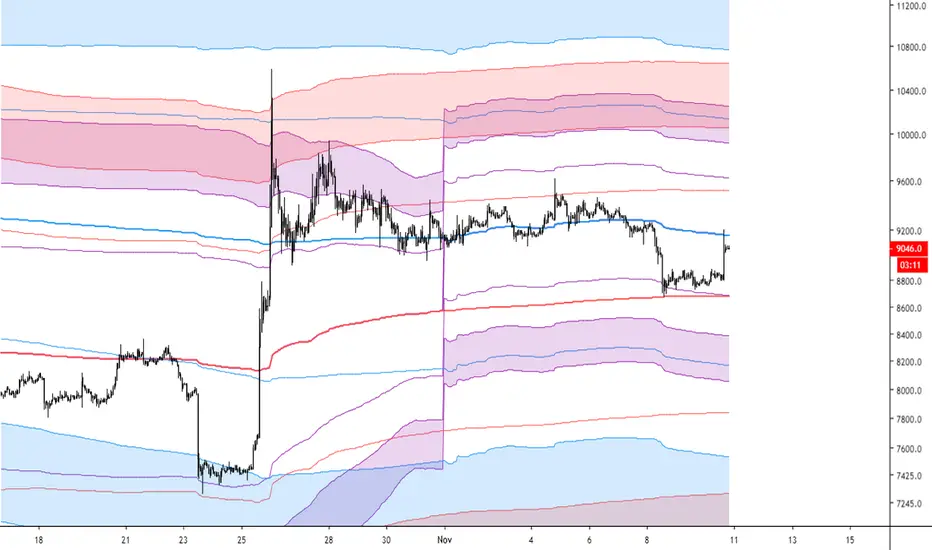
UV IndicatorUV Indicator (Ultimate VWAP Indicator) is using Volume Weighted Average Price to find Direction of the Trend, and Resistance & Support.
- Circle and Square shapes represent the point of Resistance and Support.
- Teal and Maroon background colors represent Uptrend and Downtrend of the Market.
- Numbers represent the Spread Percentages.

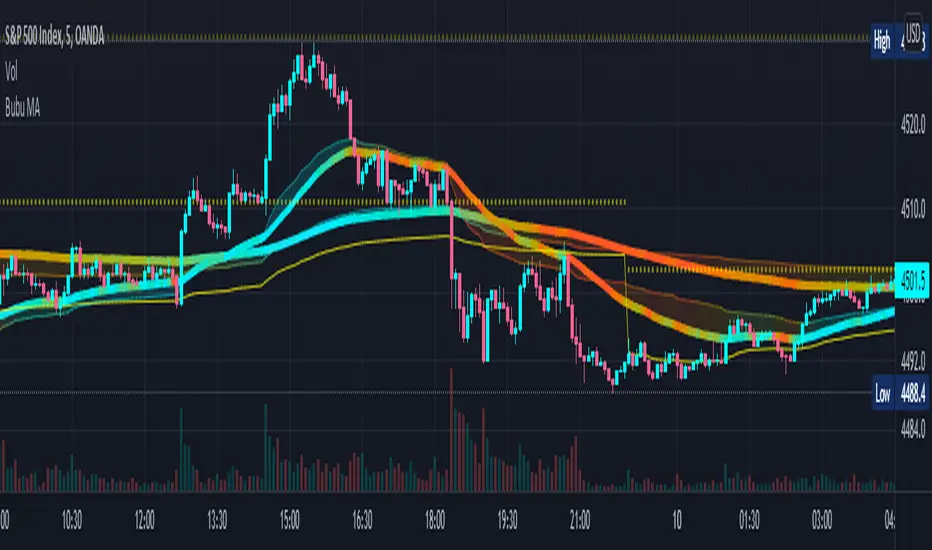
Bubu VWEMA & VWAPVolume Weighted Exponential Moving Average gives additional support / resistance lines to track as well as giving confidence to there respective EMAs.
A VWEMA will act much faster to volume spikes.
Intraday, Daily, and Weekly VWAPs are also shown to give more support / resistance lines to track.
The normal EMA lines (Thick ones) have colours based on a matrix calculated in the back. The Fast EMA is using 20 RSI indicators tracking how many cross above 50. The slow EMA is using 40 MACDs histograms when they cross mid point.
The VWEMA and the fill is graded on 20(fast) and 40(slow) VWEMAs crossovers.
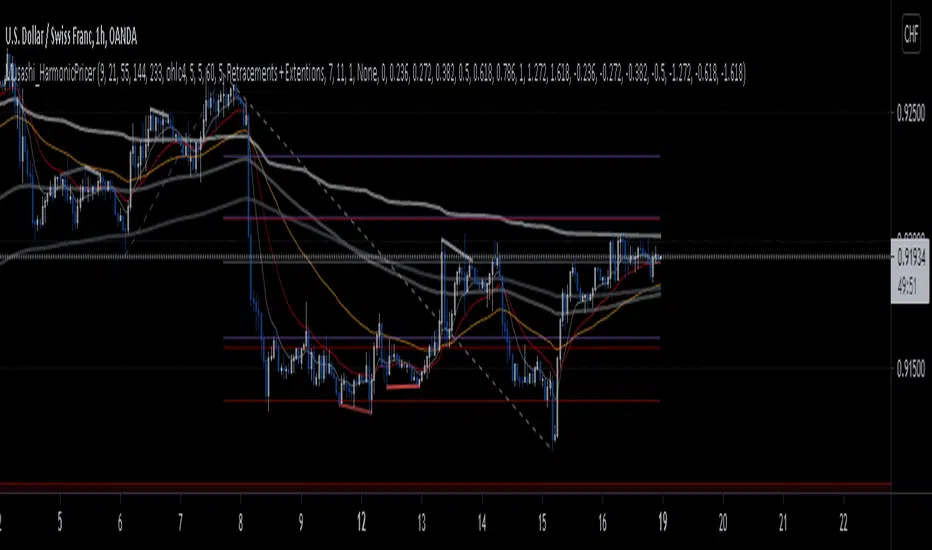
Musashi_HarmonicPricerMusashi HarmonicPricer was designed to my a tool for my personal trading strategy, and help me plot what I call ''Harmonic Structure', which is just a sophisticated way of using Fibonacci ratios based on the Elliott Wave Principle, Harmonic Patterns, and market structure.
- A distinctive element will be the integrated Fibonacci cluster tool, which plots automatically retracements and extensions of .272 (red) and .618 (purple) ratios, using the last two significant swings. For powerful usage, adjust the timeframes until they group into clusters or adjust the setup. You can also adjust the settings and select to plot only retracement, only extensions, both (default), the deviation (default = 7), and the historical approach.
- To be used wisely properly, you require multi-timeframe analysis, reason why you will find Monthly and Yearly VWAPs, as they won't change while you're switching timeframes, and fib-based EMAs to provide trend and dynamic support.
- Finally, the indicator will plot in price Hidden and Regular divergences for any oscillator you have on screen.
Have a good day.

Anchored VWAP and Swing Failure PatternIndicator that allows to visualize swing failure patterns on every timeframe. The lines are anchored VWAPS that snipe support/resistance.
Feel free to ask question

MTF VWAP WITH STDEVSThis script displays multiple standard deviations for multiple vwaps. It also has options to use custom methods of calculating standard deviations.
Institutional Rolling VWAPs • 3 lines Institutional Rolling VWAPs • 3 lines + editable σ bands. 3 x modifiable vwaps, time anchored, same for ltf and htf

Multiple Moving Averages, Bollinger Bands, VWAP Options - Lett5 simple moving averages.
You decide:
1. The type of moving average
2. The length of the moving average
3. To show Bollinger Bands
4. To show VWAP.
Crossover Alerts for Yesterday O/H/L/C , Today Vwap [Zero54]This is a very simple script/indicator that trigger alerts every time the script triggers the following conditions.
1) Script crosses yesterday's (previous day's) high
2) Script crosses yesterday's (previous day's) low
3) Script crosses yesterday's (previous day's) open
4) Script crosses yesterday's (previous day's) close
5) Script crosses today's vwap.
I developed this to keep track of the scripts I follow and I find it useful. Hope you will find it useful too.
Steps to use:
1) Open the ticker for which you want to set the alerts.
2) Add this indicator to the chart.
3) Right Click on the text and set choose "Add Alert"
4) After you have done with setting up the alert, feel free to remove the indicator from the chart. It is not necessary for the indicator to be added in the chart in order for it to work.
5) Repeat 1-4 for all the scripts for which you want to set the alerts.
Be advised: During market open, if you have set alerts for multiple scripts, a tsunami of alerts may be triggered.
If you like this alert indicator, please like/boost it. Feel free to re-use this code however you may wish to. Cheers!

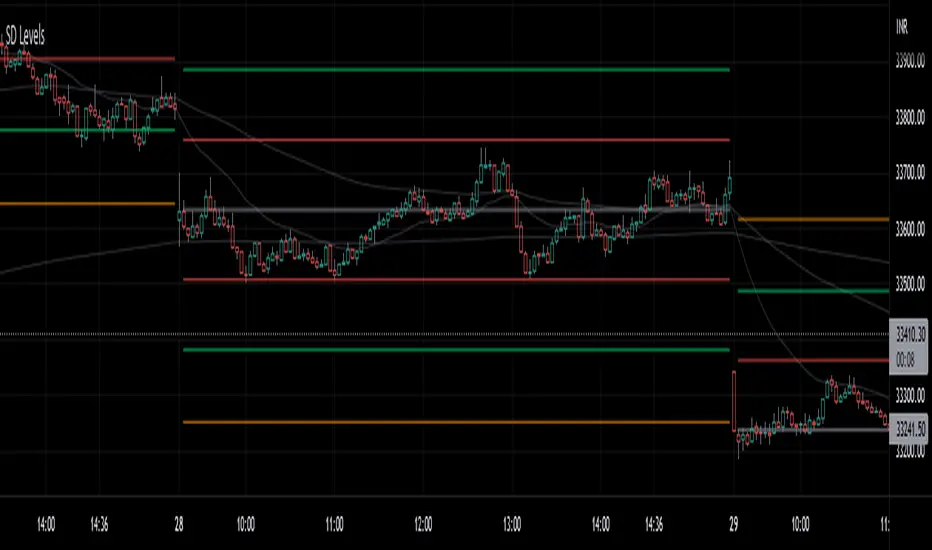
SD LevelsSD Levels is an indicator for the gap-up gap down markets
Works best on 5minute and lower time frames.
Involves standard deviation levels, Emas and Vwap.
Colorful lines are standard deviation levels which are +0.33,-0.33,+0.66,-0.66,+1.00 and -1.00 based.
Static Gray line is settlement line based on the first candle of the day and the tf you choose (default source OHLC4, also works good on close source)
Byzantium VWAP DistanceThe percent distance between price and a session VWAP.
Zones of extremes are added with thresholds based on bitcoin history, but they can be adjusted or removed in the settings.
Works best on low time frames for scalping purposes of course.

Alternative Daily Reference Points for Intra-hour ChartsThis is a different version of my www.tradingview.com used high, lows and pivots. One problem with pivot points is the number of calculation methods. The alternative version shows historical lows, closes, highs one basic period back.
► On lower timeframes - hour or less - this will show High, Low and Close from the previous day, two days ago, the previous week and two weeks ago and VWAP.
► On 1h daily reference points need to be enabled. On higher timeframes, daily reference points will not be shown. On the daily chart, weekly levels need to be enabled to still show and will be disabled on all higher periods.
► It is configured only for normal timeframes. If you use something like 17-minutes timeframe, you will have to allow this timeframe in the code.
Bear in mind, using all lines at the same time can be a little confusing and price doesn't react to every one of them. You can probably disable lows in the uptrend or scratch closes to simplify your chart.
Have a great trade!

Price Deviation from vwapIt indicate the deviation of avg price from vwap. It is best use with 5 min candlestick


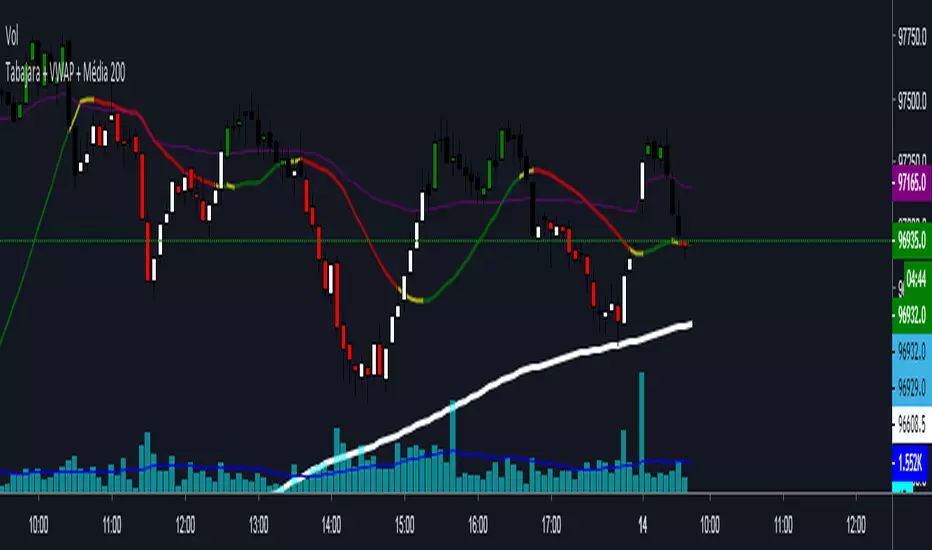
Tabajara + VWAP + Media 200Tabajara was created by André Machado, the Wall Street Ogre.
The Tabajara is accompanied by an average of 200 periods and the daily VWAP.
Suggestions will be very welcome!
Good profit and good trades!
Att
Felipe Kruger
OHLC/GAP/EMA/VWAP all in oneThis script will plot the current open and previous high low and close. The overnight gap between the current open and the previous close is highlighted. Also included is the 10 EMA, 20 EMA and the VWAP. This is good for people who are limited on the amount of indicators they can use.

IVAN's Anvil2 EMA VWAP comboThis script incorporates the 9,14,21,55,100 and 200 EMA as well as the VWAP. I placed these on one script to help decluter the screen and allow users to turn on and off lines without having to add or subtract new indicators. great for the new guy... seek Anvil 2 for guidance in life
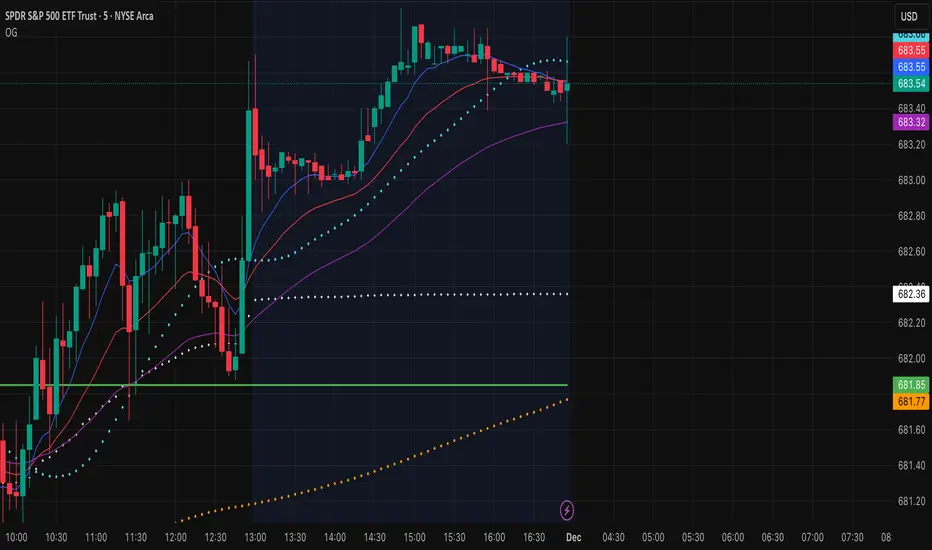
OG INDICATORTrade Legacy All-in-One Institutional Indicator
Unlock institutional-grade trading with this comprehensive Pine Script indicator. Seamlessly integrates multiple EMAs, SMAs, VWAPs, and ORB displays into one effortless panel—mimicking pro standards for quick, intuitive analysis.
Per Trade Legacy (Jackie): "This is the only indicator you need for profitability." Pair it with your strategy for powerful confluence, boosting edge and profits.
Simple setup, zero clutter. Premium access via invite-only.
Institutional Rolling VWAPs • 3 lines + editable σ bands3 rolling vwaps, time stamped, same on htf and lft for high level execution

Anchored VWAPs + DeviationsAnchored VWAPS
*6 anchors to play with
*Pre-defined anchors from pivot points (May need manual adjustment due to timezone difference)
*Drag each anchor right from the screen instead of manually going to the settings>inputs
Deviations:
*Select from which anchor should the deviations start from
*Manually input the desired deviation value/ratio, can be customised
**Tips: To avoid clicking on the AVWAPS to enable the dragging line, just click on the title of the indicator.
***Work in progress
