Dynamic Volume ProfileThe result of standard volume profile is fix for a specified period of time. However, in this script the result is dynamic, because its calculated for every bar. In this script you can see the change of Point of Control , Value Area High and Value Area Low in real time.
Point of Control is the price level for the time period with the highest traded volume.
The area between value area low and value area high (green background) is the area where 70% of traded volume happen. You can customize this percentage value in input section.
Trader can customize input:
Period length
Number of rows
Percentage of value area
Reference:
www.tradingview.com
Recherche dans les scripts pour "Volume"

Master Volume Indicator (v6)This script is a comprehensive volume analysis tool built in Pine Script v6, designed for traders who want more insight into how volume behaves beyond simple bars.
Features:
📊 Volume Histogram – Colored columns showing up vs down volume (by close-to-close change, or close vs open).
📈 Two General SMAs – User-defined moving averages of volume for trend and momentum analysis.
🟢🔴 Up vs Down Volume SMAs – Separate moving averages of up-volume and down-volume.
🎨 Dominance Fill – A shaded region showing whether buying (green) or selling (red) pressure dominates on average.
How to Use:
Use the dual SMAs to spot shifts in volume momentum.
Watch the dominance fill to quickly see whether buyers or sellers are in control.
Combine with price action or other indicators to confirm breakouts, trend strength, or reversals.
Customization:
Adjustable SMA lengths for general volume.
Adjustable SMA length for Up/Down dominance.
Choice of coloring by close vs prior close or close vs open.
Flexible volume color settings.
This indicator is suitable for stocks, forex, crypto, and futures. It gives traders a clear view of where the weight of market activity is leaning: toward buyers or sellers.

RVOL Color-Coded VolumeRVOL Color-Coded Volume Indicator
This tool visualizes volume intensity through color-coded bars in a separate panel, making it easy to identify significant market moves driven by unusual volume.
Key Features:
- Displays volume bars with varying colors and intensities based on RVOL (Relative Volume)
- Shows a customizable moving average line for volume reference
- Includes alert conditions for different RVOL thresholds
Color System:
Blue shades (Bullish):
- Light: Normal volume (RVOL < 1)
- Medium: Above average volume
- Dark: Heavy buying volume
- Solid: Extreme volume surge
Pink shades (Bearish):
- Light: Normal volume (RVOL < 1)
- Medium: Increased selling
- Dark: Heavy selling
- Solid: Extreme selling pressure
Gray shades (Neutral):
- Used when opening and closing prices are equal
- Intensity varies with RVOL level
Additional Features:
- Dotted threshold lines for easy reference
- Background highlighting for extreme volume events
- Data window shows exact RVOL values
- Multiple alert conditions for volume thresholds
The indicator helps traders spot potential trend changes and momentum shifts by highlighting unusual volume patterns without interfering with price analysis.

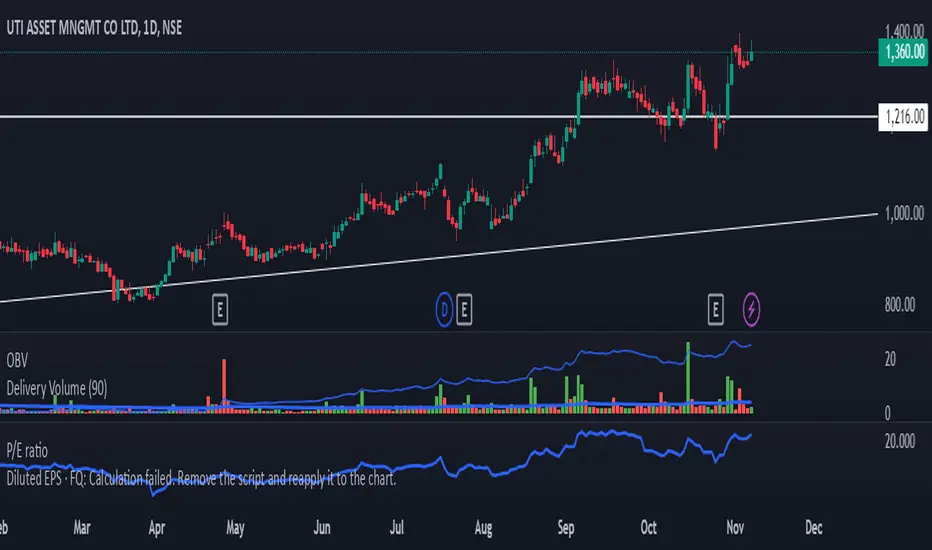
Delivery Volume IndicatorDelivery Volume Indicator
The Delivery Volume Indicator is designed to provide insights into trading volume specifically delivered on a daily basis, scaled in lakhs (hundreds of thousands) for ease of interpretation. This tool can be especially useful for traders looking to monitor delivery-based volume changes and trends, as it helps to distinguish between bullish and bearish volume flows.
Key Features:
Daily Volume in Lakhs: The indicator pulls daily volume data and scales it to lakhs for more readable values.
Bullish/Bearish Color Coding: The indicator color-codes volume columns to reflect market sentiment. Columns are displayed in green when the price closes higher than it opens (bullish) and in red when the price closes lower than it opens (bearish).
Adjustable EMA: A customizable Exponential Moving Average (EMA) is applied to the scaled delivery volume. The EMA line, displayed in blue, helps smooth out volume trends and allows traders to adjust the period for personal strategy alignment.
How to Use:
Observe the delivery volume changes to track market sentiment over time. Increased bullish delivery volume could indicate accumulating interest, while increased bearish delivery volume might suggest distribution.
Utilize the EMA to identify longer-term trends in delivery volume, with shorter EMA periods for quick volume shifts and longer periods for gradual trend changes.
This indicator is ideal for traders seeking volume-based insights that align closely with price action.
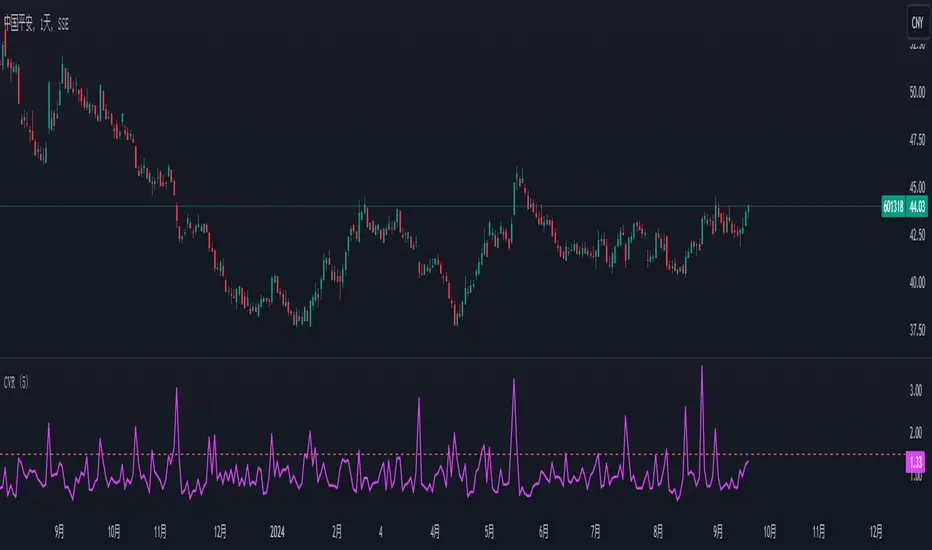
China's stock market volume ratio1. Introduction to Volume Ratio:
In China's stock market, the volume ratio is an indicator used to measure relative trading volume. It compares the average volume per minute after the market opens to the average volume per minute over the past five trading days.
2. Application of Volume Ratio:
When there is a sudden surge in volume, the volume ratio chart will show a sharp upward break, indicating an increase in trading volume (initial market movements can be disregarded). Conversely, when volume contracts, the volume ratio will move downward.
If the volume ratio is greater than 1, it indicates that the average trading volume per minute for the current day is higher than the average over the past five days, signifying increased trading activity.
If the volume ratio is less than 1, it means that today's trading volume is lower than the average of the past five days, indicating decreased trading activity.
3. Volume Ratio Calculation:
The formula for calculating the volume ratio is:
Volume Ratio=Current Total Volume/(Average Volume per Minute over the Last 5 Days * Accumulated Market Open Time (in minutes))
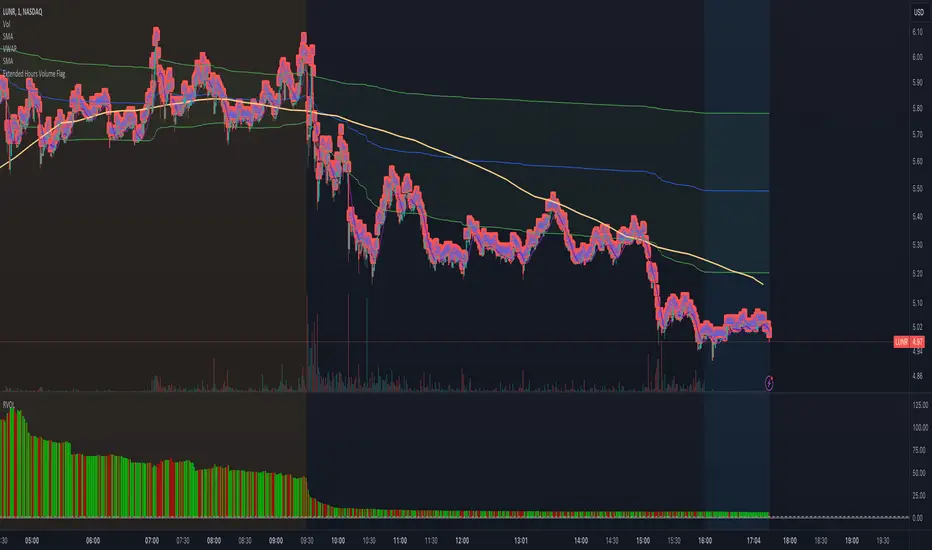
Extended Hours Volume FlagOverview: The Extended Hours Volume Flag Indicator is a powerful tool designed for traders who are interested in monitoring and analyzing the volume activity during the extended trading hours—specifically the premarket (4:00 AM to 9:30 AM) and afterhours (4:00 PM to 8:00 PM) sessions. This indicator identifies and flags stocks where the trading volume during these extended hours exceeds 20% of the Average Volume (AVOL) during regular trading hours. Such occurrences often signal unusual activity or potential market-moving events, which can be crucial for informed trading decisions.
Concept: Volume is a critical factor in trading, often providing insights into market sentiment and potential price movements. However, volume during extended hours can be particularly revealing as it may indicate heightened interest or activity outside of the regular trading session. The Extended Hours Volume Flag Indicator is built on the concept that significant volume during premarket or afterhours trading sessions, relative to the average regular session volume, could be an early indicator of upcoming volatility or trends.
How It Works:
Session Segmentation: The indicator distinguishes between regular trading hours (9:30 AM to 4:00 PM) and extended hours (premarket and afterhours). It accumulates the trading volume separately for these sessions.
Volume Comparison: It calculates the Average Volume (AVOL) over a user-defined period (default is 14 days) during regular trading hours. It then compares the extended hours volume to this AVOL.
Flagging Condition: If the volume during the extended hours exceeds 20% of the AVOL, the indicator flags the stock with a warning symbol on the chart. This visual cue helps traders quickly identify stocks with potentially significant afterhours or premarket activity.
Reset Mechanism: The accumulated volumes reset at the start of the new trading day, ensuring accurate calculations for each day.
Usage: This indicator is ideal for traders who are looking for early signals of market activity outside regular hours, which might not be immediately visible when looking solely at price action. It is particularly useful for day traders and swing traders who want to keep an eye on potential premarket or afterhours catalysts.
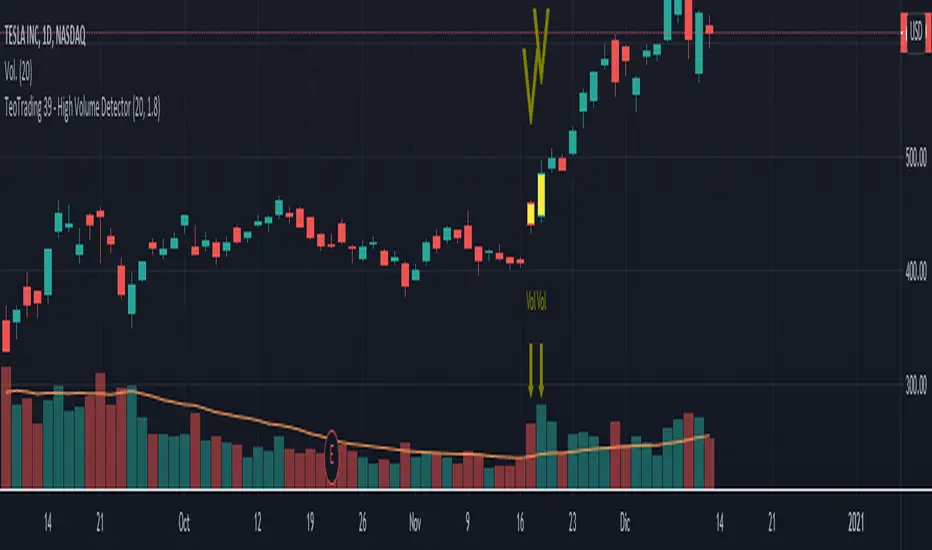
TeoTrading 39 - High Volume DetectorThis indicator prints "V" signal when the Volume is higher than a specified threshold.
You can change input parameters for:
- Quantity of Candles to calculate the volume average.
- Percent of Volume: for example 1,8 is 80% higher than the average.
- Parameter to change the Bar Color when the volume is higher than the threshold.
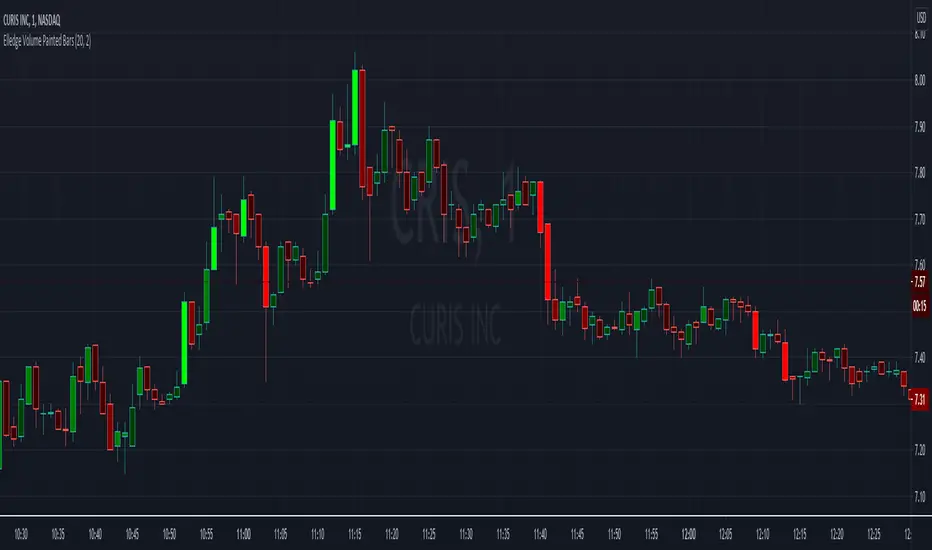
Elledge Volume Painted BarsThis indicator uses the volume and average volume for the given candle to determine the color for the given candle. The brighter the green, the higher the buyer volume. The brighter the red, the higher the seller volume.
The volume average is used to determine the bar's color. Under the average yields a dark color. Over the average yields the middle setting. While over 2x average volume gives the brightest color.
Quantum Tick VolumesMany forex traders assume there is no volume in the foreign exchange market. And they would be correct. There is no central exchange, not yet anyway. And even if there were, what would it report?
What there is however is activity, and this is captured as tick volume. After all, volume is simply displaying activity, the buyers and sellers in the market. So for volume read activity, and for activity read volume – simple.
First, the indicator paints the volume bars the same color as the candles on the chart. This means you can quickly match price and volume bars together. If you’re trading using volume and price as your core methodology, this is imperative. Your analysis will depend on a fast interpretation of the volume price relationship.
Second, the indicator prints a dynamic midpoint based on the daily data, giving you an instant picture of whether the volume is high, medium or low in the time frame selected. Again, this is essential for correctly analyzing the price volume dynamic. After all, what is average volume in the London session, may be high volume in the Asian session. The dynamic midpoint level reveals this instantly on the indicator, helping you make sense of the highs and lows of each volume bar.

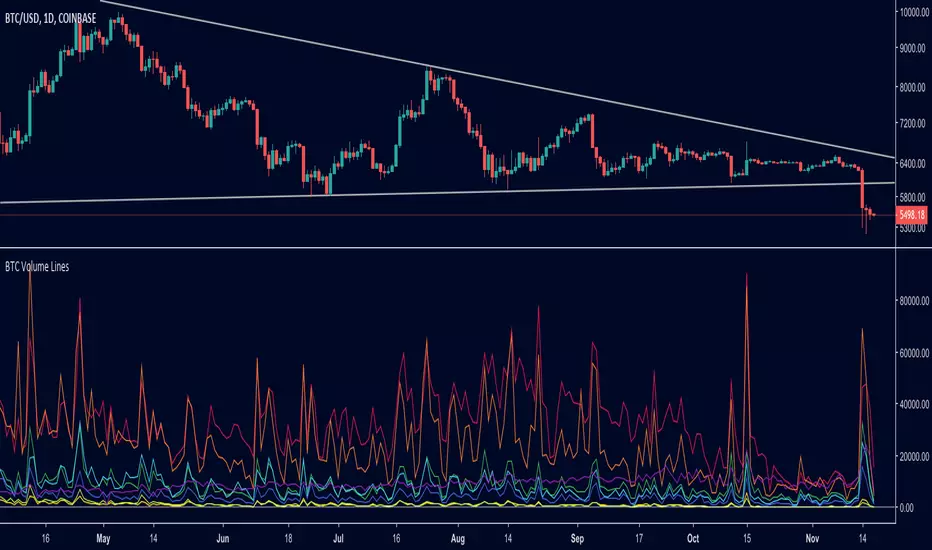
BTC Volume Lines [v2018-11-17] @ LekkerCryptisch.nlCombine the volume of 8 BTCUSD exchanges in one graph.
Three use cases:
1) See the absolute volumes in one graph
2) See the relative volumes in one graph
3) See the deviation of the EMA the volumes in one graph
AR-Volume ProfileAR-Volume Profile plots two volume profiles on your chart at the same time:
• Daily Volume Profiles (multiple days back, always visible)
• Hourly Volume Profiles (last N hours, designed for ≤ 15m timeframes)
It’s built to stay clean, readable, and performance-safe, while still letting you see where volume built up across recent structure.
________________________________________
What You See On Chart
- Daily Profiles (Multi-day) Increased using Polylines
• Shows Volume Profile histograms for the last X days back (you choose).
• Each day is drawn as a horizontal histogram inside that day’s session.
• Color logic:
o Base (all volume)
o Value Area (VA)
o POC (Point of Control)
- Daily Levels (POC / VAH / VAL)
• Adds optional horizontal levels:
o POC
o VAH
o VAL
• You can choose whether to draw these:
o Today only, or
o Past days too (if enabled in your version)
• Levels can optionally extend to the right to act like HTF references.
- Hourly Profiles (Intraday context)
• Shows profiles for the last N hours (you choose).
• Meant to be used on 15m and below for clean intraday mapping.
• Optional hourly level lines are available too.
________________________________________
How It Calculates Volume
This is a bar-based approximation of a volume profile:
• Each candle’s volume is distributed across its price range based on overlap with bins.
• Flat candles (very small range) are placed into the nearest bin.
• This gives a reliable “where volume accumulated” view without needing exchange order-by-order data.
________________________________________
Key Inputs Explained
Daily Profile (Always Visible)
• Days back to show (Daily)
How many previous daily profiles you want displayed.
• Daily bins
Higher bins = more detail (but higher object usage).
• Daily Value Area %
Default 70% like traditional VP.
• Daily profile width (% of day)
Controls how wide the histogram is inside the day.
• Daily profile side
Left or Right inside each day.
• Show Daily POC/VAH/VAL lines
Enable level lines.
• Extend Daily levels to the right
Makes daily levels act like forward HTF liquidity/targets.
Hourly Profile (15m and below)
• How many hours
Number of hourly profiles to display.
• Hourly bins
• Hourly profile width (% of hour)
• Hourly profile side
• Show Hourly POC/VAH/VAL lines
________________________________________
Best Use Cases
- Intraday trading (scalping + day trading)
- Mapping premium/discount volume build-ups
- Pairing with:
• liquidity sweeps
• order blocks
• HTF levels
• session ranges
• breaker / mitigation concepts
________________________________________
Recommended Settings (Practical)
If you want more daily history, you must balance line budget.
Example setups:
“Clean Daily Focus” (more days)
• Daily bins: 60–80
• Days back: 10–20
• Hours: 0–4 (or lower)
• Budget mode: Daily First
“Intraday Heavy” (more hourly detail)
• Hourly bins: 30–50
• Hours: 8–12
• Days back: 3–7
• Budget mode: Hourly First
________________________________________
Notes / Limitations
• Hourly profiles are designed for ≤ 15m timeframes.
• This uses approximate volume distribution from candle ranges (not exchange tick VP).
• If volume data is missing on the symbol/broker, results will be less meaningful.
• Visual output depends on instrument liquidity + chart zoom.

DTR Volume 1DDTR Volume 1D is a powerful tool to analyze volume and market activity across different trading sessions. It provides detailed session-level insights to help traders understand where the market is most active and identify key price levels.
Key Features:
1. Session Volume Profiles
- Displays volume distribution for each session.
- Supports Tokyo, London, New York, Daily, Weekly, Monthly, Quarterly, and Yearly sessions.
- Optional Forex session boxes without profiles.
2. Volume Analysis Tools
- Highlights POC (Point of Control) – the price level with the highest traded volume.
- Shows VAH (Value Area High) and VAL (Value Area Low) with optional Value Area Box.
- Tracks live session zones for real-time monitoring.
3. Customizable Display
- Adjustable resolution for finer or coarser profiles.
- Multiple bar modes for different visual styles.
- Fully customizable colors for up/down volume, boxes, lines, and POC.
- Option to smooth volume data for assets with large volume spikes.
4. Data Type Options
- Supports standard Volume or Open Interest data.
5. Session Boxes and Labels
- Automatically draws session boxes with high/low range.
- Optional session labels for easy identification.
6. Smart Calculations
- Auto-detects session start and end.
- Calculates volume profiles based on user-defined resolution.
- Highlights important levels dynamically during the session.
DTR Volume 1D is ideal for traders who want a clear, actionable view of volume distribution and session dynamics, helping you make better trading decisions with session-level insights.

Delta Volume BubblesDelta Volume Bubbles
Visualize order flow delta at specific price levels with automatic threshold detection
Overview
Delta Volume Bubbles is an order flow indicator that displays volume delta at individual price levels within each candle, rather than showing aggregate candle delta. This level-by-level analysis shows where buying and selling pressure is concentrated, helping identify key support and resistance zones based on actual order flow.
Key Features
Level-Based Delta Calculation : Unlike traditional delta indicators that show total candle delta, this indicator calculates and displays delta for each price level within the candle's range, providing granular order flow information.
Automatic Threshold Detection : The indicator automatically calculates dynamic thresholds using a rolling window analysis (similar to volume spike detection). Three threshold levels are determined:
2.5x average delta (normal bubbles)
3.5x average delta (large bubbles)
5.0x average delta and above (huge bubbles)
Intrabar Analysis : Uses lower timeframe intrabar data to calculate delta for each price level. The indicator automatically selects the appropriate lower timeframe based on your chart timeframe.
Delta Calculation : Uses proprietary delta deduction logic that considers:
Candle body size and range
Upper and lower shadows (wicks)
Body-to-range ratio
Price action characteristics
Proportional Delta Distribution : When an intrabar crosses multiple price levels, its delta is distributed proportionally based on the overlap between the intrabar's range and each level.
Dynamic Level Sizing : Price levels are calculated using ATR (Average True Range) divided by 10, with a minimum of the symbol's minimum tick size.
Visual Bubble Sizes : Three distinct bubble sizes correspond to the three threshold multipliers, indicating the magnitude of delta at each level.
Color Coding :
Green bubbles indicate bullish delta (buying pressure)
Red bubbles indicate bearish delta (selling pressure)
Optional Labels : Display delta values directly on bubbles with K/M/B formatting (K for thousands, M for millions, B for billions).
How It Works
Level Creation : For each confirmed candle, the indicator divides the price range into multiple levels based on ATR calculations. Each level represents a specific price zone within the candle.
Intrabar Data Collection : The indicator requests lower timeframe intrabar data (OHLCV) to analyze price action within the main candle. The lower timeframe is automatically selected based on your chart timeframe.
Delta Calculation : For each intrabar, the indicator calculates delta using proprietary logic that considers body size, wicks, and price action characteristics.
Level Distribution : Each intrabar's delta is distributed across all price levels it crosses, proportionally based on the overlap between the intrabar's range and each level.
Threshold Calculation : The indicator maintains a rolling window of maximum deltas from previous candles (last 300 bars). It calculates separate averages for positive and negative deltas, then applies multipliers (2.5x, 3.5x, 5.0x) to determine thresholds.
Bubble Display : Only price levels with delta exceeding the 2.5x threshold are displayed as bubbles. The bubble size indicates which threshold was exceeded:
Normal size = 2.5x threshold
Large size = 3.5x threshold
Huge size = 5.0x+ threshold
Label Display : If enabled, labels show the exact delta value for each displayed bubble, formatted with K/M/B notation for readability.
Use Cases
Support and Resistance Identification : Large delta concentrations at specific price levels often indicate significant support or resistance zones where institutional traders are active.
Order Flow Analysis : Understand where buying and selling pressure is concentrated within each candle, helping identify potential reversal or continuation zones.
Entry and Exit Timing : Use delta bubbles to identify optimal entry and exit points based on actual order flow, not just price action.
Market Structure Analysis : Identify key price levels where significant order flow activity occurs, helping understand market structure and potential price reactions.
Confirmation Tool : Combine with other technical analysis tools to confirm signals. For example, a bullish delta bubble at a support level can confirm a potential bounce.
Settings
Show Delta Bubbles : Toggle to enable/disable bubble display
Show Numbers in Bubbles : Toggle to show/hide delta value labels
Bullish Delta Color : Customize color for bullish (positive) delta bubbles
Bearish Delta Color : Customize color for bearish (negative) delta bubbles
Technical Notes
The indicator uses barstate.isconfirmed to ensure calculations only occur on confirmed bars, preventing repainting.
Thresholds are calculated automatically and adapt to market conditions.
The rolling window maintains the last 610 maximum deltas for threshold calculations.
Level size is calculated using ATR(14) divided by 10, adapting to current market volatility.
Delta distribution uses proportional overlap calculations when intrabars cross multiple levels.
Best Practices
Use on timeframes where intrabar data is available (typically 5 minutes and above for most symbols).
Combine with price action analysis - delta bubbles show where order flow is concentrated, but price action confirms the significance.
Look for clusters of bubbles at similar price levels - multiple bubbles at the same level may indicate support or resistance.
Pay attention to bubble sizes - larger bubbles indicate higher order flow activity.
Use in conjunction with other order flow tools for comprehensive market analysis.
This indicator breaks down delta into price levels, providing level-by-level order flow information based on market microstructure.

Breakout Volume AlertThis indicator helps traders identify true breakouts confirmed by strong volume.
It automatically highlights candles where the current bar’s volume is greater than 1.5× the 10-bar average volume, confirming institutional participation and momentum strength.
How It Works:
A yellow line tracks the 10-bar volume average.
When current volume exceeds 1.5× the average, the bar turns green — signaling strong buying/selling interest.
Normal or weak bars remain faded red.
You can use this with your Price Action + Multi-Timeframe strategy to validate breakouts, retests, and reversals
Best Used For:
Breakout + Retest confirmation (Intraday or Swing)
Volume spike detection before momentum moves
Filtering fake breakouts with low participation
Works perfectly with 5m / 15m / 30m / 4H charts
Settings:
Default volume average length = 1
Volume strength multiplier = 1.5×
Add alert: "Volume > 1.5x average" for instant notifications

TFT VIP TRADE BODY & VOLUME RANGE x-times (LAST BAR): Body & Volume vs Last 10 compares the current candle’s body size and volume to the SMA of the last N candles (default 10) and shows the result as “×ratio”. It’s designed to keep the chart uncluttered while giving you two key reads from the 5-minute timeframe:
• Previous 5m (closed) bar → fixed label with its final ratios.
• Current 5m (running) bar → live-updating label with real-time ratios.
Multi-timeframe behavior
• On 1-minute charts:
• A stamp for the last closed 5m is placed on that 5m block’s final 1-minute bar.
• A live label shows the current 5m ratios on the current 1-minute bar.
→ You’ll always see two labels max (closed 5m + running 5m).
• On 5-minute charts:
• One label on the previous 5m candle (closed).
• One label on the current 5m candle (running).
• On other timeframes:
• A single label shows the current 5m ratios on the last bar.
What the numbers mean
• Body ×r = abs(Close − Open) compared to SMA(body, N) on the reference TF.
• Vol ×r = Volume compared to SMA(Volume, N) on the reference TF.
• Color cue: ≥3× red, ≥2× orange, otherwise teal.
Inputs
• Lookback (bars): N for the SMA comparison (default 10).
• Decimals: number of decimals in the ×ratios.
• Vertical position: Above bar / Below bar.
• Layout: Side by side (previous left, current right) or Stacked.
• Horizontal offset (bars): space left/right from the anchor bar (for side-by-side).
• Vertical offset (ATR×): lift/drop labels using ATR for consistent spacing.
Notes & Tips
• Focuses on candle body, not high–low range.
• Keeps the chart clean: at most two labels on 1m/5m.
• Great for spotting impulsive 5m moves (body expansion) and volume surges relative to recent history.
Limitations
• No alerts baked in (by design).
• Ratios use SMA of the last N bodies/volumes; change N to suit volatility.
⸻
If you want, I can add a short tagline version for the “short description” box or wire in alert conditions (e.g., trigger when Body ≥ 2× or Vol ≥ 3×).

Buy/Sell Volume Spike RadarThis indicator highlights unusual volume spikes and classifies them as buying pressure or selling pressure using price action context. It’s designed to spot when the crowd is stepping in aggressively — either on the bid (sell spikes) or on the ask (buy spikes).
How it works:
Compares current volume against a moving average of volume (default 50 bars).
A spike is flagged when volume is above the threshold (default = 2× vol MA).
Candle body position in its range determines direction:
Close near the top of the bar = Buy Spike.
Close near the bottom = Sell Spike.
Doji-like candles are filtered out using a minimum body % rule.
Visuals:
Background tint: teal for buy spikes, red for sell spikes.
Labels: optional tags on the chart showing “High BUY vol” or “High SELL vol”.
Histogram (lower pane): plots signed volume (positive = buy pressure, negative = sell pressure) with spikes emphasized.
Status table: shows live volume, moving average, and current spike status.
Use cases:
Spot institutional activity or panic selling.
Confirm breakouts or breakdowns with real buying/selling pressure.
Filter false moves by requiring both price + volume confirmation.
⚠️ Note: Options volume/flow data is not available in Pine/TradingView. This tool only analyzes the underlying’s price + volume. For true options flow, use a dedicated options analytics platform.

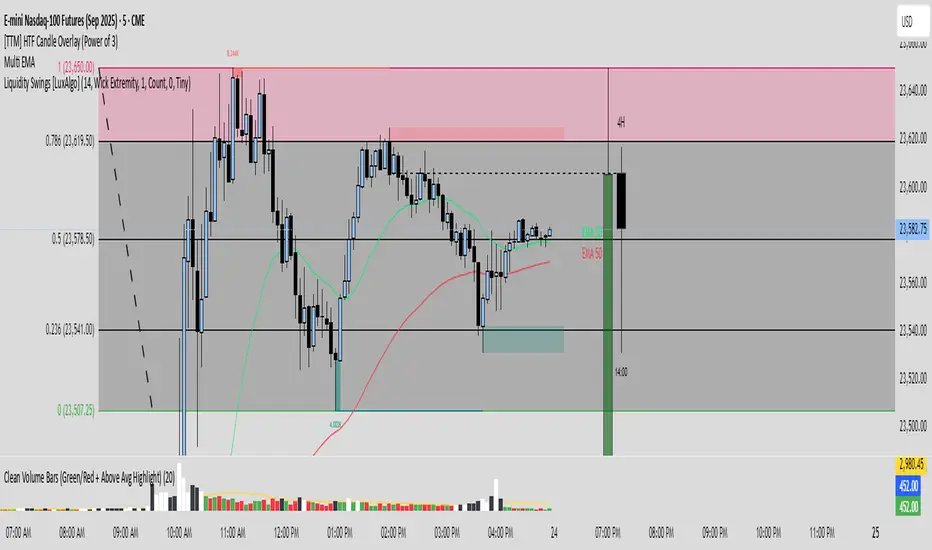
Clean Volume Bars (Green/Red + Above Avg Highlight)📊 Clean Volume Bars (Green/Red + Above Avg Highlight)
This script provides a clearer view of market volume by combining standard green/red volume bars with dynamic highlights for above-average activity.
Features:
✅ Green / Red Volume Bars – standard visualization:
Green when the candle closes higher than it opened
Red when the candle closes lower than it opened
✅ Average Volume Line – a simple moving average (default 20 periods) to track relative volume.
✅ Above Average Highlights – bars that exceed the average volume are emphasized:
White for above-average bullish volume
Black for above-average bearish volume
How to Use:
Look for white volume spikes during up candles → potential strong bullish activity.
Watch for black volume spikes during down candles → potential strong bearish pressure.
Combine with price action, trend, or other indicators for confluence (this is not a standalone trading system).
High Volume SignalHigh Volume Signal Indicator: Description
The "High Volume Signal" indicator is an advanced technical analysis tool for TradingView designed to identify short-term momentum signals. It combines volume analysis with trend direction (based on the EMA) and candlestick patterns to pinpoint potential entry opportunities for both long and short positions.
How It Works
The indicator looks for specific "setup" candles with exceptionally high volume.
Long Setup
A Long Setup signal is triggered when the indicator identifies a bearish (red) candle with high volume that is located above the 20-period EMA. The high volume on this bearish candle suggests a potential "selling climax," after which the price is likely to rise again. The indicator marks this setup candle with a red line above its high. A green upward arrow then appears if the price breaks above the high of this setup candle within 3 bars.
Short Setup
A Short Setup signal is triggered when the indicator identifies a bullish (green) candle with high volume that is located below the 20-period EMA. The high volume on this bullish candle suggests a potential "buying climax," after which the price is likely to fall again. The indicator marks this setup candle with a green line below its low. A red downward arrow then appears if the price breaks below the low of this setup candle within 3 bars.
Use Cases
This indicator is particularly suitable for short-term traders looking for potential reversal points within a trend. It can be used on various timeframes and serves as an additional confirmation tool to support trading decisions. It's recommended to use this indicator in combination with other analysis tools.
MBDOM _ Smart Volume Dominance!!!!! MBDOM_Smart Volume Dominance Indicator !!!!!!
"MBDOM_Smart Volume Dominance", which helps identify buying or selling pressure based on volume and price action.
Key Features:
1. Volume Filtering:
o Only considers candles where volume is above a minimum threshold (relative to a 20-period SMA).
o Helps filter out low-volume, less significant candles.
2. Volume Pressure Calculation:
o Measures buying pressure as the portion of volume attributed to upward movement (based on close position within the candle range).
o Selling pressure is the remaining volume.
3. Smoothed & Lookback Analysis:
o Applies a 3-period EMA to smooth pressure values.
o Compares total buying vs. selling pressure over a user-defined lookback period (default: 5 bars).
4. Signal Conditions:
o Buy Signal:
Total buying pressure exceeds selling pressure by a threshold (default: 1.5x).
Buying pressure is increasing, and the candle closes bullish (close > open).
o Sell Signal:
Total selling pressure exceeds buying pressure by the threshold.
Selling pressure is increasing, and the candle closes bearish (close < open).
o Recommended Settings:
- *Day Trading*: 3-5 lookback, 1.3-1.5 threshold
- *Swing Trading*: 5-10 lookback, 1.5-2.0 threshold
- Adjust min_volume based on market volatility

OBR 15min Session Opening Range Breakout + Volume Trend DeltaQuick Overview
This Pine Script plots the opening range for London and New York sessions, highlights breakout levels, draws previous session pivots, and offers a live volume delta table for trend confirmation.
Session Opening Range
- Captures the high/low of the first 15 minutes (configurable) for both London & NY sessions.
- Fills the range area with adjustable semi‑transparent colors.
- Optional alerts fire on breakout above the high or below the low.
Previous Session Levels
- Automatically draws previous day’s High, Low, Open and previous 4‑hour High/Low.
- Helps identify key S/R zones as price approaches ORB breakouts.
Volume Trend Delta
- Uses a CMO‑weighted moving average and ATR bands to detect trend state.
- Accumulates bullish vs. bearish volume during each trend.
- Displays Bull Vol, Bear Vol, and Delta % in a movable table for quick strength checks.
How to Use
1. Let the opening range complete (first 15 min).
2. Look for price closing above/below the ORB—enter long on an upside break, short on a downside break.
3. Check the Volume Delta table: positive delta confirms buying strength; negative delta confirms selling pressure.
4. Use previous day/4h levels as additional support/resistance filters.
Settings & Customization
- ORB Duration & Session Times (London/NY), fill colors, and toggles.
- Enable/disable Previous Day & 4H levels.
- Trend Period, Momentum Window, and Delta table position/size.
- Pre‑built alert conditions for all ORB breakouts.
Developer Notes
- Fully commented for easy adjustments.
- Modular sections: ORB, previous levels, trend delta, and alerts.
- No external libraries—pure Pine Script v6.
Tip
Combine ORB breakouts with Volume Delta and prior session pivots to filter false signals and trade stronger, more reliable moves.

Bull vs Bear Volume (Enhanced)Bull vs Bear Volume (Enhanced) is a custom volume histogram that separates and visualizes estimated buying vs. selling volume within each candle. This allows traders to better understand market sentiment and detect imbalances in demand and supply.
🔍 What It Does:
Plots bullish volume (green) above the x-axis and bearish volume (red) below.
Estimates bull/bear volume by analyzing the close location within the candle's range.
Highlights volume spikes with lime (bullish) or maroon (bearish) when volume exceeds a user-defined threshold.
Includes an optional total volume line for added context.
Supports smoothing via simple moving average (SMA) to reduce noise.
🛠️ Inputs:
Toggle smoothing and set its length.
Enable/disable threshold spike highlighting.
Show/hide the total volume overlay.
Adjust the threshold multiplier for spike detection.
⚠️ Important:
This script uses a proxy method based on candle structure to estimate volume split — it does not use real-time order flow or trade direction data.
Works best on liquid assets with consistent volume.

Advanced Cumulative Delta & VolumeAdvanced Cumulative Delta & Volume (Heuristic-Based)
This offers a powerful cumulative delta visualization based on price action heuristics—perfect for traders without access to real bid/ask volume data.
Features
Cumulative Delta Calculation
Built using estimated delta (based on close position and volume).
Includes a moving average-based surge detection system.
Surge Detection
Highlights candles where delta exceeds a multiple of its average.
Detects sustained surges across multiple bars for trend confirmation.
Visual Enhancements
Smoothed line and area chart for delta flow
Alternate background shading (light blue) for each timeframe interval—great for visual structure (e.g., every 30 minutes).
Color-coded:
Yellow for bullish surges
Black for bearish surges
Green for positive delta /red for negative delta
Customizable Inputs
Timeframe (for resampling logic)
Surge thresholds
Delta moving average length
Volume weight adjustment
Sustained bar count
Ideal For:
Order flow enthusiasts without premium data feeds
Scalpers & intraday traders
Anyone wanting a visual edge on volume-driven moves

Buy vs Sell Panel - Volume + % Highlighted + AlertsThis script provides a real-time visual breakdown of estimated Buy vs Sell volume per bar, with intelligent formatting and trend bias detection.
🔹 Features:
📈 Displays Buy and Sell volumes
🔢 Shows percentage (%) of volume in favor
✅ Highlights the dominant side (Buy or Sell)
🎛 Customizable panel position, font size, and update timeframe
🔔 Alerts when Buy or Sell volume exceeds 70% dominance
This panel is ideal for traders who want to:
Confirm trade entries based on volume strength
Visually monitor which side (buyers or sellers) is in control
Get alerted when volume shifts heavily in one direction
🧠 Volume estimation is calculated based on candle structure using directional bias. This helps approximate who is in control even without raw order book access.
🔧 Fully customizable:
Timeframe (1m to Monthly)
Font Size
Panel Location (Top/Bottom Left/Right)
Toggle % display and market bias text
📊 Works with all assets: Stocks, Futures, Forex, and Crypto.
