AVGO Advanced Day Trading Strategy📈 Overview
The AVGO Advanced Day Trading Strategy is a comprehensive, multi-timeframe trading system designed for active day traders seeking consistent performance with robust risk management. Originally optimized for AVGO (Broadcom), this strategy adapts well to other liquid stocks and can be customized for various trading styles.
🎯 Key Features
Multiple Entry Methods
EMA Crossover: Classic trend-following signals using fast (9) and medium (16) EMAs
MACD + RSI Confluence: Momentum-based entries combining MACD crossovers with RSI positioning
Price Momentum: Consecutive price action patterns with EMA and RSI confirmation
Hybrid System: Advanced multi-trigger approach combining all methodologies
Advanced Technical Arsenal
When enabled, the strategy analyzes 8+ additional indicators for confluence:
Volume Price Trend (VPT): Measures volume-weighted price momentum
On-Balance Volume (OBV): Tracks cumulative volume flow
Accumulation/Distribution Line: Identifies institutional money flow
Williams %R: Momentum oscillator for entry timing
Rate of Change Suite: Multi-timeframe momentum analysis (5, 14, 18 periods)
Commodity Channel Index (CCI): Cyclical turning points
Average Directional Index (ADX): Trend strength measurement
Parabolic SAR: Dynamic support/resistance levels
🛡️ Risk Management System
Position Sizing
Risk-based position sizing (default 1% per trade)
Maximum position limits (default 25% of equity)
Daily loss limits with automatic position closure
Multiple Profit Targets
Target 1: 1.5% gain (50% position exit)
Target 2: 2.5% gain (30% position exit)
Target 3: 3.6% gain (20% position exit)
Configurable exit percentages and target levels
Stop Loss Protection
ATR-based or percentage-based stop losses
Optional trailing stops
Dynamic stop adjustment based on market volatility
📊 Technical Specifications
Primary Indicators
EMAs: 9 (Fast), 16 (Medium), 50 (Long)
VWAP: Volume-weighted average price filter
RSI: 6-period momentum oscillator
MACD: 8/13/5 configuration for faster signals
Volume Confirmation
Volume filter requiring 1.6x average volume
19-period volume moving average baseline
Optional volume confirmation bypass
Market Structure Analysis
Bollinger Bands (20-period, 2.0 multiplier)
Squeeze detection for breakout opportunities
Fractal and pivot point analysis
⏰ Trading Hours & Filters
Time Management
Configurable trading hours (default: 9:30 AM - 3:30 PM EST)
Weekend and holiday filtering
Session-based trade management
Market Condition Filters
Trend alignment requirements
VWAP positioning filters
Volatility-based entry conditions
📱 Visual Features
Information Dashboard
Real-time display of:
Current entry method and signals
Bullish/bearish signal counts
RSI and MACD status
Trend direction and strength
Position status and P&L
Volume and time filter status
Chart Visualization
EMA plots with customizable colors
Entry signal markers
Target and stop level lines
Background color coding for trends
Optional Bollinger Bands and SAR display
🔔 Alert System
Entry Alerts
Customizable alerts for long and short entries
Method-specific alert messages
Signal confluence notifications
Advanced Alerts
Strong confluence threshold alerts
Custom alert messages with signal counts
Risk management alerts
⚙️ Customization Options
Strategy Parameters
Enable/disable long or short trades
Adjustable risk parameters
Multiple entry method selection
Advanced indicator on/off toggle
Visual Customization
Color schemes for all indicators
Dashboard position and size options
Show/hide various chart elements
Background color preferences
📋 Default Settings
Initial Capital: $100,000
Commission: 0.1%
Default Position Size: 10% of equity
Risk Per Trade: 1.0%
RSI Length: 6 periods
MACD: 8/13/5 configuration
Stop Loss: 1.1% or ATR-based
🎯 Best Use Cases
Day Trading: Designed for intraday opportunities
Swing Trading: Adaptable for longer-term positions
Momentum Trading: Excellent for trending markets
Risk-Conscious Trading: Built-in risk management protocols
⚠️ Important Notes
Paper Trading Recommended: Test thoroughly before live trading
Market Conditions: Performance varies with market volatility
Customization: Adjust parameters based on your risk tolerance
Educational Purpose: Use as a learning tool and customize for your needs
🏆 Performance Features
Detailed performance metrics
Trade-by-trade analysis capability
Customizable risk/reward ratios
Comprehensive backtesting support
This strategy is for educational purposes. Past performance does not guarantee future results. Always practice proper risk management and consider your financial situation before trading.
Recherche dans les scripts pour "alert"

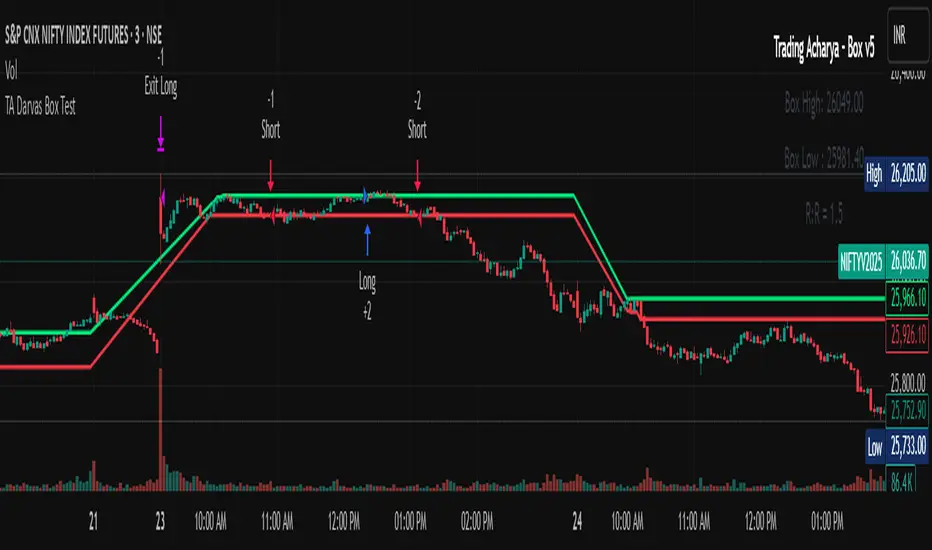
TA Darvas Box Test🎯 Core Logic
1-Darvas Box Breakouts/Breakdowns → Entry when price crosses above the Top Box (long) or below the Bottom Box (short).
2-Trend Filter (MavilimW) → Longs only when price is above MAVW, shorts only when below.
3-Momentum Confirmations → ATR spike and Volume spike must confirm breakout strength.
🛠 Position Sizing (MaTriangle – Martingale by Qty)
1-Starts with Base Qty.
2-On losing trades → step-up size using Qty Multiplier, capped by Max Steps & Max Qty Cap.
3-On winning trades → optional reset back to Base Qty.
⚠️ Martingale sizing can increase drawdowns — use carefully.
⏱ Trade Gating
1-Backtest Window: Only trades between selected From – To dates.
2-Trade Cap: Limit trades Per Day / Per Week / Per Month (auto reset).
3-One Position at a Time (pyramiding = 0).
📉 Exit Rules
1-Protective Stops:
2-Long → Stop at Bottom Box.
3-Short → Stop at Top Box.
Profit Safeguard: If in profit, exit when RVI crosses against trade.
1-No fixed TP → trades ride until Box stop or RVI exit.
🔔 Alerts (Options Workflow)
1-Static Alerts: Fire on confirmed long/short signals (compile-safe).
2-Dynamic Alerts: Send ATM strike info, Qty, and Martingale step.
3-Auto ATM Mapping: BANKNIFTY, NIFTY, FINNIFTY, MIDCPNIFTY detected automatically; fallback to manual step.
⚙️ Suggested Defaults
Darvas Box Length = 5
ATR Len = 14, ATR SMA = 14, Mult = 1.0–1.5
Volume SMA = 20, Mult = 1.5–2.0
Base Qty = 1, Mult = 2.0, Max Steps = 3
Trade Cap = Per Day, 10–30 trades
✅ Works on any symbol/timeframe.
⚠️ High-risk position sizing (Martingale). Backtest thoroughly and use with caution.
Tristan's Box: Pre-Market Range Breakout + RetestMarket Context:
This is designed for U.S. stocks, focusing on pre-market price action (4:00–9:30 AM ET) to identify key support/resistance levels before the regular session opens.
Built for 1 min and 5 min timelines, and is intended for day trading / scalping.
Core Idea:
Pre-market range (high/low) often acts as a magnet for price during regular hours.
The first breakout outside this range signals potential strong momentum in that direction.
Retest of the breakout level confirms whether the breakout is valid, avoiding false moves.
Step-by-Step Logic:
Pre-Market Range Identification:
Track high and low from 4:00–9:30 AM ET.
Draw a box spanning this range for visual reference and calculation.
Breakout Detection:
When the first candle closes above the pre-market high → long breakout.
When the first candle closes below the pre-market low → short breakout.
The first breakout candle is highlighted with a “YOLO” label for visual confirmation.
Retest Confirmation:
Identify the first candle whose wick touches the pre-market box (high touches top for short, low touches bottom for long).
Wait for the next candle: if it closes outside the box, it confirms the breakout.
Entry Execution:
Long entry: on the confirming candle after a wick-touch above the pre-market high.
Short entry: on the confirming candle after a wick-touch below the pre-market low.
Only the first valid entry per direction per day is taken.
Visuals & Alerts:
Box represents pre-market high/low.
Top/bottom box border lines show the pre-market high / low levels cleanly.
BUY/SELL markers are pinned to the confirming candle.
Added a "YOLO" marker on breakout candle.
Alert conditions trigger when a breakout is confirmed by the retest.
Strategy Type:
Momentum breakout strategy with confirmation retest.
Combines pre-market structure and risk-managed entries.
Designed to filter false breakouts by requiring confirmation on the candle after the wick-touch.
In short, it’s a pre-market breakout momentum strategy: it uses the pre-market high/low as reference, waits for a breakout, and then enters only after a confirmation retest, reducing the chance of entering on a false spike.
Always use good risk management.

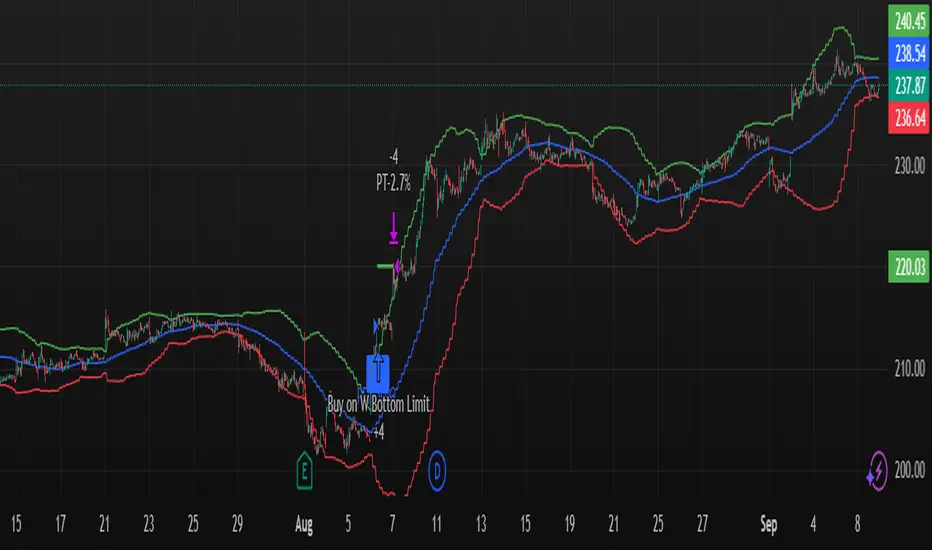
W Bottom Reversal Strategy W Bottom Reversal Strategy (15m-close entries; intrabar TP; daily MACD exit; JSON alerts v49.3-expire2)
Overview
A precision reversal strategy designed for 15-minute charts on liquid symbols. It detects a capitulation-and-stabilization “W” base using 1-hour (1H) context, confirms momentum improvement, then enters only on bar close to avoid early/“ghost” signals. Exits combine a fast intrabar take-profit (~2.7%) with a daily MACD risk-off exit that closes positions when higher-timeframe momentum turns against the setup.
How it works (high-level, matching code)
1H volatility + oversold gate (arming)
Compute 1H Bollinger-style bands (basis = SMA(close, bbLength=20), stdev multiplier bbMult=2.0).
Arm the setup when a 1H bar closes with price < 1H lower band and 1H RSI( rsiLength=14 ) < rsiThreshold (default 20.0).
1H momentum flip → pending entry
When a new 1H bar closes and 1H MACD line (EMA12−EMA26) crosses above 0 while armed and flat, set an entryPending flag.
This does not enter yet—it prepares a confirmed, bar-close entry on the lower timeframe.
Bar-close execution on the chart timeframe (15m)
On the next 15m bar close (or within N bars, see below) and still flat, fire the entry using a limit order at close × (1 − 0.00001) (≈ 0.001% below close) to reduce slippage and maintain chart/alert alignment.
Anti-late filter (no stale triggers)
If the pending entry doesn’t trigger within N chart bars (input: “Pending entry valid for N chart bars”, default 1, range 1–8), it expires and the arm state resets. This prevents late fills long after the 1H confirmation.
Exit logic
Primary: Standing intrabar take-profit at +2.7% from the average entry price (managed via strategy.exit limit).
Risk-off: On daily bar close, if Daily MACD line (EMA12−EMA26) crosses under 0, close the position (flat on daily momentum flip).
Default Properties (used for this publication)
Timeframe: 15m (with 1H and Daily higher-timeframe confirmations via request.security)
Initial capital: $10,000
Position sizing: Percent of equity = 10% per trade (enters only when flat; no stacking while in a position)
Commission: 0.05% per side
Slippage: Recommend 1 tick in Strategy Properties for realistic fills
Inputs exposed:
BB Length: 20 • BB Multiplier: 2.0
RSI Length: 14 • RSI Threshold: 20.0
MACD: Short 12, Long 26, Signal 9 (signal kept for compatibility; logic uses MACD line vs 0)
Pending entry valid for N chart bars: default 1 (1–8)
Execution behavior (per code):
calc_on_every_tick = false (evaluates on bar close)
process_orders_on_close = true (orders placed at bar close)
Limit entry at close −0.001%
Intrabar TP (2.7%)
Daily risk-off exit on MACD<0 at daily bar close
Alerts (exact behavior in code)
Uses alert() function calls with standardized JSON.
Set your alert to “Only alert() function calls” and “Once per bar close.”
Two events are emitted:
LONG_CONFIRMED on entry fire (15m bar close)
EXIT_CONFIRMED_DAILY_MACD on daily MACD<0 (daily bar close)
JSON fields include: event, version ("v49.3-expire2"), symbol, interval, price, and time.
How to use
Apply on liquid tickers (tight spreads, healthy volume).
Keep defaults initially; run across a broad, liquid watchlist to gather a proper sample.
For automation, route bar-close alerts to your executor; confirm broker lot/route settings and that limit orders at close −0.001% are acceptable.
Expect fewer signals in powerful trends; the daily risk-off helps cut failed bases.
Methodology & expectations (results transparency)
Evaluate on a dataset yielding 100+ trades before drawing conclusions.
Keep commission & slippage enabled (see defaults).
Risk sizing: With 10% of equity per trade and flat-to-flat entries, exposure aligns with typical 5–10% guidance.
No performance guarantees—outcomes depend on symbol selection, volatility regime, news, and execution quality.
Originality & value (vendor justification)
While it uses familiar building blocks (BB/RSI/MACD), the edge comes from the 1H volatility + oversold arming, 1H momentum flip, strict 15m bar-close limit execution, and the N-bar pending expiry that prevents stale triggers—paired with a dual-exit design (intrabar TP + daily risk-off). The focus is on reducing premature fills, keeping alerts 1:1 with chart marks, and capturing the first impulse out of a W-base.
Disclaimers
For educational purposes only; not financial advice. Paper-test first. Verify alerts, fills, and symbol liquidity with your broker before live use.
Changelog: v49.3-expire2 — Bar-close limit entries; anti-late pending window; standardized JSON alerts; intrabar 2.7% TP; daily MACD risk-off exit.
RSI + MACD Long-Only StrategyRSI + MACD Long-Only Strategy
Overview: Momentum-based, long-only strategy combining RSI and MACD. Entries favor upside momentum; exits trigger on momentum fades or risk targets. Signals are state-gated so you get one exit per entry (no multiple exits without a prior entry).
Entry conditions:
RSI crosses above the midline (default 50) while MACD is bullish (MACD > Signal, optionally MACD > 0), OR
MACD crosses above its Signal while RSI is at/above the midline.
Optional filters:
EMA trend filter: only enter if price > EMA(n).
Oversold context: only enter within N bars after RSI dipped below the oversold threshold.
Exit conditions:
RSI crosses below the midline, OR
MACD crosses below its Signal with MACD histogram ≤ 0.
Optional risk exit: Take Profit / Stop Loss based on percentage from average entry price.
Risk management:
Inputs: Use TP/SL (on/off), TP% (default 3.0), SL% (default 1.5).
Implements protective strategy.exit (limit/stop) while in position.
Signal-based exit uses strategy.close to flatten.
Position management:
Long-only, no pyramiding (single position at a time).
Internal state ensures entries occur only when flat and exits only when in a position.
Inputs you can tune:
RSI: length, overbought, oversold, midline.
MACD: fast length, slow length, signal length; toggle “Require MACD > 0”.
Signals: oversold lookback window; EMA trend on/off and EMA length.
Risk: TP% and SL%.
Visuals: show entry/exit markers, bar coloring; optional debug background on raw triggers.
Visuals and alerts:
Plots EMA (optional), draws entry/exit markers, optional bar coloring, and a faint background on raw long triggers to aid tuning.
Alert conditions provided for entries and exits.
Notes:
Designed for bar-close evaluation; performance varies by symbol/timeframe—tune inputs accordingly.
Long-only; intended for trend-following momentum with basic risk control.
Not financial advice.

Backtest [OptAlgo]This backtest script is designed to convert ideas or indicators into backtest results. The script creates buy/sell signals by comparing price sources against fixed values or other imported plots using many comparison methods. It has many features including multiple exit systems: TP/SL, custom plot-based stops and more. It supports full trading automation through webhook alerts with live signal processing.
🔢 Signal Creation System
→ Values Group : Compare price sources against fixed numerical values
→ Plots Group : Compare two different price sources/indicators against each other
→ Flexible Comparisons : 15+ comparison methods (equal, crossover, rising...)
→ Signal Types : Long, Short, Close All, Block signals, and combination signals
→ Merge Rules : Minimum condition requirements for signal activation
🔀 Advanced Signal Logic
→ Counter Signals : Choose between reversing positions or closing them
→ Signal Inversion : Flip all buy/sell signals with one toggle
→ External Signal Import : Import coded signals (1=Long, -1=Short, 0=Close)
→ Day Blocker : Enable/disable trading on specific weekdays
→ Session Control : Limit trading to specific market sessions
⚙️ Strategy Settings
→ Position Sides : All Ways, Long Only, or Short Only modes
→ Signal Control : Individual enable/disable for long and short signals
→ Counter Signal Mode : Reverse Open Position vs Close Open Position
→ Signal Reversal : Global signal inversion capability
🔰 Risk Management (Limiter Settings)
→ Leverage Control : Leverage with liquidation warnings
→ Drawdown Limit : Auto-halt strategy at specified drawdown percentage
→ Tradable Ratio : Use portion of available balance (0.01-1.0)
→ Contract Limit : Cap maximum contract size regardless of balance
🎯 TP/SL System
→ Fixed TP/SL : Set percentage-based take profit and stop loss
→ Custom Plot Stops : Use any indicator/plot as dynamic stop loss
→ ATR-Based Exits : Volatility-adjusted TP/SL using Average True Range
→ Realistic Protection : Prevents unrealistic TP/SL prices in live trading
→ Stop Modes : Instant (Sudden) vs Candle Close execution
→ ATR Stop Loss : Override fixed SL with volatility-based calculations
→ ATR Take Profit : Dynamic TP based on market volatility
→ Trailing Options : Safe, Normal, or Aggressive trailing methods
→ Calculation Modes : Normal, Volume-weighted, or Limited (with max %) options
→ Volume Integration : ATR levels adjust based on volume influx
🤖 Automation & Alerts
→ Webhook Integration : Send JSON alerts for automated execution
→ Live Signals : Real-time signal processing (every tick vs bar close)
→ Strategy Key : Unique identifier for automated systems
→ Early Entry : Send alerts X seconds before candle close
→ Fast Execution : Prevent signal lag in automated trading
🐞 Development Tools
→ Alert Plotting : Visualize signals directly on chart (disable for live alerts)
→ Professional Mode : Remove UI controls for faster calculation
→ Debug : Metrics are plotted in data window.
📊 Key Advantages
→ Multi-Condition Logic : Combine multiple indicators with flexible rules
→ Risk-First Design : Built-in drawdown and leverage protection
→ Automation Ready : Full webhook and alert system integration
⚠️ Important Warnings
→ High leverage combined with high SL may adjust to liquidation price
→ Use consistent leverage across all strategies on same trading isolated margin pair
→ Live signals require "Calculate on every tick" enabled in settings
→ Disable alert plotting when creating actual alerts to prevent latency

4H Bollinger Breakout StrategyThis strategy leverages Bollinger Bands on the 4-hour timeframe for long and short trades in trending or ranging markets. Entries trigger on BB breakouts with optional filters for volume, trend, and RSI. Exits occur on opposite BB crosses. Customizable for long-only, short-only, or indicator mode via code comments. Supports forex, stocks, or crypto with full equity allocation and 0.1% commission.
Length (Default: 20): Period for BB basis and std dev; shorter for sensitivity, longer for smoothing.
Basis MA Type (Default: SMA): Selects MA for middle band (SMA, EMA, etc.); EMA for faster response.
Source (Default: Close): Price input for calculations; use close for standard accuracy.
StdDev Multiplier (Default: 1.8): Band width control; higher for fewer signals, lower for more.
Offset (Default: 0): Shifts BB plots; typically unchanged.
Use Filters (Default: True): Applies volume, trend, RSI checks to filter signals.
Volume MA Length (Default: 20): For volume filter (long: >105% avg, short: >120%).
Trend MA Length (Default: 80): SMA for trend filter (long: above MA, short: below).
RSI Length (Default: 14): For short filter (entry if RSI <85).
Use Long/Short Signals (Defaults: True): Toggles directions; long entry on lower BB crossover, short on upper crossunder.
Visuals: BB plots (blue basis, red upper, green lower), orange trend MA, filled background.
Labels/Alerts: Green/red for long entry/exit, yellow/purple for short; alert conditions included.

Baseline TrendBaseline Trend Strategy Overview
Baseline Trend is a crypto-only trading strategy built on straightforward price-based logic: market direction is determined solely by the price’s position relative to a selected baseline open price. No technical indicators like RSI, MACD, or volume are used—this approach is purely focused on price action and position size manipulation.
This strategy is a genuine concept, developed from my own market analysis and logical theory, refined through extensive observation of crypto market behaviour.
While the strategy offers structure and adaptability, it’s important to recognise that no single trading system or indicator fits all market conditions. This tool is meant to support decision-making, not replace it—encouraging traders to stay flexible, informed, and in control of their risk.
Important Usage Note:
This system is intended for crypto markets only.
– When used as an indicator guide, it can be applied to both spot and futures markets.
– However, when used with web-hook automation, it is designed only for futures contracts.
Ensure compatibility with your trading setup before using automation features.
Core Logic: The Baseline
The strategy revolves around the concept of a “Baseline”, with three types available:
Main Baseline: Defines the primary trend direction. If the price is above, go long; if below, go short.
Second Baseline and Third Baseline: Used to measure buying/selling pressure and are key to certain take-profit logic options.
Baselines are customisable to different timeframes—Year, Month, Week, and more—based on available input settings. Structurally, the Main Baseline is the highest-level trend reference, followed by the Second, then Third.
Users can mix and match these baselines across timeframes to backtest crypto symbols and understand behaviour patterns, particularly when used with standard candlestick charts.
Entry & Exit Logic
Entry Signal: Triggered when price crosses over/under a defined distance (percentage) from the Main Baseline. This distance is the Trade Line, calculated based on the close price.
Exit Signal / Stop Loss: If price moves un-favorable and crosses over/under the Stop Loss Line (a defined distance from the Main Baseline), the open position will be force-closed according to user-defined settings.
LiqC (Liquidation Cut)
LiqC is a secondary stop-loss that activates when a leveraged position’s loss equals or exceeds the user-defined liquidation threshold. It forcefully closes the position to help prevent full liquidation before stop-loss, providing an extra layer of protection.
This LiqC is directly tied to the leverage level set by the user. Please ensure you understand how leverage affects liquidation risk, as different broker exchanges may use different liquidation ratio models. Using incorrect assumptions or mismatched leverage values may result in unexpected behaviour.
Position Sizing & Block Units
This strategy features a block-based position sizing system designed for flexibility and precision in trade management:
Block Range: Customisable from 1 to 10 blocks
Risk Allocation: Controlled through a user-defined ROE (Risk of Equity) value
For example, setting an ROE of 0.1% with 10 blocks allocates a total of 1% of account equity to the position. This structure supports both conservative and aggressive risk approaches, depending on user preference.
Block sizes are automatically calculated in alignment with exchange requirements, using Minimum Notional Value (MNV) and Minimum Trade Amount (MTA). These values are dynamically calculated based on the live market price, and scaled relative to the trader’s balance and selected risk percentage. This ensures accurate sizing with built-in adaptability for any account level and current market conditions.
Scalping Meets Trend Holding
This system blends short-term scalping with longer-term trend holding, offering a flexible and adaptive trading style.
Example:
Enter 10 blocks → take quick profits on 5 blocks → let the remaining 5 ride the trend.
This dual-layered approach allows traders to secure early gains while staying positioned for larger market moves. Think of it as:
5 Blocks to Protect: Capture quick wins and manage exposure.
5 Blocks to Pursue: Let profits run by following the broader trend.
By combining both protection and pursuit, the strategy supports risk control without sacrificing the potential for extended returns.
Flexible Take-Profit Logic
The strategy supports multiple, customisable take-profit mechanisms:
TP1–4 (Profit Percentage)
Triggers take profit of 1 block unit when unrealised gains reach defined percentage thresholds (TP1, TP2, TP3, TP4).
Buying/Selling Pressure-Based Take Profit
D1 – Pressure 1
Measures pressure between Second and Third Baselines.
If the distance between them exceeds a user-defined DPT (Decrease Post Threshold) and the price moves far enough from the Third Baseline, D1 activates to take profit or scale out one block.
D2 – Pressure 2
Measures pressure between the Main and Second Baselines.
Works similarly to D1, using a separate distance and pressure trigger.
Note: Both D1 and D2 deactivate in reversal or even trend conditions.
D3–5: High-High / Low-Low Logic
Based on bar index tracking after position entry:
For Long Positions: If after D3 bars the price doesn't exceed the previous bar's high, the system executes a take profit or scale-out.
For Short Positions: If the price doesn't drop below the previous low, the same logic applies.
This approach adds time-based and momentum-aware exit flexibility.
Leverage & Liquidation Risk
When backtesting with leverage enabled, the system checks whether historical candles exceed the liquidation range, calculated based on the average entry price and the leverage input. If the Liquidation Risk Count exceeds 1, profit and loss accuracy may be affected. Traders are encouraged to monitor this count closely to ensure realistic backtesting results.
Since the system cannot directly control or sync with your broker exchange’s actual leverage setting, it’s important to manually match the system’s leverage input with your broker’s configured leverage.
For example: If the system leverage input is set to 10, your exchange leverage setting must also be set to 10. Any mismatch will lead to inaccurate liquidation risk and PnL calculations.
Backtesting and Customisation
All TP1–4 and D1–5 functions are fully optional and customisable. Users are encouraged to backtest different crypto symbols to observe how price behaviour aligns with baseline structures and pressure metrics.
Each of the TP1–4 and D1–5 triggers is designed to execute only once per open position, ensuring controlled and predictable behaviour within each trade cycle.
Since backtesting is based on available historical bar data, please note that data availability varies depending on your TradingView subscription plan. For more reliable insights, it’s recommended to backtest across multiple time ranges, not just the full dataset, to assess the stability and consistency of the strategy’s performance over time.
Additionally, the time frame resolution interval in TradingView is customisable. For best results, use commonly supported time frames such as 30 minutes, 1 hour, 4 hours, 1 day, or 1 week. While the system is designed to support a broad range of intervals, non-standard resolutions may still cause calculation errors.
Currently, the system supports the following resolution ranges:
Intraday: from 1 minute to 720 minutes
(e.g., 60 minutes = 1 hour, 240 minutes = 4 hours, 720 minutes = 12 hours)
Daily: from 1 day to 6 days
Weekly: from 1 week to 3 weeks
Monthly: from 1 month to 4 months
Although the script is built to adapt to various resolutions, users should still monitor output behaviour closely, especially when testing less common or edge-case time frames.
System Usage Notice:
This system can be used as a standalone trading indicator or integrated with an exchange that supports web-hook signal execution. If you choose to automate trades via web-hook, please ensure you fully understand how to configure the setup properly. Web-hook integration methods vary between exchanges, and incorrect setup may lead to unintended trades. Users are responsible for ensuring proper configuration and monitoring of their automation.
Note on Lower Time Frame Usage
When using lower time frames (e.g., 1-minute charts) as the trading time frame, please be aware that available historical data may be limited depending on your subscription plan. This can affect the depth and reliability of backtesting, making it harder to establish a trustworthy probability model for a symbol’s behaviour over time.
Additionally, when pairing a high-level Main Baseline (MBL) time line (such as "1 Month") with low time frame resolutions (like 1-minute), you may encounter order execution limits or calculation overloads during backtesting. This is due to the large number of historical bars required, which can strain the system's capacity.
That said, if a user intentionally chooses to work with lower time frames, that decision is fully respected—but it should be done with awareness and at the user’s own risk.
Things to Be Aware Of (Web-hook Usage Only)
The following points apply if you're using web-hook automation to send signals from the system to an exchange:
Alert Signal Reliability
During extreme market volatility, some broker exchanges may fail to respond to web-hook signals due to traffic overload. While rare, this has occurred in the past and should be considered when relying on automation.
Alert Expiration (TradingView)
If you're on a Basic plan, TradingView alerts are only active for a limited time—typically around 1.5 months. Once expired, signals will no longer be sent out.
To keep your system active, reset the alert before expiration. For uninterrupted alerts, consider upgrading to a Premium plan, which supports permanent alert activation.
TradingView Alert Maintenance
TradingView may occasionally perform system maintenance, during which alerts may temporarily stop functioning. It’s recommended to monitor TradingView’s status if you’re relying on real-time automation.
Repainting
As of the current version, no repainting behaviour has been observed. Signal stability and consistency have been maintained across real-time and historical bars.
Order Execution Type and Fill Logic
All signals use Limit orders by default, except for MBL Exit and Fallback execution, which use Market orders.
Since Limit orders are not guaranteed to fill, the system includes logic to cancel unfilled orders and resend them. If necessary, a Fallback Market order is used to avoid conflict with new incoming trades.
This has only happened once, and is considered rare, but users should always monitor execution status to ensure accuracy and alignment with system behaviour.
Feedback
If you encounter any errors, bugs, or unexpected behaviour while using the system, please don’t hesitate to let me know. Your input is invaluable for helping improve the strategy in future updates.
Likewise, if you have any suggestions or ideas for enhancing the system—whether it’s a new feature, adjustment, or usability improvement—please feel free to share. Together, we can continue refining the tool to make it more robust and beneficial for everyone.
Disclaimer
All trading involves risk, particularly in the crypto market where conditions can be highly volatile. Past performance does not guarantee future outcomes, and market behaviour may evolve over time. This strategy is offered as a tool to support trading decisions and should not be considered financial or investment advice. Each user is responsible for their own actions and accepts full responsibility for any results that may arise from using this system.

Long/Short/Exit/Risk management Strategy # LongShortExit Strategy Documentation
## Overview
The LongShortExit strategy is a versatile trading system for TradingView that provides complete control over entry, exit, and risk management parameters. It features a sophisticated framework for managing long and short positions with customizable profit targets, stop-loss mechanisms, partial profit-taking, and trailing stops. The strategy can be enhanced with continuous position signals for visual feedback on the current trading state.
## Key Features
### General Settings
- **Trading Direction**: Choose to trade long positions only, short positions only, or both.
- **Max Trades Per Day**: Limit the number of trades per day to prevent overtrading.
- **Bars Between Trades**: Enforce a minimum number of bars between consecutive trades.
### Session Management
- **Session Control**: Restrict trading to specific times of the day.
- **Time Zone**: Specify the time zone for session calculations.
- **Expiration**: Optionally set a date when the strategy should stop executing.
### Contract Settings
- **Contract Type**: Select from common futures contracts (MNQ, MES, NQ, ES) or custom values.
- **Point Value**: Define the dollar value per point movement.
- **Tick Size**: Set the minimum price movement for accurate calculations.
### Visual Signals
- **Continuous Position Signals**: Implement 0 to 1 visual signals to track position states.
- **Signal Plotting**: Customize color and appearance of position signals.
- **Clear Visual Feedback**: Instantly see when entry conditions are triggered.
### Risk Management
#### Stop Loss and Take Profit
- **Risk Type**: Choose between percentage-based, ATR-based, or points-based risk management.
- **Percentage Mode**: Set SL/TP as a percentage of entry price.
- **ATR Mode**: Set SL/TP as a multiple of the Average True Range.
- **Points Mode**: Set SL/TP as a fixed number of points from entry.
#### Advanced Exit Features
- **Break-Even**: Automatically move stop-loss to break-even after reaching specified profit threshold.
- **Trailing Stop**: Implement a trailing stop-loss that follows price movement at a defined distance.
- **Partial Profit Taking**: Take partial profits at predetermined price levels:
- Set first partial exit point and percentage of position to close
- Set second partial exit point and percentage of position to close
- **Time-Based Exit**: Automatically exit a position after a specified number of bars.
#### Win/Loss Streak Management
- **Streak Cutoff**: Automatically pause trading after a series of consecutive wins or losses.
- **Daily Reset**: Option to reset streak counters at the start of each day.
### Entry Conditions
- **Source and Value**: Define the exact price source and value that triggers entries.
- **Equals Condition**: Entry signals occur when the source exactly matches the specified value.
### Performance Analytics
- **Real-Time Stats**: Track important performance metrics like win rate, P&L, and largest wins/losses.
- **Visual Feedback**: On-chart markers for entries, exits, and important events.
### External Integration
- **Webhook Support**: Compatible with TradingView's webhook alerts for automated trading.
- **Cross-Platform**: Connect to external trading systems and notification platforms.
- **Custom Order Execution**: Implement advanced order flows through external services.
## How to Use
### Setup Instructions
1. Add the script to your TradingView chart.
2. Configure the general settings based on your trading preferences.
3. Set session trading hours if you only want to trade specific times.
4. Select your contract specifications or customize for your instrument.
5. Configure risk parameters:
- Choose your preferred risk management approach
- Set appropriate stop-loss and take-profit levels
- Enable advanced features like break-even, trailing stops, or partial profit taking as needed
6. Define entry conditions:
- Select the price source (such as close, open, high, or an indicator)
- Set the specific value that should trigger entries
### Entry Condition Examples
- **Example 1**: To enter when price closes exactly at a whole number:
- Long Source: close
- Long Value: 4200 (for instance, to enter when price closes exactly at 4200)
- **Example 2**: To enter when an indicator reaches a specific value:
- Long Source: ta.rsi(close, 14)
- Long Value: 30 (triggers when RSI equals exactly 30)
### Best Practices
1. **Always backtest thoroughly** before using in live trading.
2. **Start with conservative risk settings**:
- Small position sizes
- Reasonable stop-loss distances
- Limited trades per day
3. **Monitor and adjust**:
- Use the performance table to track results
- Adjust parameters based on how the strategy performs
4. **Consider market volatility**:
- Use ATR-based stops during volatile periods
- Use fixed points during stable markets
## Continuous Position Signals Implementation
The LongShortExit strategy can be enhanced with continuous position signals to provide visual feedback about the current position state. These signals can help you track when the strategy is in a long or short position.
### Adding Continuous Position Signals
Add the following code to implement continuous position signals (0 to 1):
```pine
// Continuous position signals (0 to 1)
var float longSignal = 0.0
var float shortSignal = 0.0
// Update position signals based on your indicator's conditions
longSignal := longCondition ? 1.0 : 0.0
shortSignal := shortCondition ? 1.0 : 0.0
// Plot continuous signals
plot(longSignal, title="Long Signal", color=#00FF00, linewidth=2, transp=0, style=plot.style_line)
plot(shortSignal, title="Short Signal", color=#FF0000, linewidth=2, transp=0, style=plot.style_line)
```
### Benefits of Continuous Position Signals
- Provides clear visual feedback of current position state (long/short)
- Signal values stay consistent (0 or 1) until condition changes
- Can be used for additional calculations or alert conditions
- Makes it easier to track when entry conditions are triggered
### Using with Custom Indicators
You can adapt the continuous position signals to work with any custom indicator by replacing the condition with your indicator's logic:
```pine
// Example with moving average crossover
longSignal := fastMA > slowMA ? 1.0 : 0.0
shortSignal := fastMA < slowMA ? 1.0 : 0.0
```
## Webhook Integration
The LongShortExit strategy is fully compatible with TradingView's webhook alerts, allowing you to connect your strategy to external trading platforms, brokers, or custom applications for automated trading execution.
### Setting Up Webhooks
1. Create an alert on your chart with the LongShortExit strategy
2. Enable the "Webhook URL" option in the alert dialog
3. Enter your webhook endpoint URL (from your broker or custom trading system)
4. Customize the alert message with relevant information using TradingView variables
### Webhook Message Format Example
```json
{
"strategy": "LongShortExit",
"action": "{{strategy.order.action}}",
"price": "{{strategy.order.price}}",
"quantity": "{{strategy.position_size}}",
"time": "{{time}}",
"ticker": "{{ticker}}",
"position_size": "{{strategy.position_size}}",
"position_value": "{{strategy.position_value}}",
"order_id": "{{strategy.order.id}}",
"order_comment": "{{strategy.order.comment}}"
}
```
### TradingView Alert Condition Examples
For effective webhook automation, set up these alert conditions:
#### Entry Alert
```
{{strategy.position_size}} != {{strategy.position_size}}
```
#### Exit Alert
```
{{strategy.position_size}} < {{strategy.position_size}} or {{strategy.position_size}} > {{strategy.position_size}}
```
#### Partial Take Profit Alert
```
strategy.order.comment contains "Partial TP"
```
### Benefits of Webhook Integration
- **Automated Trading**: Execute trades automatically through supported brokers
- **Cross-Platform**: Connect to custom trading bots and applications
- **Real-Time Notifications**: Receive trade signals on external platforms
- **Data Collection**: Log trade data for further analysis
- **Custom Order Management**: Implement advanced order types not available in TradingView
### Compatible External Applications
- Trading bots and algorithmic trading software
- Custom order execution systems
- Discord, Telegram, or Slack notification systems
- Trade journaling applications
- Risk management platforms
### Implementation Recommendations
- Test webhook delivery using a free service like webhook.site before connecting to your actual trading system
- Include authentication tokens or API keys in your webhook URL or payload when required by your external service
- Consider implementing confirmation mechanisms to verify trade execution
- Log all webhook activities for troubleshooting and performance tracking
## Strategy Customization Tips
### For Scalping
- Set smaller profit targets (1-3 points)
- Use tighter stop-losses
- Enable break-even feature after small profit
- Set higher max trades per day
### For Day Trading
- Use moderate profit targets
- Implement partial profit taking
- Enable trailing stops
- Set reasonable session trading hours
### For Swing Trading
- Use longer-term charts
- Set wider stops (ATR-based often works well)
- Use higher profit targets
- Disable daily streak reset
## Common Troubleshooting
### Low Win Rate
- Consider widening stop-losses
- Verify that entry conditions aren't triggering too frequently
- Check if the equals condition is too restrictive; consider small tolerances
### Missing Obvious Trades
- The equals condition is extremely precise. Price must exactly match the specified value.
- Consider using floating-point precision for more reliable triggers
### Frequent Stop-Outs
- Try ATR-based stops instead of fixed points
- Increase the stop-loss distance
- Enable break-even feature to protect profits
## Important Notes
- The exact equals condition is strict and may result in fewer trade signals compared to other conditions.
- For instruments with decimal prices, exact equality might be rare. Consider the precision of your value.
- Break-even and trailing stop calculations are based on points, not percentage.
- Partial take-profit levels are defined in points distance from entry.
- The continuous position signals (0 to 1) provide valuable visual feedback but don't affect the strategy's trading logic directly.
- When implementing continuous signals, ensure they're aligned with the actual entry conditions used by the strategy.
---
*This strategy is for educational and informational purposes only. Always test thoroughly before using with real funds.*

MÈGAS ALGO : MÈGAS Engine [STRATEGY]Overview
The MÈGAS Engine is an advanced algorithmic trading system that integrates a range of technical analysis tools to pinpoint high-probability opportunities in the market.
Key Features
Core Signal Generation:
-Structure Break Detection: Advanced breakout identification with adjustable
sensitivity controls
-Dual-Direction Analysis: Separate bullish and bearish signal parameters with customizable delta
thresholds and depth settings
-Dynamic Parameter Management: OverfitShield technology with pulsewave parameter cycling
to reduce overfitting risks
Filtering Alghoritm:
-Volatility Filter: Rogers-Satchell volatility estimation with RSI-based normalization to avoid
trading in unfavorable market conditions
-Volume Confirmation: Cumulative volume analysis ensuring adequate liquidity support for trade
entries
OverfitShield Method:
OverfitShield is a built-in function within the trading strategy designed to reduce overfitting bias by introducing parameter variability during execution. When the "variable" mode is activated, instead of relying on fixed values for key strategy parameters the system dynamically selects values from customizable ranges.
This approach mimics real-world market uncertainty and ensures that the strategy does not become overly dependent on a single optimal value found during backtesting — making it more robust across different market conditions and time periods.
Position Management
-Customizable Exit Set-up
The exit logic can be customized to 'CONTINUE', 'TAKE PROFIT', or 'TRAILING PROFIT' to suit
your trading approach and maximize performance.
-CONTINUE Mode:
This mode does not use predefined take profit levels. Instead, it remains in the market as long as the trend persists. By avoiding fixed exit points, this approach is often the most effective in backtesting, as it allows positions to run in favorable trends for longer periods.
-TAKE PROFIT Mode:
This mode allows you to set multiple grid-like take profit levels at different price points, effectively creating a multi-tier exit strategy. You can specify the number of profit levels you want, along with the percentage step between each level. This structured approach can be beneficial for capturing incremental profits in a trending market while allowing for more flexibility in trade management.
-TRAILING PROFIT Mode:
Similar to the Take Profit mode, this option allows you to set the trailing stop levels. The trailing stop moves with the market, ensuring that you lock in profits as the price continues to move in your favor. Once a profit level is hit, the trailing stop "follows" the price movement, adjusting dynamically to safeguard profits as the trade progresses.
3. Customizable Insight Alerts
Traders can configure personalized alert messages for every strategy action, including entries, exits, and profit targets. These alerts are fully compatible with TradingView's webhook system.
Advantages
Customization: Fully customizable exit set-up and alerts allow traders to tailor the strategy to their personal trading objectives.
How It Works — Step by Step
Step 1: Apply the Strategy
Open the chart for your selected symbol and timeframe. Add the MÈGAS Engine to the chart.
Step 2:Backtesting and Optimization
Run a full backtest and optimize the strategy parameters across the chosen trading pairs to:
Identify robust settings that perform consistently well
Avoid overfitting through validation techniques
Select the most profitable and stable configuration for live or forward testing.
Step 3: Review Results and Alerts
Check the backtest results on the chart and confirm that the custom alert messages are displaying as expected. This helps verify that everything is functioning correctly before moving forward.
Step 4: Configure Portfolio Management
Set up the exit logic based on your specific requirements. Tailor the exit strategy to match your trading approach, whether you prefer predefined take profit levels, trailing stops, or a trend-following method. This flexibility ensures the exit logic aligns with your overall strategy for optimal performance.
Open the strategy settings window. In the dedicated portfolio management section, choose your preferred capital allocation method based on your trading style and risk preferences. Once set, save the configuration as the default.
Step 5: Set Up Alerts
Click "Add Alert" on the strategy
-In the message field, use: {{strategy.order.comment}}
Under the Notifications tab:
-Enable Webhook URL
-Enter your external webhook address
-Click 'Create' to activate alerts for your strategy
Please Note:
The results and visualizations presented are derived from optimized backtesting iterations using historical and paid real-time market data sourced via TradingView. While these results are intended to demonstrate potential performance, they do not guarantee future outcomes or accuracy. Past performance is not indicative of future results, and all trading involves risk.
We strongly recommend that users review and adjust the Properties within the script settings to align with their specific account configurations and preferred trading platforms. This ensures that the strategy outputs are reflective of real-world conditions and enhances the reliability of the results obtained. Use this tool responsibly and at your own risk.

LANZ Strategy 2.0 [Backtest]🔷 LANZ Strategy 2.0 — Structural Breakout Logic with Dynamic Swing Protection
LANZ Strategy 2.0 is a precision-focused backtesting system built for intraday traders who rely on structural confirmations before the London session to guide directional bias. This tool uses smart swing detection, risk-defined position sizing, and strict time-based execution to simulate real trading conditions with clarity and control.
🧠 Core Components:
Structural Confirmation (Trend & BoS): Detects trend direction and break of structure (BoS) using a three-swing logic, aligning trade entries with valid structural movement.
Time-Based Execution: Trades are triggered exclusively at 02:00 a.m. New York time, ensuring disciplined and repeatable intraday testing.
Swing-Based SL Models: Traders can select between three stop-loss protection types:
First Swing: Most recent structural level
Second Swing: Prior level
Full Coverage: All recent swing levels + configurable pip buffer
Dynamic TP Calculation: Take-Profit is projected as a risk-based multiple (RR), fully adjustable via input.
Capital-Based Risk Management: Risk is defined as a percentage of a fixed account size (e.g., $100 per trade from $10,000), and lot size is automatically calculated based on SL distance.
Fallback Entry Logic: If structural breakout is present but trend is not confirmed, a secondary entry is triggered.
End-of-Session Management: Any open trades are automatically closed at 11:45 a.m. NY time, with optional manual labeling or review.
📊 Visual Features (Optional in Indicator Version):
(Note: Visuals apply to the indicator version of LANZ 2.0, not this backtest script)
Swing level labels (1st, 2nd) and dynamic SL/TP lines.
Real-time session coloring for clarity: Pre-London, Entry Window, and NY Close.
Outcome labels: +RR, -RR, or net % at close.
Auto-cleanup of previous drawings for a clean chart per session.
⚙️ How It Works:
Detects last trend and BoS using swing logic before 02:00 a.m. NY.
At 02:00 a.m., evaluates directional bias and executes BUY or SELL if confirmed.
Applies selected SL logic (1st, 2nd, or full swing protection).
Sets TP based on the RR multiplier.
Closes the trade either on SL, TP, or at 11:45 a.m. NY manually.
🔔 Alerts:
Time-of-day alert at 02:00 a.m. NY to monitor execution.
Can be extended to cover SL/TP triggers or new BoS events.
📝 Notes:
Designed for backtesting precision and discretionary decision-making.
Ideal for Forex pairs, indices, or assets active during the London session.
Fully customizable: session timing, swing logic, SL buffer, and RR.
👤 Credits:
Strategy built by @rau_u_lanz using Pine Script v6, combining structural logic, capital-based risk control, and London-session timing in a backtest-ready framework for traders who demand accuracy and structure.

RSI Divergence Strategy - AliferCryptoStrategy Overview
The RSI Divergence Strategy is designed to identify potential reversals by detecting regular bullish and bearish divergences between price action and the Relative Strength Index (RSI). It automatically enters positions when a divergence is confirmed and manages risk with configurable stop-loss and take-profit levels.
Key Features
Automatic Divergence Detection: Scans for RSI pivot lows/highs vs. price pivots using user-defined lookback windows and bar ranges.
Dual SL/TP Methods:
- Swing-based: Stops placed a configurable percentage beyond the most recent swing high/low.
- ATR-based: Stops placed at a multiple of Average True Range, with a separate risk/reward multiplier.
Long and Short Entries: Buys on bullish divergences; sells short on bearish divergences.
Fully Customizable: Input groups for RSI, divergence, swing, ATR, and general SL/TP settings.
Visual Plotting: Marks divergences on chart and plots stop-loss (red) and take-profit (green) lines for active trades.
Alerts: Built-in alert conditions for both bullish and bearish RSI divergences.
Detailed Logic
RSI Calculation: Computes RSI of chosen source over a specified period.
Pivot Detection:
- Identifies RSI pivot lows/highs by scanning a lookback window to the left and right.
- Uses ta.barssince to ensure pivots are separated by a minimum/maximum number of bars.
Divergence Confirmation:
- Bullish: Price makes a lower low while RSI makes a higher low.
- Bearish: Price makes a higher high while RSI makes a lower high.
Entry:
- Opens a Long position when bullish divergence is true.
- Opens a Short position when bearish divergence is true.
Stop-Loss & Take-Profit:
- Swing Method: Computes the recent swing high/low then adjusts by a percentage margin.
- ATR Method: Uses the current ATR × multiplier applied to the entry price.
- Take-Profit: Calculated as entry price ± (risk × R/R ratio).
Exit Orders: Uses strategy.exit to place bracket orders (stop + limit) for both long and short positions.
Inputs and Configuration
RSI Settings: Length & price source for the RSI.
Divergence Settings: Pivot lookback parameters and valid bar ranges.
SL/TP Settings: Choice between Swing or ATR method.
Swing Settings: Swing lookback length, margin (%), and risk/reward ratio.
ATR Settings: ATR length, stop multiplier, and risk/reward ratio.
Usage Notes
Adjust the Pivot Lookback and Range values to suit the volatility and timeframe of your market.
Use higher ATR multipliers for wider stops in choppy conditions, or tighten swing margins in trending markets.
Backtest different R/R ratios to find the balance between win rate and reward.
Disclaimer
This script is for educational purposes only and does not constitute financial advice. Trading carries significant risk and you may lose more than your initial investment. Always conduct your own research and consider consulting a professional before making any trading decisions.

GQT GPT - Volume-based Support & Resistance Zones V2搞钱兔,搞钱是为了更好的生活。
Title: GQT GPT - Volume-based Support & Resistance Zones V2
Overview:
This strategy is implemented in PineScript v5 and is designed to identify key support and resistance zones based on volume-driven fractal analysis on a 1-hour timeframe. It computes fractal high points (for resistance) and fractal low points (for support) using volume moving averages and specific price action criteria. These zones are visually represented on the chart with customizable lines and zone fills.
Trading Logic:
• Entry: The strategy initiates a long position when the price crosses into the support zone (i.e., when the price drops into a predetermined support area).
• Exit: The long position is closed when the price enters the resistance zone (i.e., when the price rises into a predetermined resistance area).
• Time Frame: Trading signals are generated solely from the 1-hour chart. The strategy is only active within a specified start and end date.
• Note: Only long trades are executed; short selling is not part of the strategy.
Visualization and Parameters:
• Support/Resistance Zones: The zones are drawn based on calculated fractal values, with options to extend the lines to the right for easier tracking.
• Customization: Users can configure the appearance, such as line style (solid, dotted, dashed), line width, colors, and label positions.
• Volume Filtering: A volume moving average threshold is used to confirm the fractal signals, enhancing the reliability of the support and resistance levels.
• Alerts: The strategy includes alert conditions for when the price enters the support or resistance zones, allowing for timely notifications.
⸻
搞钱兔,搞钱是为了更好的生活。
标题: GQT GPT - 基于成交量的支撑与阻力区间 V2
概述:
本策略使用 PineScript v5 实现,旨在基于成交量驱动的分形分析,在1小时级别的图表上识别关键支撑与阻力区间。策略通过成交量移动平均线和特定的价格行为标准计算分形高点(阻力)和分形低点(支撑),并以自定义的线条和区间填充形式直观地显示在图表上。
交易逻辑:
• 进场条件: 当价格进入支撑区间(即价格跌入预设支撑区域)时,策略在没有持仓的情况下发出做多信号。
• 离场条件: 当价格进入阻力区间(即价格上升至预设阻力区域)时,持有多头头寸则会被平仓。
• 时间范围: 策略的信号仅基于1小时级别的图表,并且仅在指定的开始日期与结束日期之间生效。
• 备注: 本策略仅执行多头交易,不进行空头操作。
可视化与参数设置:
• 支撑/阻力区间: 根据计算得出的分形值绘制支撑与阻力线,可选择将线条延伸至右侧,便于后续观察。
• 自定义选项: 用户可以调整线条样式(实线、点线、虚线)、线宽、颜色及标签位置,以满足个性化需求。
• 成交量过滤: 策略使用成交量移动平均阈值来确认分形信号,提高支撑和阻力区间的有效性。
• 警报功能: 当价格进入支撑或阻力区间时,策略会触发警报条件,方便用户及时关注市场变化。
⸻

2xSPYTIPS Strategy by Fra public versionThis is a test strategy with S&P500, open source so everyone can suggest everything, I'm open to any advice.
Rules of the "2xSPYTIPS" Strategy :
This trading strategy is designed to operate on the S&P 500 index and the TIPS ETF. Here’s how it works:
1. Buy Conditions ("BUY"):
- The S&P 500 must be above its **200-day simple moving average (SMA 200)**.
- This condition is checked at the **end of each month**.
2. Position Management:
- If leverage is enabled (**2x leverage**), the purchase quantity is increased based on a configurable percentage.
3. Take Profit:
- A **Take Profit** is set at a fixed percentage above the entry price.
4. Visualization & Alerts:
- The **SMA 200** for both S&P 500 and TIPS is plotted on the chart.
- A **BUY signal** appears visually and an alert is triggered.
What This Strategy Does NOT Do
- It does not use a **Stop Loss** or **Trailing Stop**.
- It does not directly manage position exits except through Take Profit.

Arpeet MACDOverview
This strategy is based on the zero-lag version of the MACD (Moving Average Convergence Divergence) indicator, which captures short-term trends by quickly responding to price changes, enabling high-frequency trading. The strategy uses two moving averages with different periods (fast and slow lines) to construct the MACD indicator and introduces a zero-lag algorithm to eliminate the delay between the indicator and the price, improving the timeliness of signals. Additionally, the crossover of the signal line and the MACD line is used as buy and sell signals, and alerts are set up to help traders seize trading opportunities in a timely manner.
Strategy Principle
Calculate the EMA (Exponential Moving Average) or SMA (Simple Moving Average) of the fast line (default 12 periods) and slow line (default 26 periods).
Use the zero-lag algorithm to double-smooth the fast and slow lines, eliminating the delay between the indicator and the price.
The MACD line is formed by the difference between the zero-lag fast line and the zero-lag slow line.
The signal line is formed by the EMA (default 9 periods) or SMA of the MACD line.
The MACD histogram is formed by the difference between the MACD line and the signal line, with blue representing positive values and red representing negative values.
When the MACD line crosses the signal line from below and the crossover point is below the zero axis, a buy signal (blue dot) is generated.
When the MACD line crosses the signal line from above and the crossover point is above the zero axis, a sell signal (red dot) is generated.
The strategy automatically places orders based on the buy and sell signals and triggers corresponding alerts.
Advantage Analysis
The zero-lag algorithm effectively eliminates the delay between the indicator and the price, improving the timeliness and accuracy of signals.
The design of dual moving averages can better capture market trends and adapt to different market environments.
The MACD histogram intuitively reflects the comparison of bullish and bearish forces, assisting in trading decisions.
The automatic order placement and alert functions make it convenient for traders to seize trading opportunities in a timely manner, improving trading efficiency.
Risk Analysis
In volatile markets, frequent crossover signals may lead to overtrading and losses.
Improper parameter settings may cause signal distortion and affect strategy performance.
The strategy relies on historical data for calculations and has poor adaptability to sudden events and black swan events.
Optimization Direction
Introduce trend confirmation indicators, such as ADX, to filter out false signals in volatile markets.
Optimize parameters to find the best combination of fast and slow line periods and signal line periods, improving strategy stability.
Combine other technical indicators or fundamental factors to construct a multi-factor model, improving risk-adjusted returns of the strategy.
Introduce stop-loss and take-profit mechanisms to control single-trade risk.
Summary
The MACD Dual Crossover Zero Lag Trading Strategy achieves high-frequency trading by quickly responding to price changes and capturing short-term trends. The zero-lag algorithm and dual moving average design improve the timeliness and accuracy of signals. The strategy has certain advantages, such as intuitive signals and convenient operation, but also faces risks such as overtrading and parameter sensitivity. In the future, the strategy can be optimized by introducing trend confirmation indicators, parameter optimization, multi-factor models, etc., to improve the robustness and profitability of the strategy.

RSI Strategy With TP/SL - Lower TFThis Pine Script strategy integrates the Relative Strength Index (RSI) for trade signals with user-defined Take Profit (TP) and Stop Loss (SL) levels. It's designed for flexible application in different market conditions, offering long, short, or dual-direction trading.
Short Description
The strategy uses the RSI to identify overbought and oversold market conditions:
Buy signal: When RSI drops below the specified "Buy Level."
Sell signal: When RSI rises above the "Sell Level."
Additionally, it manages risk and profit targets with:
Take Profit (TP): Exits trades when the price reaches a percentage gain.
Stop Loss (SL): Exits trades to limit losses if the price falls by a certain percentage.
The strategy is versatile and includes options for visualizing performance, monthly profit/loss data, and detailed trade metrics.
How to Use
Set Parameters:
RSI Period: Default is 14. Adjust based on your analysis.
RSI Buy/Sell Levels:
Buy Level: Default is 40. Consider higher levels for conservative entries.
Sell Level: Default is 60. Lower this for earlier exits.
Take Profit (%): Set your profit target (default: 5%).
Stop Loss (%): Set your risk tolerance (default: 2%).
Trade Direction: Choose "Long Only," "Short Only," or "Both."
Interpret Signals:
Buy signals appear when RSI crosses below the buy threshold.
Sell signals appear when RSI crosses above the sell threshold.
Risk Management:
The strategy dynamically calculates TP and SL levels for each trade.
TP/SL is applied using the percentage input based on the entry price.
Monitor Performance:
Review trade statistics in the "Strategy Tester."
Use the monthly performance table to track P/L across months.
Customize Alerts:
Alerts for buy, sell, TP, and SL events can be used to automate notifications.
Key Features
Configurable RSI Settings: Adaptable to various market conditions.
Risk Management: Built-in TP and SL management.
Customizable Trade Direction: Tailored for long-only, short-only, or both directions.
Monthly P/L Table: Visualizes performance trends over time.
Alerts: Notifies when critical trade events occur.
Please do your own research before ase this to your real trading.

IsAlgo - Manual Channel► Overview:
Manual Channel is a strategy that allows traders to manually insert channel lines and set the lines’ width. Trades are opened when the price hits one of the lines and bounces back, with the expectation that it will move towards the opposite line. This strategy offers flexibility in configuring channel lines and trading behavior.
► Description:
The Manual Channel strategy is based on the use of manually defined channel lines to guide trading decisions. Traders start by marking four key points on the chart to create the channel. The first two points share the same time but different prices, and the last two points also share the same time but different prices. This method allows traders to place the channel lines precisely based on their analysis and insights. Additionally, the strategy allows for adjusting the width of the channel lines, which acts as a buffer zone around the main lines.
Once the channel is established, the strategy continuously monitors the price movements in relation to these lines. When the price touches one of the channel lines, the strategy opens a trade with the expectation that the price will bounce back and move towards the opposite line. For example, if the price hits the lower channel line, a long trade (buy) might be opened with the anticipation that the price will rise to the upper channel line. Conversely, if the price hits the upper channel line, a short trade (sell) might be opened expecting the price to fall to the lower channel line.
The strategy offers several options for managing trades. Traders can choose to close a trade when the price reaches the opposite channel line, capturing the expected movement within the channel. Additionally, if the price breaks outside the channel, traders have the option to close trades immediately or stop further trade executions to avoid potential losses.
↑ Channel Example:
↓ Channel Example:
► Features and Settings:
⚙︎ Channel: Define the time and prices of the four main points of the channel lines, and set the lines’ width.
⚙︎ Entry Candle: Specify the minimum and maximum body size and the body-to-candle size ratio for entry candles.
⚙︎ Trading Session: Define specific trading hours during which the strategy operates, restricting trades to preferred market periods.
⚙︎ Trading Days: Specify active trading days to avoid certain days of the week.
⚙︎ Backtesting: Perform backtesting for a selected period to evaluate strategy performance. This feature can be deactivated if not needed.
⚙︎ Trades: Configure trade direction (long, short, or both), position sizing (fixed or percentage-based), maximum number of open trades, and daily trade limits.
⚙︎ Trades Exit: Set profit/loss limits, specify trade duration, or exit based on channel breaks.
⚙︎ Stop Loss: Choose from various stop-loss methods, including fixed pips, ATR-based, or highest/lowest price points within a specified number of candles. Trades can also be closed after a certain number of adverse candle movements.
⚙︎ Break Even: Adjust stop loss to break even once predefined profit levels are reached, protecting gains.
⚙︎ Trailing Stop: Implement a trailing stop to adjust the stop loss as the trade becomes profitable, securing gains and potentially capturing further upside.
⚙︎ Take Profit: Set up to three take-profit levels using methods such as fixed pips, ATR, or risk-to-reward ratios. Alternatively, specify a set number of candles moving in the trade’s direction.
⚙︎ Alerts: Comprehensive alert system to notify users of significant actions, including trade openings and closings. Supports dynamic placeholders for take-profit levels and stop-loss prices.
⚙︎ Dashboard: Visual display on the chart providing detailed information about ongoing and past trades, aiding users in monitoring strategy performance and making informed decisions.
► Backtesting Details:
Timeframe: 15-minute EURUSD chart
Initial Balance: $10,000
Order Size: 10 units
Commission: 0.05%
Slippage: 5 ticks
This strategy opens trades around a manually drawn channel, which results in a smaller number of closed trades.

IsAlgo - Manual TrendLine► Overview:
Manual TrendLine is a strategy that allows traders to manually insert a trendline and opens trades when the trendline is retested or when the price hits a new highest high or lowest low. It provides flexibility in trendline configuration and trading behavior, enabling responsive and adaptable trading strategies.
► Description:
The Manual TrendLine strategy revolves around using manually defined trendlines as the primary tool for making trading decisions. Traders start by specifying two key points on the chart to establish the trendline. Each point is defined by a specific time and price, enabling precise placement according to the trader’s analysis and insights. Additionally, the strategy allows for the adjustment of the trendline’s width, which acts as a buffer zone around the trendline, providing flexibility in how closely price movements must align with the trendline to trigger trades.
Once the trendline is established, the strategy continuously monitors price movements relative to this line. One of its core functions is to execute trades when the price retests the trendline. A retest occurs when the price approaches the trendline after initially diverging from it, indicating potential continuation of the prevailing trend. This behavior is often seen as a confirmation of the trend’s strength, and the strategy takes advantage of these moments to enter trades in the direction of the trend.
Beyond retests, the strategy also tracks the formation of new highest highs and lowest lows in relation to the trendline. When the price reaches a new highest high or lowest low, it signifies strong momentum in the trend’s direction. The strategy can be configured to open trades at these critical points.
Another key feature of the strategy is its response to trendline breaks. A break occurs when the price moves through the trendline, potentially signaling a reversal or a significant shift in market sentiment. The strategy can be set to open reverse trades upon such breaks, enabling traders to quickly adapt to changing market conditions. Additionally, traders have the option to stop opening new trades after a trendline break, helping to avoid trades during periods of uncertainty or increased volatility.
↑ Up Trend Example:
↓ Down Trend Example:
► Features and Settings:
⚙︎ TrendLine: Define the time and price of the two main points of the trendline, and set the trendline width.
⚙︎ Entry Candle: Specify the minimum and maximum body size and the body-to-candle size ratio for entry candles.
⚙︎ Trading Session: Define specific trading hours during which the strategy operates, restricting trades to preferred market periods.
⚙︎ Trading Days: Specify active trading days to avoid certain days of the week.
⚙︎ Backtesting: backtesting for a selected period to evaluate strategy performance. This feature can be deactivated if not needed.
⚙︎ Trades: Configure trade direction (long, short, or both), position sizing (fixed or percentage-based), maximum number of open trades, and daily trade limits.
⚙︎ Trades Exit: Set profit/loss limits, specify trade duration, or exit based on band reversal signals.
⚙︎ Stop Loss: Choose from various stop-loss methods, including fixed pips, ATR-based, or highest/lowest price points within a specified number of candles. Trades can also be closed after a certain number of adverse candle movements.
⚙︎ Break Even: Adjust stop loss to break even once predefined profit levels are reached, protecting gains.
⚙︎ Trailing Stop: Implement a trailing stop to adjust the stop loss as the trade becomes profitable, securing gains and potentially capturing further upside.
⚙︎ Take Profit: Set up to three take-profit levels using methods such as fixed pips, ATR, or risk-to-reward ratios. Alternatively, specify a set number of candles moving in the trade’s direction.
⚙︎ Alerts: Comprehensive alert system to notify users of significant actions, including trade openings and closings. Supports dynamic placeholders for take-profit levels and stop-loss prices.
⚙︎ Dashboard: Visual display on the chart providing detailed information about ongoing and past trades, aiding users in monitoring strategy performance and making informed decisions.
► Backtesting Details:
Timeframe: 30-minute EURUSD chart
Initial Balance: $10,000
Order Size: 500 units
Commission: 0.05%
Slippage: 5 ticks
This strategy opens trades around a manually drawn trendline, which results in a smaller number of closed trades.

IsAlgo - CandleWave Channel Strategy► Overview:
The CandleWave Channel Strategy uses an exponential moving average (EMA) combined with a custom true range function to dynamically calculate a multi-level price channel, helping traders identify potential trend reversals and price pullbacks.
► Description:
The CandleWave Channel Strategy is built around an EMA designed to identify potential reversal points in the market. The channel’s main points are calculated using this EMA, which serves as the foundation for the strategy’s dynamic price channel. The channel edges are determined using a proprietary true range function that measures the distance between the highs and lows of price movements over a specific period. By factoring in the maximum distance between highs and lows and averaging these values over the period, the strategy creates a responsive channel that adapts to current market conditions. The channel consists of five levels, each representing different degrees of trend tension.
The strategy continuously monitors the price in relation to the channel edges. When a candle closes outside one of these edges, it indicates a potential price reversal. This outside-close candle acts as a signal for a possible trend change, prompting the strategy to prepare for a trade entry. Upon detecting an outside-close candle, the strategy triggers an entry. The logic behind this is that when the price moves outside the defined channel, it is likely to revert back within the channel and move towards the opposite edge. The strategy aims to capitalize on this reversion by entering trades based on these signals.
Traders can adjust the channel’s length, levels, and minimum distance to tailor it to different market conditions. They can also define the characteristics of the entry candle, such as its size, body, and relative position to previous candles, to ensure it meets specific conditions before triggering a trade. Additionally, the strategy permits the specification of trading hours and days, enabling traders to focus on preferred market periods. Exit can be configured based on profit/loss limits, trade duration, and band reversal signals or other criteria.
How it Works:
Channel Calculation: The strategy continuously updates the channel edges using the EMA and true range function.
Signal Detection: It waits for a candle to close outside the channel edges.
Trade Entry: When an outside-close candle is detected, the strategy enters a trade expecting the price to revert to the opposite channel edge.
Customization: Users can define the characteristics of the entry candle, such as its size relative to previous candles, to ensure it meets specific conditions before triggering a trade.
↑ Long Trade Example:
The entry candle closes below the channel level, indicating a potential upward reversal. The strategy enters a long position expecting the price to move towards the upper levels.
↓ Short Trade Example:
The entry candle closes above the channel level, signaling a potential downward reversal. The strategy enters a short position anticipating the price to revert towards the lower levels.
► Features and Settings:
⚙︎ Channel: Adjust the channel’s length, levels, and minimum distance to suit different market conditions and trading styles.
⚙︎ Entry Candle: Customize entry criteria, including candle size, body, and relative position to previous candles for accurate signal generation.
⚙︎ Trading Session: Define specific trading hours during which the strategy operates, restricting trades to preferred market periods.
⚙︎ Trading Days: Specify active trading days to avoid certain days of the week.
⚙︎ Backtesting: backtesting for a selected period to evaluate strategy performance. This feature can be deactivated if not needed.
⚙︎ Trades: Configure trade direction (long, short, or both), position sizing (fixed or percentage-based), maximum number of open trades, and daily trade limits.
⚙︎ Trades Exit: Set profit/loss limits, specify trade duration, or exit based on band reversal signals.
⚙︎ Stop Loss: Choose from various stop-loss methods, including fixed pips, ATR-based, or highest/lowest price points within a specified number of candles. Trades can also be closed after a certain number of adverse candle movements.
⚙︎ Break Even: Adjust stop loss to break even once predefined profit levels are reached, protecting gains.
⚙︎ Trailing Stop: Implement a trailing stop to adjust the stop loss as the trade becomes profitable, securing gains and potentially capturing further upside.
⚙︎ Take Profit: Set up to three take-profit levels using methods such as fixed pips, ATR, or risk-to-reward ratios. Alternatively, specify a set number of candles moving in the trade’s direction.
⚙︎ Alerts: Comprehensive alert system to notify users of significant actions, including trade openings and closings. Supports dynamic placeholders for take-profit levels and stop-loss prices.
⚙︎ Dashboard: Visual display on the chart providing detailed information about ongoing and past trades, aiding users in monitoring strategy performance and making informed decisions.
► Backtesting Details:
Timeframe: 30-minute GBPJPY chart
Initial Balance: $10,000
Order Size: 500 units
Commission: 0.02%
Slippage: 5 ticks

IsAlgo - Reverse Candle Strategy► Overview:
The Reverse Candle Strategy leverages a customizable moving average to identify the start of a trend. It utilizes the highest and lowest prices to define the trend and its corrections, executing trades based on custom candlestick patterns to capitalize on the main trend's continuation.
► Description:
The Reverse Candle Strategy is designed to effectively identify and trade market trends by combining moving averages and custom candlestick patterns. The core of the strategy is a single, customizable moving average, which helps determine the trend direction. When the market price crosses above the moving average, this signifies the beginning of an uptrend. The strategy then tracks the highest price reached during the uptrend and waits for a correction. A specific custom candlestick pattern signals the end of the correction, at which point the strategy executes a long trade.
In the case of a downtrend, the market price crossing below the moving average marks the trend’s start. The strategy monitors the lowest price during the downtrend and awaits a correction. The end of this correction is identified by another custom candlestick pattern, prompting the strategy to execute a short trade. This combination of a moving average with precise candlestick patterns ensures that trades are made at optimal moments, improving the likelihood of successful trades.
The integration of the moving average and candlestick patterns is critical. The moving average smooths out price data to highlight the trend direction, while the custom candlestick patterns provide specific entry signals after a correction, ensuring the trend’s resumption is genuine. This synergy enhances the strategy’s ability to filter out false signals and improve trade accuracy.
↑ Long Entry Example:
When the price is moving above the moving average and the highest price has been detected, the strategy will wait for the entry candle to execute the long trade.
↓ Short Entry Example:
When the price is moving below the moving average and the lowest price has been detected, the strategy will wait for the entry candle to execute the short trade.
✕ Exit Conditions:
To manage risk effectively, the strategy provides multiple stop-loss options. Traders can set stop-loss levels using fixed pips, ATR-based calculations, or the higher/lower price of past candles. Additionally, trades can be closed if a candle moves against the trade direction. Up to three take-profit levels can be set using fixed pips, ATR, or risk-to-reward ratios, allowing traders to secure profits at different stages. The trailing stop feature adjusts the stop loss as the trade moves into profit, locking in gains while allowing for continued potential upside. Furthermore, a break-even feature moves the stop loss to the entry price once a certain profit level is reached, protecting against losses. Trades can also be closed when the price crosses the moving average.
► Features & Settings:
⚙︎ Moving Average: Users can choose between various types of moving averages (e.g., SMA, EMA) to confirm the trend direction.
⚙︎ Trend & Corrections: Set minimum and maximum pips for trends and corrections, with an option to define correction percentages relative to the trend.
⚙︎ Entry Candle: Define the entry candle by specifying the minimum and maximum size of the candle's body and the ratio of the body to the entire candle size, ensuring significant breakouts trigger trades.
⚙︎ Trading Session: This feature allows users to define specific trading hours during which the strategy should operate, ensuring trades are executed only during preferred market periods.
⚙︎ Trading Days: Users can specify which days the strategy should be active, offering the flexibility to avoid trading on specific days of the week.
⚙︎ Backtesting: Enables a backtesting period during which the strategy can be tested over a selected start and end date. This feature can be deactivated if not needed.
⚙︎ Trades: Configure trade direction (long, short, or both), position sizing (fixed or percentage-based), maximum number of open trades, and daily trade limits.
⚙︎ Trades Exit: Various exit methods, such as setting profit or loss limits, trade duration, or closing trades on moving average crossings.
⚙︎ Stop Loss: Various stop-loss methods are available, including a fixed number of pips, ATR-based, or using the highest or lowest price points within a specified number of previous candles. Additionally, trades can be closed after a specific number of candles move in the opposite direction of the trade.
⚙︎ Break Even: This feature adjusts the stop loss to a break-even point once certain conditions are met, such as reaching predefined profit levels, to protect gains.
⚙︎ Trailing Stop: The trailing stop feature adjusts the stop loss as the trade moves into profit, securing gains while potentially capturing further upside.
⚙︎ Take Profit: up to three take-profit levels using fixed pips, ATR, or risk-to-reward ratios based on the stop loss. Alternatively, specify a set number of candles moving in the trade direction.
⚙︎ Alerts: The strategy includes a comprehensive alert system that informs the user of all significant actions, such as trade openings and closings. It supports placeholders for dynamic values like take-profit levels and stop-loss prices.
⚙︎ Dashboard: Visual display providing detailed information about ongoing and past trades on the chart, helping users monitor performance and make informed decisions.
► Backtesting Details:
Timeframe: 30-minute NAS100 chart
Initial Balance: $10,000
Order Size: 5 Units
Commission: $0.5 per contract
Slippage: 5 ticks
Stop Loss: MA Crossing or by break even

IsAlgo - Ultra Trend Strategy► Overview:
The Ultra Trend strategy is designed to identify trend lines based on average price movement and execute trades when the price crosses the middle line, confirmed by an entry candle. This strategy combines ATR, Moving Averages, and customizable candlestick patterns to provide a versatile and robust trading approach.
► Description:
The Ultra Trend strategy employs a multi-faceted approach to accurately gauge market trends and execute trades. It combines the Average True Range (ATR) with trendline analysis and Moving Averages, providing a comprehensive view of market conditions. The strategy uses ATR to measure market volatility and the average price movement, helping to set dynamic thresholds for trend detection and adapting to changing market conditions. The slope of the trend is calculated based on the angle of price movement, which aids in identifying the strength and direction of the trend.
Additionally, a Moving Average is used to filter trades, ensuring alignment with the broader market direction and reducing false signals, thereby enhancing trade accuracy.
Traders can configure the strategy to enter trades in the direction of the trend, against the trend, or both. This feature enhances the adaptability of the Ultra Trend strategy, making it suitable for various trading styles and market environments.
↑ Long Entry:
A long trade is executed when the entry candle crosses and closes above the trend line. This indicates a bullish market condition, signaling an opportunity to enter a buy position.
↓ Short Entry:
A short trade is executed when the entry candle crosses and closes below the trend line. This indicates a bearish market condition, signaling an opportunity to enter a sell position.
✕ Exit Conditions:
The strategy offers multiple stop-loss options to manage risk effectively. Traders can set stop-loss levels using fixed pips, ATR-based calculations, the higher/lower price of past candles, or close a trade if a candle moves against the trade direction.
Up to three take profit levels can be set using methods such as fixed pips, ATR, and risk-to-reward ratios. This allows traders to secure profits at various stages of the trade.
A trailing stop feature adjusts the stop loss as the trade moves into profit, locking in gains while allowing the trade to continue capturing potential upside. Additionally, a break-even feature moves the stop loss to the entry price once a certain profit level is reached, protecting against losses.
Trades can also be closed when a trend change is detected or when a candle closes outside a predefined channel, ensuring that positions are exited promptly in response to changing market conditions.
► Features and Settings:
⚙︎ Trend: Users can configure the trend direction, length, factor, and slope, allowing for precise control over how trends are identified and followed.
⚙︎ Moving Average: An Exponential Moving Average (EMA) can be employed to confirm the trend direction indicated by the trend lines. This provides further assurance that the trend line breakout is not a false signal. The EMA can be enabled or disabled based on user preference.
⚙︎ Entry Candle: The entry candle is the candle that breaks the trend line, signaling an entry opportunity. Users can specify the minimum and maximum size of the candle's body and the ratio of the body to the entire candle size. This ensures that only significant breakouts trigger trades.
⚙︎ Trading Session: This feature allows users to define specific trading hours during which the strategy should operate, ensuring trades are executed only during preferred market periods.
⚙︎ Trading Days: Users can specify which days the strategy should be active, offering the flexibility to avoid trading on specific days of the week.
⚙︎ Backtesting: Enables a backtesting period during which the strategy can be tested over a selected start and end date. This feature can be deactivated if not needed.
⚙︎ Trades: This includes configuring the direction of trades (long, short, or both), position sizing (fixed or percentage-based), the maximum number of open trades, and limitations on the number of trades per day or based on trend.
⚙︎ Trades Exit: The strategy offers various exit methods, such as setting profit or loss limits, specifying the duration a trade should remain open, or closing trades based on trend reversal.
⚙︎ Stop Loss: Various stop-loss methods are available, including a fixed number of pips, ATR-based, or using the highest or lowest price points within a specified number of previous candles. Additionally, trades can be closed after a specific number of candles move in the opposite direction of the trade.
⚙︎ Break Even: This feature adjusts the stop loss to a break-even point once certain conditions are met, such as reaching predefined profit levels, to protect gains.
⚙︎ Trailing Stop: The trailing stop feature adjusts the stop loss as the trade moves into profit, securing gains while potentially capturing further upside.
⚙︎ Take Profit: Up to three take-profit levels can be set using various methods, such as a fixed amount of pips, ATR, or risk-to-reward ratios based on the stop loss. Alternatively, users can specify a set number of candles moving in the direction of the trade.
⚙︎ Alerts: The strategy includes a comprehensive alert system that informs the user of all significant actions, such as trade openings and closings. It supports placeholders for dynamic values like take-profit levels and stop-loss prices.
⚙︎ Dashboard: A visual display provides detailed information about ongoing and past trades on the chart, helping users monitor the strategy's performance and make informed decisions.
► Backtesting Details:
Timeframe: 5-minute US30 chart
Initial Balance: $10,000
Order Size: 4% of equity per trade
Commission: $0.05 per contract
Slippage: 5 ticks
Stop Loss: ATR-based

IsAlgo - Reverse Band Strategy► Overview:
The Reverse Band Strategy leverages a custom band indicator combined with a candlestick pattern for trade entries. The strategy initiates trades when a candle closes outside the bands, anticipating that the price will revert inside the bands and reach the opposite side.
► Description:
The Reverse Band Strategy is built around a sophisticated custom band indicator designed to identify potential reversal points in the market. The bands are calculated using a proprietary formula that factors in the trend's slope, the highest and lowest points within the trend, the average price movement, and the number of candles that form the trend. This advanced calculation allows for a dynamic and responsive band that adjusts to market conditions.
Once the band edges are identified, the strategy continuously monitors for candles that close outside these bands. When such a candle is detected, it signals a potential reversal, triggering an entry. The expectation is that the price will revert back inside the bands and move towards the opposite band edge.
How it Works:
Band Calculation: The strategy continuously updates the band edges using the aforementioned factors.aforementioned factors.
Signal Detection: It waits for a candle to close outside the bands.
Trade Entry: When an outside-close candle is detected, the strategy enters a trade expecting the price to revert to the opposite band edge.
Customization: Users can define the characteristics of the entry candle, such as its size relative to previous candles, to ensure it meets specific conditions before triggering a trade.
↑ Long Trade Example:
The entry candle closes below the lower band, indicating a potential upward reversal. The strategy enters a long position expecting the price to move towards the upper band.
↓ Short Trade Example:
The entry candle closes above the upper band, signaling a potential downward reversal. The strategy enters a short position anticipating the price to revert towards the lower band.
► Features and Settings:
⚙︎ Band Customization: Adjust band length, smoothness, and minimum distance to fit different market conditions and trading styles.
⚙︎ Entry Candle: Customize criteria such as candle size, body, and relative position to previous candles to ensure precise entry signals.
⚙︎ Trading Session: This feature allows users to define specific trading hours during which the strategy should operate, ensuring trades are executed only during preferred market periods.
⚙︎ Trading Days: Users can specify which days the strategy should be active, offering the flexibility to avoid trading on specific days of the week.
⚙︎ Backtesting: Enables a backtesting period during which the strategy can be tested over a selected start and end date. This feature can be deactivated if not needed.
⚙︎ Trades: Configure trade direction (long, short, or both), position sizing (fixed or percentage-based), maximum number of open trades, and trade limitations per day or based on band.
⚙︎ Trades Exit: Set profit/loss limits, specify trade duration, or exit based on band reversal signals.
⚙︎ Stop Loss: Various stop-loss methods are available, including a fixed number of pips, ATR-based, or using the highest or lowest price points within a specified number of previous candles. Additionally, trades can be closed after a specific number of candles move in the opposite direction of the trade.
⚙︎ Break Even: This feature adjusts the stop loss to a break-even point once certain conditions are met, such as reaching predefined profit levels, to protect gains.
⚙︎ Trailing Stop: The trailing stop feature adjusts the stop loss as the trade moves into profit, securing gains while potentially capturing further upside.
⚙︎ Take Profit: Up to three take-profit levels can be set using various methods, such as a fixed amount of pips, ATR, or risk-to-reward ratios based on the stop loss. Alternatively, users can specify a set number of candles moving in the direction of the trade.
⚙︎ Alerts: The strategy includes a comprehensive alert system that informs the user of all significant actions, such as trade openings and closings. It supports placeholders for dynamic values like take-profit levels and stop-loss prices.
⚙︎ Dashboard: A visual display provides detailed information about ongoing and past trades on the chart, helping users monitor the strategy's performance and make informed decisions.
► Backtesting Details:
Timeframe: 30-minute GBPUSD chart
Initial Balance: $10,000
Order Size: 5000 units
Commission: 0.02%
Slippage: 5 ticks

market slayerInput Parameters:
Various input parameters allow customization of the strategy, including options to show trend confirmation, specify trend timeframes and values, set SMA lengths, enable take profit and stop loss, and define their respective values.
Calculations:
Simple Moving Averages (SMAs) are calculated based on the specified lengths.
Buy and sell signals are generated based on the crossover and crossunder of the short and long SMAs.
Confirmation Bars:
Functions are defined to determine bullish or bearish confirmation bars based on certain conditions.
These confirmation bars are used to confirm trend direction and generate additional signals.
Plotting:
SMAs are plotted on the chart.
Trend labels and signal markers are plotted based on the calculated conditions.
Trade Signals:
Buy and sell conditions are defined based on the crossover/crossunder of SMAs and confirmation of trend direction.
Strategy entries and exits are executed accordingly.
Take Profit and Stop Loss:
Optional take profit and stop loss functionality is included.
Trades are automatically closed when profit or loss thresholds are reached.
Closing Trades:
Trades are also closed based on changes in trend confirmation bars to ensure alignment with the overall market direction.
Alerts:
Alert conditions are defined for opening and closing trades, providing notifications when certain conditions are met.
Overall, this script aims to provide a systematic approach to trading by combining moving average crossovers with trend confirmation bars, along with options for risk management through take profit and stop loss orders. Users can customize various parameters to adapt the strategy to different market conditions and trading preferences.
The script uses the request.security() function with the lookahead parameter set to barmerge.lookahead_on to access data from a higher timeframe within the Pine Script on TradingView. Let's break down why it's used:
Higher Timeframe Analysis:
By default, Pine Script operates on the timeframe of the chart it's applied to. However, in trading strategies, it's common to incorporate signals or data from higher timeframes to confirm or validate signals generated on lower timeframes. This helps traders to align their trades with the broader market trend.
Trend Confirmation:
In this script, the confirmationTrendTimeframe parameter allows users to specify a higher timeframe for trend confirmation. The request.security() function fetches the data from this higher timeframe and applies the defined conditions to confirm the trend direction.
Lookahead Behavior:
The lookahead parameter set to barmerge.lookahead_on ensures that the script considers the most up-to-date information available on the higher timeframe when making trading decisions on the lower timeframe. This prevents the script from lagging behind or using outdated data, enhancing the accuracy of trend confirmation.
Usage in confirmationTrendBullish and confirmationTrendBearish:
These variables are assigned the values returned by the request.security() function, which represents the bullish or bearish trend confirmation based on the conditions applied to the data from the higher timeframe.