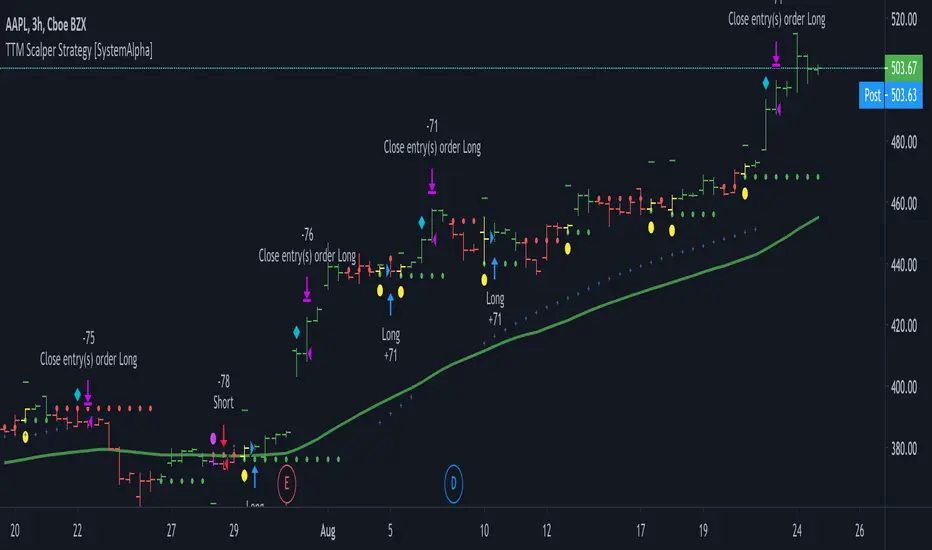
TTM Scalper Strategy [SystemAlpha]This is a strategy based on TTM scalper indicator. Instead of using just the normal buy and sell signal, we added an option to use trend filters, trailing stop loss and take profit targets.
The TTM scalper indicator of John Carter’s Scalper Buys and Sells was originally created by HPotter and is as a close approximation of the one described in his book Mastering the Trade.
In this study you have a choice of:
Trend Filters:
- Average Directional Index ( ADX ) – buy when price is trend is up and sell when trend is down.
- Moving Average (MA) – buy when price close above the defined moving average and sell when price close below moving average
- Parabolic SAR – buy when SAR is above price is above price and sell when SAR is below price.
- All - Use ADX , MA and SAR as filters
For MA Filter , you can use the “TF MA Type” and "TF MA Period" parameter to select Simple or Exponential Moving Average and length.
Stop Loss:
- Average True Range (ATR) – ATR % stop as trailing stop loss.
- Parabolic SAR ( SAR ) – Parabolic SAR adapted as trailing stop loss.
For ATR , you can use the “ATR Trailing Stop Multiplier” parameter to set an initial offset for trailing stop loss.
Take Profit Target:
- Average True Range (ATR) – ATR % stop as trailing stop loss.
- Standard % – Percent as target profit
For ATR , you can use the “ATR Take Profit Multiplier” parameter to set an initial offset for trailing stop loss.
Additional feature include:
- Show Bar Colors
STRATEGY ONLY:
- Set back test date range
- Set trade direction - Long, Short or Both
- Use timed exit - Select method and bars
- Method 1: Exit after specified number of bars.
- Method 2: Exit after specified number of bars, ONLY if position is currently profitable.
- Method 3: Exit after specified number of bars, ONLY if position is currently losing.
TradingView Links:
Alerts:
How to use:
1. Apply the script by browsing through Indicators --> Invite-Only scripts and select the indicator
2. Once loaded, click the gear (settings) button to select/adjust the parameters based on your preference.
3. Wait for the next BUY or SELL signal to enter the trade!
Disclaimer:
The indicator and signals generated do not constitute investment advice; are provided solely for informational purposes and therefore is not an offer to buy or sell a security; are not warranted to be correct, complete or accurate; and are subject to change without notice.
Recherche dans les scripts pour "alert"
[astropark] 4h Crypto/USDT Strategy [strategy]Dear Followers,
today a new Swing and Scalper Tool , which works great for Cryptocurrencies on the USDT market on 4h timeframe .
This tool has some cool features:
it works on many timeframes, but best one is 4H timeframe : so you can enjoy both manual and bot trading by using a 24/7 running bot;
it comes in three working mode : default, alternative and high frequency ;
auto-stoploss: you can enable an stoploss in trade, bot will follow
It's always suggested to use a proper money and risk management in trades. This is not the "Holy Grail", it does not exist.
Strategy results are calculated from the beginning of 2018 till now, so more than 2 years, using 10000$ as initial capital and working at 1x leverage (no leverage at all!) and 0.1% trading fee already applied.
You can always DM me if you need any help to configure it on your preferred chart or if you want a customization of this bot for a specific pair.
This script will let you backtest this script and check profitability on your preferred market.
The alarms version of this indicator, which will let you set all notification alerts you may need in order to be alerted on each triggered signals, can be found by searching for astropark's "4h Crypto/USDT Strategy".
This is a premium indicator , so send me a private message in order to get access to this script.

888 BOT #backtest█ 888 BOT #backtest
This is an Expert Advisor 'EA' or Automated trading script for ‘longs’ and ‘shorts’, which uses only a Take Profit or, in the worst case, a Stop Loss to close the trade.
It's a much improved version of the previous ‘Repanocha’. It doesn`t use 'Trailing Stop' or 'security()' functions (although using a security function doesn`t mean that the script repaints) and all signals are confirmed, therefore the script doesn`t repaint in alert mode and is accurate in backtest mode.
Apart from the previous indicators, some more and other functions have been added for Stop-Loss, re-entry and leverage.
It uses 8 indicators, (many of you already know what they are, but in case there is someone new), these are the following:
1. Jurik Moving Average
It's a moving average created by Mark Jurik for professionals which eliminates the 'lag' or delay of the signal. It's better than other moving averages like EMA, DEMA, AMA or T3.
There are two ways to decrease noise using JMA. Increasing the 'LENGTH' parameter will cause JMA to move more slowly and therefore reduce noise at the expense of adding 'lag'
The 'JMA LENGTH', 'PHASE' and 'POWER' parameters offer a way to select the optimal balance between 'lag' and over boost.
Green: Bullish, Red: Bearish.
2. Range filter
Created by Donovan Wall, its function is to filter or eliminate noise and to better determine the price trend in the short term.
First, a uniform average price range 'SAMPLING PERIOD' is calculated for the filter base and multiplied by a specific quantity 'RANGE MULTIPLIER'.
The filter is then calculated by adjusting price movements that do not exceed the specified range.
Finally, the target ranges are plotted to show the prices that will trigger the filter movement.
Green: Bullish, Red: Bearish.
3. Average Directional Index (ADX Classic) and (ADX Masanakamura)
It's an indicator designed by Welles Wilder to measure the strength and direction of the market trend. The price movement is strong when the ADX has a positive slope and is above a certain minimum level 'ADX THRESHOLD' and for a given period 'ADX LENGTH'.
The green color of the bars indicates that the trend is bullish and that the ADX is above the level established by the threshold.
The red color of the bars indicates that the trend is down and that the ADX is above the threshold level.
The orange color of the bars indicates that the price is not strong and will surely lateralize.
You can choose between the classic option and the one created by a certain 'Masanakamura'. The main difference between the two is that in the first it uses RMA () and in the second SMA () in its calculation.
4. Parabolic SAR
This indicator, also created by Welles Wilder, places points that help define a trend. The Parabolic SAR can follow the price above or below, the peculiarity that it offers is that when the price touches the indicator, it jumps to the other side of the price (if the Parabolic SAR was below the price it jumps up and vice versa) to a distance predetermined by the indicator. At this time the indicator continues to follow the price, reducing the distance with each candle until it is finally touched again by the price and the process starts again. This procedure explains the name of the indicator: the Parabolic SAR follows the price generating a characteristic parabolic shape, when the price touches it, stops and turns (SAR is the acronym for 'stop and reverse'), giving rise to a new cycle. When the points are below the price, the trend is up, while the points above the price indicate a downward trend.
5. RSI with Volume
This indicator was created by LazyBear from the popular RSI.
The RSI is an oscillator-type indicator used in technical analysis and also created by Welles Wilder that shows the strength of the price by comparing individual movements up or down in successive closing prices.
LazyBear added a volume parameter that makes it more accurate to the market movement.
A good way to use RSI is by considering the 50 'RSI CENTER LINE' centerline. When the oscillator is above, the trend is bullish and when it is below, the trend is bearish.
6. Moving Average Convergence Divergence (MACD) and (MAC-Z)
It was created by Gerald Appel. Subsequently, the histogram was added to anticipate the crossing of MA. Broadly speaking, we can say that the MACD is an oscillator consisting of two moving averages that rotate around the zero line. The MACD line is the difference between a short moving average 'MACD FAST MA LENGTH' and a long moving average 'MACD SLOW MA LENGTH'. It's an indicator that allows us to have a reference on the trend of the asset on which it is operating, thus generating market entry and exit signals.
We can talk about a bull market when the MACD histogram is above the zero line, along with the signal line, while we are talking about a bear market when the MACD histogram is below the zero line.
There is the option of using the MAC-Z indicator created by LazyBear, which according to its author is more effective, by using the parameter VWAP (volume weighted average price) 'Z-VWAP LENGTH' together with a standard deviation 'STDEV LENGTH' in its calculation.
7. Volume Condition
Volume indicates the number of participants in this war between bulls and bears, the more volume the more likely the price will move in favor of the trend. A low trading volume indicates a lower number of participants and interest in the instrument in question. Low volumes may reveal weakness behind a price movement.
With this condition, those signals whose volume is less than the volume SMA for a period 'SMA VOLUME LENGTH' multiplied by a factor 'VOLUME FACTOR' are filtered. In addition, it determines the leverage used, the more volume, the more participants, the more probability that the price will move in our favor, that is, we can use more leverage. The leverage in this script is determined by how many times the volume is above the SMA line.
The maximum leverage is 8.
8. Bollinger Bands
This indicator was created by John Bollinger and consists of three bands that are drawn superimposed on the price evolution graph.
The central band is a moving average, normally a simple moving average calculated with 20 periods is used. ('BB LENGTH' Number of periods of the moving average)
The upper band is calculated by adding the value of the simple moving average X times the standard deviation of the moving average. ('BB MULTIPLIER' Number of times the standard deviation of the moving average)
The lower band is calculated by subtracting the simple moving average X times the standard deviation of the moving average.
the band between the upper and lower bands contains, statistically, almost 90% of the possible price variations, which means that any movement of the price outside the bands has special relevance.
In practical terms, Bollinger bands behave as if they were an elastic band so that, if the price touches them, it has a high probability of bouncing.
Sometimes, after the entry order is filled, the price is returned to the opposite side. If price touch the Bollinger band in the same previous conditions, another order is filled in the same direction of the position to improve the average entry price, (% MINIMUM BETTER PRICE ': Minimum price for the re-entry to be executed and that is better than the price of the previous position in a given %) in this way we give the trade a chance that the Take Profit is executed before. The downside is that the position is doubled in size. 'ACTIVATE DIVIDE TP': Divide the size of the TP in half. More probability of the trade closing but less profit.
█ STOP LOSS and RISK MANAGEMENT.
A good risk management is what can make your equity go up or be liquidated.
The % risk is the percentage of our capital that we are willing to lose by operation. This is recommended to be between 1-5%.
% Risk: (% Stop Loss x % Equity per trade x Leverage) / 100
First the strategy is calculated with Stop Loss, then the risk per operation is determined and from there, the amount per operation is calculated and not vice versa.
In this script you can use a normal Stop Loss or one according to the ATR. Also activate the option to trigger it earlier if the risk percentage is reached. '% RISK ALLOWED'
'STOP LOSS CONFIRMED': The Stop Loss is only activated if the closing of the previous bar is in the loss limit condition. It's useful to prevent the SL from triggering when they do a ‘pump’ to sweep Stops and then return the price to the previous state.
█ BACKTEST
The objective of the Backtest is to evaluate the effectiveness of our strategy. A good Backtest is determined by some parameters such as:
- RECOVERY FACTOR: It consists of dividing the 'net profit' by the 'drawdown’. An excellent trading system has a recovery factor of 10 or more; that is, it generates 10 times more net profit than drawdown.
- PROFIT FACTOR: The ‘Profit Factor’ is another popular measure of system performance. It's as simple as dividing what win trades earn by what loser trades lose. If the strategy is profitable then by definition the 'Profit Factor' is going to be greater than 1. Strategies that are not profitable produce profit factors less than one. A good system has a profit factor of 2 or more. The good thing about the ‘Profit Factor’ is that it tells us what we are going to earn for each dollar we lose. A profit factor of 2.5 tells us that for every dollar we lose operating we will earn 2.5.
- SHARPE: (Return system - Return without risk) / Deviation of returns.
When the variations of gains and losses are very high, the deviation is very high and that leads to a very poor ‘Sharpe’ ratio. If the operations are very close to the average (little deviation) the result is a fairly high 'Sharpe' ratio. If a strategy has a 'Sharpe' ratio greater than 1 it is a good strategy. If it has a 'Sharpe' ratio greater than 2, it is excellent. If it has a ‘Sharpe’ ratio less than 1 then we don't know if it is good or bad, we have to look at other parameters.
- MATHEMATICAL EXPECTATION: (% winning trades X average profit) + (% losing trades X average loss).
To earn money with a Trading system, it is not necessary to win all the operations, what is really important is the final result of the operation. A Trading system has to have positive mathematical expectation as is the case with this script: ME = (0.87 x 30.74$) - (0.13 x 56.16$) = (26.74 - 7.30) = 19.44$ > 0
The game of roulette, for example, has negative mathematical expectation for the player, it can have positive winning streaks, but in the long term, if you continue playing you will end up losing, and casinos know this very well.
PARAMETERS
'BACKTEST DAYS': Number of days back of historical data for the calculation of the Backtest.
'ENTRY TYPE': For '% EQUITY' if you have $ 10,000 of capital and select 7.5%, for example, your entry would be $ 750 without leverage. If you select CONTRACTS for the 'BTCUSDT' pair, for example, it would be the amount in 'Bitcoins' and if you select 'CASH' it would be the amount in $ dollars.
'QUANTITY (LEVERAGE 1X)': The amount for an entry with X1 leverage according to the previous section.
'MAXIMUM LEVERAGE': It's the maximum allowed multiplier of the quantity entered in the previous section according to the volume condition.
The settings are for Bitcoin at Binance Futures (BTC: USDTPERP) in 30 minutes.
For other pairs and other timeframes, the settings have to be adjusted again. And within a month, the settings will be different because we all know the market and the trend are changing.
█ 888 BOT (SPANISH)
Este es un Expert Advisor 'EA' o script de trading automatizado para ‘longs’ y ‘shorts’, el cual, utiliza solo un Take Profit o, en el peor de los casos, un Stop Loss para cerrar el trade.
Es una versión muy mejorada del anterior ‘Repanocha’. No utiliza ‘Trailing Stop’, ni funciones ‘security()’ (aunque usar una función security no significa que el script repinte) y todas las señales son confirmadas, por consiguiente, el script no repinta en modo alertas y es preciso en en el modo backtest.
Aparte de los anteriores indicadores se han añadido algunos más y otras funciones para Stop-Loss, de re-entrada y apalancamiento.
Utiliza 8 indicadores, (muchos ya sabéis sobradamente lo que son, pero por si hay alguien nuevo), son los siguientes:
1. Jurik Moving Average
Es una media móvil creada por Mark Jurik para profesionales la cual elimina el ‘lag’ o retardo de la señal. Es mejor que otras medias móviles como la EMA, DEMA, AMA o T3.
Hay dos formas de disminuir el ruido utilizando JMA. El aumento del parámetro 'LENGTH' hará que JMA se mueva más lentamente y, por lo tanto, reducirá el ruido a expensas de añadir ‘lag’
Los parámetros 'JMA LENGTH', 'PHASE' y 'POWER' ofrecen una forma de seleccionar el equilibrio óptimo entre ‘lag’ y sobre impulso.
Verde : Alcista, Rojo: Bajista.
2. Range filter
Creado por Donovan Wall, su función es la de filtrar o eliminar el ruido y poder determinar mejor la tendencia del precio a corto plazo.
Primero, se calcula un rango de precio promedio uniforme 'SAMPLING PERIOD' para la base del filtro y se multiplica por una cantidad específica 'RANGE MULTIPLIER'.
A continuación, el filtro se calcula ajustando los movimientos de precios que no exceden el rango especificado.
Por último, los rangos objetivo se trazan para mostrar los precios que activarán el movimiento del filtro.
Verde : Alcista, Rojo: Bajista.
3. Average Directional Index (ADX Classic) y (ADX Masanakamura)
Es un indicador diseñado por Welles Wilder para medir la fuerza y dirección de la tendencia del mercado. El movimiento del precio tiene fuerza cuando el ADX tiene pendiente positiva y está por encima de cierto nivel mínimo 'ADX THRESHOLD' y para un periodo dado 'ADX LENGTH'.
El color verde de las barras indica que la tendencia es alcista y que el ADX está por encima del nivel establecido por el threshold.
El color Rojo de las barras indica que la tendencia es bajista y que el ADX está por encima del nivel de threshold.
El color naranja de las barras indica que el precio no tiene fuerza y seguramente lateralizará.
Se puede elegir entre la opción clásica y la creada por un tal 'Masanakamura'. La diferencia principal entre los dos es que en el primero utiliza RMA() y en el segundo SMA() en su cálculo.
4. Parabolic SAR
Este indicador, creado también por Welles Wilder, coloca puntos que ayudan a definir una tendencia. El Parabolic SAR puede seguir al precio por encima o por debajo, la particularidad que ofrece es que cuando el precio toca al indicador, este salta al otro lado del precio (si el Parabolic SAR estaba por debajo del precio salta arriba y viceversa) a una distancia predeterminada por el indicador. En este momento el indicador vuelve a seguir al precio, reduciendo la distancia con cada vela hasta que finalmente es tocado otra vez por el precio y se vuelve a iniciar el proceso. Este procedimiento explica el nombre del indicador: el Parabolic SAR va siguiendo al precio generando una característica forma parabólica, cuando el precio lo toca, se para y da la vuelta (SAR son las siglas en inglés de ‘stop and reverse’), dando lugar a un nuevo ciclo. Cuando los puntos están por debajo del precio, la tendencia es alcista, mientras que los puntos por encima del precio indica una tendencia bajista.
5. RSI with Volume
Este indicador lo creo un tal LazyBear de TV a partir del popular RSI.
El RSI es un indicador tipo oscilador utilizado en análisis técnico y creado también por Welles Wilder que muestra la fuerza del precio mediante la comparación de los movimientos individuales al alza o a la baja de los sucesivos precios de cierre.
LazyBear le añadió un parámetro de volumen que lo hace más preciso al movimiento del mercado.
Una buena forma de usar el RSI es teniendo en cuenta la línea central de 50 'RSI CENTER LINE'. Cuando el oscilador está por encima, la tendencia es alcista y cuando está por debajo la tendencia es bajista.
6. Moving Average Convergence Divergence (MACD) y (MAC-Z)
Fue creado por Gerald Appel. Posteriormente se añadió el histograma para anticipar el cruce de medias. A grandes rasgos podemos decir que el MACD es un oscilador consistente en dos medias móviles que van girando en torno a la línea de cero. La línea del MACD no es más que la diferencia entre una media móvil corta 'MACD FAST MA LENGTH' y una media móvil larga 'MACD SLOW MA LENGTH'. Es un indicador que nos permite tener una referencia sobre la tendencia del activo sobre el cual se está operando, generando de este modo señales de entrada y salida del mercado.
Podemos hablar de mercado alcista cuando el histograma del MACD se sitúe por encima de la línea cero, junto con la línea de señal, mientras que hablaremos de mercado bajista cuando el histograma MACD se situará por debajo de la línea cero.
Está la opción de utilizar el indicador MAC-Z creado por LazyBear que según su autor es más eficaz, por utilizar el parámetro VWAP (precio medio ponderado por volumen) 'Z-VWAP LENGTH' junto con una desviación standard 'STDEV LENGTH' en su cálculo.
7. Volume Condition
El volumen indica el número de participantes en esta guerra entre toros y osos, cuanto más volumen más probabilidad de que se mueva el precio a favor de la tendencia. Un volumen bajo de negociación indica un menor número de participantes e interés por el instrumento en cuestión. Los bajos volúmenes pueden revelar debilidad detrás de un movimiento de precios.
Con esta condición se filtran aquellas señales cuyo volumen es inferior a la SMA de volumen para un periodo 'SMA VOLUME LENGTH' multiplicado por un factor 'VOLUME FACTOR'. Además, determina el apalancamiento utilizado, a más volumen, más participantes, más probabilidad de que se mueva el precio a nuestro favor, es decir, podemos utilizar más apalancamiento. El apalancamiento en este script lo determina las veces que está el volumen por encima de la línea de la SMA.
El apalancamiento máximo es de 8.
8. Bollinger Bands
Este indicador fue creado por John Bollinger y consiste en tres bandas que se dibujan superpuestas al gráfico de evolución del precio.
La banda central es una media móvil, normalmente se emplea una media móvil simple calculada con 20 períodos. ('BB LENGTH' Número de periodos de la media móvil)
La banda superior se calcula sumando al valor de la media móvil simple X veces la desviación típica de la media móvil. ('BB MULTIPLIER' Número de veces la desviación típica de la media móvil)
La banda inferior de calcula restando a la media móvil simple X veces la desviación típica de la media móvil.
la franja comprendida entre las bandas superior e inferior contiene, estadísticamente, casi un 90% de las posibles variaciones del precio, lo que significa que cualquier movimiento del precio fuera de las bandas tiene especial relevancia.
En términos prácticos, las bandas de Bollinger se comporta como si de una banda elástica se tratara de manera que, si el precio las toca, éste tiene mucha probabilidad de rebotar.
En ocasiones, después de rellenarse la orden de entrada, el precio se devuelve hacia el lado contrario. Si toca la banda de Bollinger se rellena otra orden en la misma dirección de la posición para mejorar el precio medio de entrada, (% MINIMUM BETTER PRICE': Precio mínimo para que se ejecute la re-entrada y que sea mejor que el precio de la posición anterior en un % dado) de esta manera damos una oportunidad al trade de que el Take Profit se ejecute antes. La desventaja es que se dobla el tamaño de la posición. 'ACTIVATE DIVIDE TP': Divide el tamaño del TP a la mitad. Más probabilidad de que se cierre el trade pero menos ganancias.
█ STOP LOSS y RISK MANAGEMENT.
Una buena gestión de las pérdidas o gestión del riesgo es lo que puede hacer que tu cuenta suba o se liquide en poco tiempo.
El % de riesgo es el porcentaje de nuestro capital que estamos dispuestos a perder por operación. Este se aconseja que debe estar comprendido entre un 1-5%.
% Risk = (% Stop Loss x % Equity per trade x Leverage) / 100
Primero se calcula la estrategia con Stop Loss, después se determina el riesgo por operación y a partir de ahí se calcula el monto por operación y no al revés.
En este script puedes usar un Stop Loss normal o uno según el ATR. También activar la opción de que salte antes si se alcanza el porcentaje de riesgo. '% RISK ALLOWED'
'STOP LOSS CONFIRMED': Solamente se activa el Stop Loss si el cierre de la barra anterior se encuentra en la condición de límite de pérdidas. Es útil para evitar que se dispare el SL cuando hacen un ‘pump’ para barrer Stops y luego se devuelve el precio a la normalidad.
█ BACKTEST
El objetivo del Backtest es evaluar la eficacia de nuestra estrategia. Un buen Backtest lo determinan algunos parámetros como son:
- RECOVERY FACTOR: Consiste en dividir el ‘beneficio neto’ entre el ‘drawdown’. Un excelente sistema de trading tiene un recovery factor de 10 o más; es decir, genera 10 veces más beneficio neto que drawdown.
- PROFIT FACTOR: El ‘Profit Factor’ es otra medida popular del rendimiento de un sistema. Es algo tan simple como dividir lo que ganan las operaciones con ganancias entre lo que pierden las operaciones con pérdidas. Si la estrategia es rentable entonces por definición el ‘Profit Factor’ va a ser mayor que 1. Las estrategias que no son rentables producen factores de beneficio menores que uno. Un buen sistema tiene un profit factor de 2 o más. Lo bueno del ‘Profit Factor’ es que nos dice lo que vamos a ganar por cada dolar que perdemos. Un profit factor de 2.5 nos dice que por cada dolar que perdamos operando vamos a ganar 2.5.
- SHARPE: (Retorno sistema – Retorno sin riesgo) / Desviación de los retornos.
Cuando las variaciones de ganancias y pérdidas son muy altas, la desviación es muy elevada y eso conlleva un ratio de ‘Sharpe’ muy pobre. Si las operaciones están muy cerca de la media (poca desviación) el resultado es un ratio de ‘Sharpe’ bastante elevado. Si una estrategia tiene un ratio de ‘Sharpe’ mayor que 1 es una buena estrategia. Si tiene un ratio de ‘Sharpe’ mayor que 2, es excelente. Si tiene un ratio de ‘Sharpe’ menor que 1 entonces no sabemos si es buena o mala, hay que mirar otros parámetros.
- MATHEMATICAL EXPECTATION:(% operaciones ganadoras X ganancia media) + (% operaciones perdedoras X pérdida media).
Para ganar dinero con un sistema de Trading, no es necesario ganar todas las operaciones, lo verdaderamente importante es el resultado final de la operativa. Un sistema de Trading tiene que tener esperanza matemática positiva como es el caso de este script.
El juego de la ruleta, por ejemplo, tiene esperanza matemática negativa para el jugador, puede tener rachas positivas de ganancias, pero a la larga, si se sigue jugando se acabará perdiendo, y esto los casinos lo saben muy bien.
PARAMETROS
'BACKTEST DAYS': Número de días atrás de datos históricos para el calculo del Backtest.
'ENTRY TYPE': Para % EQUITY si tienes 10000$ de capital y seleccionas 7.5% tu entrada sería de 750$ sin apalancamiento. Si seleccionas CONTRACTS para el par BTCUSDT sería la cantidad en Bitcoins y si seleccionas CASH sería la cantidad en dólares.
'QUANTITY (LEVERAGE 1X)': La cantidad para una entrada con apalancamiento X! según el apartado anterior.
'MAXIMUM LEVERAGE': Es el máximo multiplicador permitido de la cantidad introducida en el apartado anterior según la condición de volumen.
Los settings son para Bitcoin en Binance Futures (BTC:USDTPERP) en 30 minutos.
Para otro pares y otras temporalidades se tienen que ajustar las opciones de nuevo. Además para dentro de un mes, los ajustes serán otros distintos ya que el mercado y la tendencia es cambiante.

FTSMA - Trend is your frendThis my new solid strategy: if you belive that "TREND IS YOUR FRIEND" this is for you!
I have tested with many pairs and at many timeframes and have profit with just minor changes in settings.
I suggest to use it for intraday trading .
VERY IMPORTANT NOTE: this is a trend following strategy, so the target is to stay in the trade as much as possible. If your trading style is more focused on scalping and/or pullbaks, this strategy is not for you.
This strategy uses moving averages applied to Fourier waves for forecasting trend direction.
How strategy works:
- Buy when fast MA is above mid MA and price is above slow MA, which acts as a trend indicator.
- Sell when fast MA is below mid MA and price is below slow MA, which acts as a trend indicator.
Strategy uses a lot of pyramiding orders because when you are in a flat market phase it will close 1 or 2 orders with a loss, but when a big trend starts, it will have profit in a lot of orders.
So, if you analize carefully the strategy results, you will note that "Percent Profitable" is very low (30% in this case) because strategy opened a lot of orders also in flat markets with small losses, BUT "Avg # bars in winning trades" is very high and overall Profit is very high: when a big trend starts, orders are kept open for long time generating big profits.
Thanks to all pinescripters mentioned in the code for their snippets.
I have also a study with alerts. Next improvement (only to whom is interested to this script and follows me): study with alerts on multiple tickers all at one. Leave a comment if you want to have access to study.
HOW TO USE STRATEGY AND STUDY TOGHETER:
1- Add to chart the strategy first, so your workspace will be as clean as possible.
2- Open the Strategy Tester tab at footer of the page.
3- Modify settings to get best results (Profit, Profit Factor, Drawdown).
4- Add study with alerts to your chart with same setting of strategy.
I WILL PROVIDE A DETAILED QUICK INSTALLATION GUIDE WITH THE STUDY!
Please use comment section for any feedback or contact me if you need support.

Ichimoku Kinko Hyo Cloud + QQECombination of two strategies with alerts. Those scripts are not mine, I just mixed them up for own purposes.
I recommend use long alerts of Ichimoku in 15 minutes bars and short alerts of QQE strategy in 15 minutes bars as well.
QQE strategy should be used for quick price movements and Ichimoku for litle longer ones.
Good Luck!

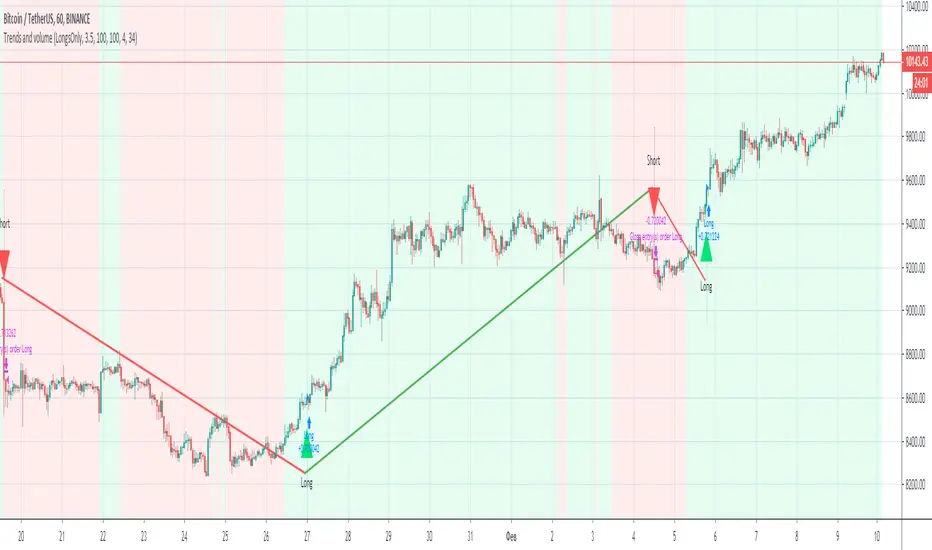
Trends and volume“Trends and volume” is a pair of ZigZag and Volume indicators. If in the ZigZag indicator a trend has changed from descending to ascending, and in the Volume indicator the volume of purchases (accumulation) exceeds the volume of sales (distribution), a signal to open a long position occurs.
Accordingly, the opening of a short position occurs with opposite indicators of trend and volume. The strategy has Volume smoothing settings and a ZigZag filter for selecting optimal settings on other instruments.
With default settings, the strategy allows you to make 2-4 successful trades per month, ideally shows the direction of the trades on the BINANCE:BTCUSDT , timeframe 1 hour.
Together with the “Trends and volume” backtest, you get the “Trends and volume alerts” indicator in which the alert function is built-in, you can set an alert for events: long entry and short entry.
Pay attention when you set alerts in the tradingview in the indicator, the true signal comes at the close of the hourly candle.
I can open demo access to the Trends and volume strategy for 15 days, for this write me.
Multi RIS Length RSI Strategy calibrated to 20min timeframeI have been working on many itterations of this script, on multiple time frames, with multiple settings.
It's not exactly how I want it, but if used on the 20 min timeframe (I chose this one to publish, not because it's the most profitable, or percent profitable , but for multiple other reasons.
1) From my back testing, this seems to be the most stable (gives the greatest margin for error). By that I mean, I am not a bot, I am a human trader, so I actually have to sleep, and work, and can't always trade all the time when I when I get my signals. So I need some margin of error.
The 20min time frame gives me this, it's still decently profitable (52K), and allows me some margin of error for being human.
2) It not exactly how I want it, because you have to use it in conjunction with the strategy tester to see if it is in longs or shorts (open trades). You can't see that on the app, or even if you are logged in to TV on a browser on a smart phone. At least I cant, I can only see the strategy tester when I am logged in on my computer, which obviously I can not be all the time.
3) It's also not exactly how I want it because it doesn't tell you when it is switching from buying additional longs (or shorts), and closing them out, and reversing. You can figure this out from the strategy tester, but I would like my script to make it more clear in real time.
4) The alerts on the script only fire after the current bar is closed. So really to use this you need to be a non free member or TV, because then you can add the appropriate RSIs to your chart, and set up real time alerts on them that will fire in real time, as opposed to displaying on the chart after the bar closes (a lot can happen in 20 minutes). Which is sad, and not my intent, I want this to be useful to free members, I just don't know how to do that given they don't have custom time frames (like 20 min), and multiple real time alerts. I can't fix that, that's a limitation of TV.

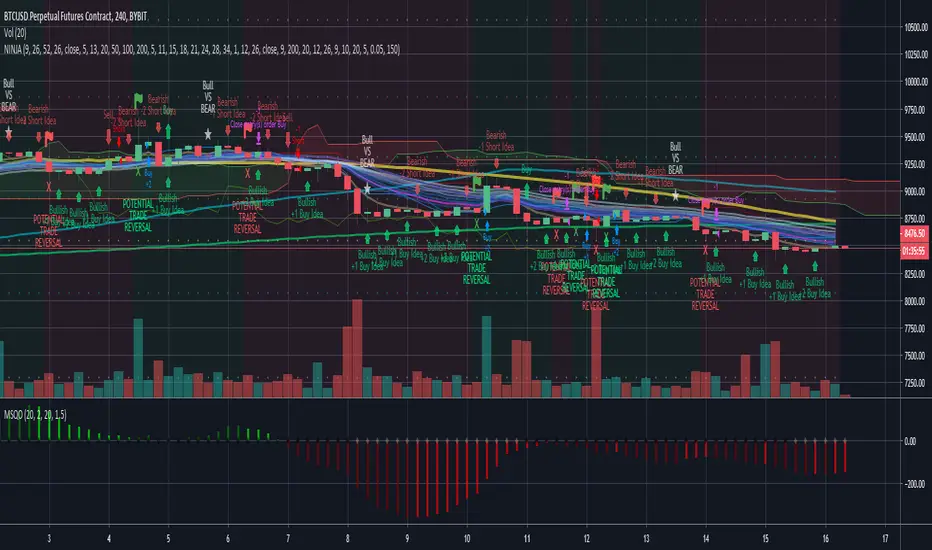
BTC BRAWL NINJA TRADERThe NINJA TRADER was devloped for trading competition higher leverage scalp trading. It is a modified from my Trade Trend Indicator (indicator) has been the brain child of 23 years of trading experience rolled into a simple to understand all market setup alert system based solely on 5 high probability trade set ups with a 6th high risk. The hope is to provide something that is can assist traders in building confidence in their trades with a little assistance from the indicator.
This like any and all indicators is not a be all and end to trading, yes while back tested the indicator has produced fantastic profitable results; past performance is not a guarantee of future but which with human intervention can increase the return result exponentially.
You need to be able to chart simple candle sticks and you need to have an understanding of support and resistance areas to make sense of what you are doing in trading otherwise even this indicator won't help you.
While this may alert buy or sell / long or short entrance these are to be taken as educational points of reference and if you wish to trade you are understanding that you enter and exit at your own risk. Not many indicators will alert you to the possibility of a rogue wave spike / dump or both, this will but everything is perspective of the time frame you are on.
The indicator is designed for the 4hour time frame with trade entry on the 15min and managed on the 30min time frame. Alot can happen within these time frame but as we know not every trader can sit in front of a screen for hours at a time and this let's one trade for swings. Once you have your entry you place your exits and you set your stops. If you wait for the alert to exit you are in a draw down this should never reach that point pay yourself for being right.
The set ups are simple:
1. Trend change from bearish to bullish buys are dip interim support entries.
2. Trend change from bullish to bearish sells are top interim resistance exits.
3. Blue buy is an entry position for a trade.
4. Blue long is an add position for a trade.
5. Red short is just that a short trade idea. (this is advanced and requires a manual cover target),
6. Green buy is a break out over the next candle to print above (highest risk)
All trades are based on a 5% to 10% of capital entry with no more than 40% ever in 1 trade goal is many consistent trade wins while limiting the losses and size.
Certain set ups such as longs over the Moving Averages but below the cloud can lead to strong rally returns as well as short in a bearish trend just above the Moving Averages can give prolonged selling pressure.
Pay attention to the golden dump line as it rises the closer to the candle it gets the higher the risk of the trade lacking continuation.
Made the golden dump line easier to bringing it forward.
Changed the trade trend reversal to stand out more as a marker of a trade even when alerts stacked
Added a calculation for the alert to recalculate based on the time frame chosen
Added a check balance verse the break out buy as to not false alert during the BTC BRAWL CHALLENGE in high risk trade setups
Added notification of bullvsbear action to avoid being caught in the BTC BRAWL CHALLENGE
Added a take profit reminder based on time frame volume
None of this is to be taken as investment advice but rather Edutainment and infotainment
//#TradeSocially
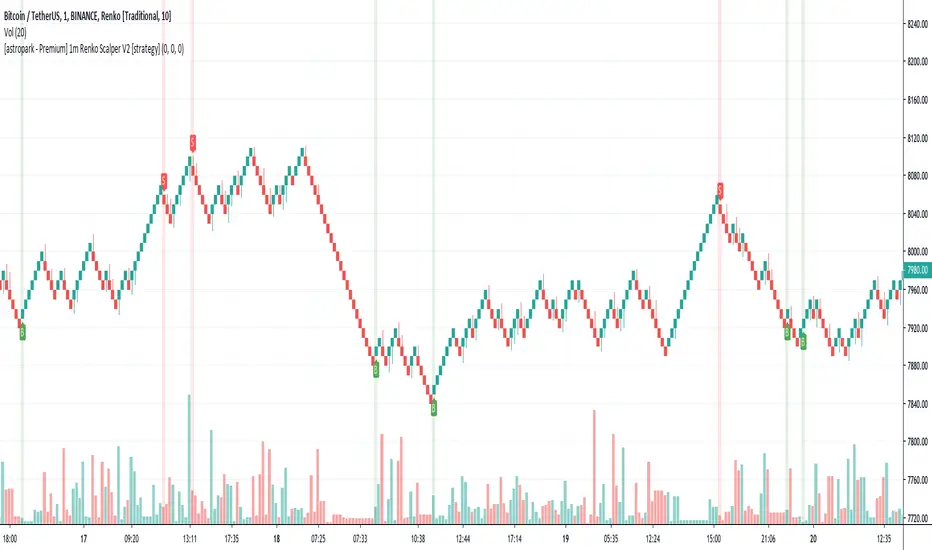
[astropark - Premium] 1m Renko Scalper V2 [strategy]Dear Followers,
today a new Scalper Tool , which works great on 1 minute timeframe , which is the best and more secure timeframe to use on a Renko chart, besides it works great up to 15m (I don't suggest to use a renko chart over 15m timeframe)!
It is an upgraded version of Bitmex Renko Scalper that you can find in my tradingview script page.
This tool has some cool features:
it works on 1 minute timeframe : so you can enjoy high-frequency trading by using a 24/7 running bot;
wait bricks optional mode : you may like to make script wait for triggering a new signal by waiting 1 or 2 more confirmation bricks
trailing stop : you can set a trailing stop in trade, so script will alert you if it will be reached in chart
This strategy can trigger till 5 buy or 5 sell signals in a row before reverting, so use a proper money management .
Strategy results are calculated on the timeframe from july to now, so on about 4 months, using 10000$ as initial capital and working at 3x leverage (very safe leverage!).
The user who wants to use this strategy, especially via an automated bot, must always set a stoploss at 5% from entry point or use a proper risk management strategy .
This is not the "Holy Grail", so use it with caution.
This script will let you backtest this script and find best settings for your preferred market. On Bitmex XBTUSD chart best settings is Traditional Renko chart with 10$ box size.
The alarms version of this indicator, which will let you set all notifications you may need in order to be alerted on each triggered signals, can be found by searching for "1m Renko Scalper V2".
This is a premium indicator , so send me a private message in order to get access to this script .
RSI-RENKO Divine Strategy (Backtesting)Live, non-repainting strategy using RENKO and RSI mixed together to multiple types of long and short positions.
- Features -
Live entry direction with trade warnings and alerts
Live trade building buy and sell limits (for buy/sell limits)
Entry location icons as well as pyramid entries (to add to existing position)
Swing trades that keep you in the trade for the maximum possible profit
1 scalp target based on the RSI settings and entry location
Dynamic trailing stop for swings and scalps
Alert conditions for every update and condition change of the strategy (Provided by indicator study)
4 pre-built color themes, including candlestick coloring
This strategy is best used with the companion indicators: Renko RSI and Renko Trend Momentum using the identical RSI and Trend settings.
The linked script is identical and used solely for alerts, because Trading View still after 3 years of requesting does not provide the ability to use alert conditions inside a strategy script, only an indicator script. This strategy should be used to backtest your settings.
The approach to this strategy uses several parallel trades of different types. In order to generate multiple trade types the "pyramid trades" setting of the strategy (second tab of the settings that lets you adjust the number of pyramid contracts) should be used.
- Trade Types -
Swing: This trade is entered on the solid arrows after the RSI has become oversold or overbought. It is key that all trades wait for some degree of pullback before entering, even after the trend flips between positive and negative. This trade is held until stopped out or an opposite trade is triggered that reverses the position.
Scalp: These trades have a limit buy/sell entry and a target. The initial target is the opposing RSI overbought or oversold level and changes in real time.
Turning on/off the different trade types (strategy only) is simple done by decreasing the number of contracts used for that trade type to zero. When the quantity is set to zero, that trade is not considered.
- Session -
The session filter is used to narrow trade executions by only allowing trades that are inside the session boundaries. This can be used to isolate the London or New York session for example. The default is 24 x 7 which filters no trades (Trading View has a bug when resetting this, so simply reset the indicator to get it back to 24x7).
Please see the following 3 videos introducing the concept of this strategy.
All feature requests or bug reports are welcome either by direct messaging or comments on this page or the linked indicator page.
Please PM for access. Cheers.

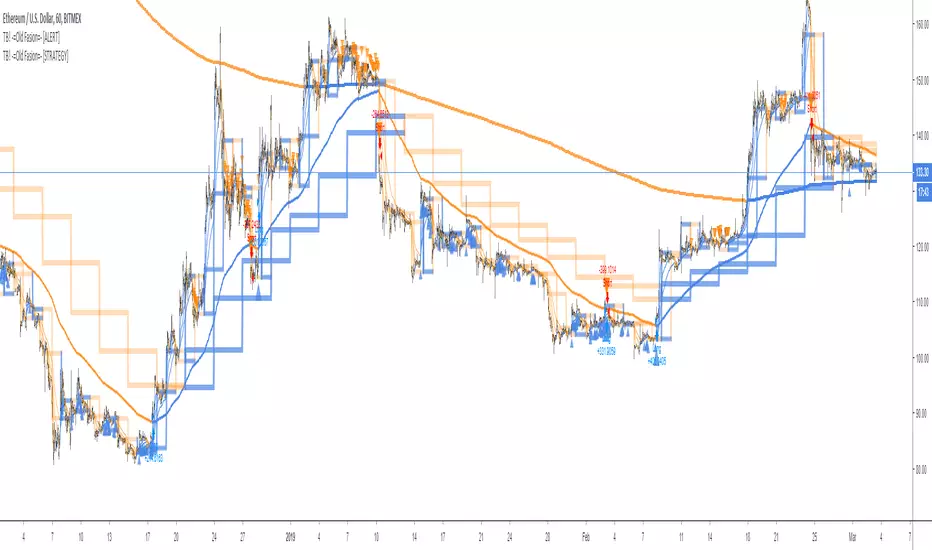
TB! -=Old Fasion=- [STRATEGY]This is the Strategy version of;
A Good Old Fasion sma/rma trading done as it should be done!
Great for hedging
- Bitfinex
- Poloniex
- Bitmex
- Deribit
No repaint, no false alerts or any other kind of nonsense.
With this strategy version you can determine the most optimal settings.
Those optimal setting you copy into the alert edition and of you go, sending alerts to GunBot, Haasbot, Dragonbot, Trexen, Autoview or whatever makes you happy.
RSI-ATR Divine Strategy (Backtesting)Live, non-repainting strategy using ATR and RSI mixed together to multiple types of long and short positions.
- Features -
Live entry direction with trade warnings and alerts
Live trade building buy and sell stops (for buy/sell stop limits)
Entry location icons as well as pyramid entries (to add to existing position)
2 separate targets based on the ATR setting and entry location
1 scalp target based on the ATR setting and entry location
2 separate trailing stops, 1 for "absolute stop" and 1 for "scalp trades"
Alert conditions for every update and condition change of the strategy (Provided by indicator study )
4 pre-built color themes, including candlestick coloring
This strategy is best used with my RSI Shaded Indicator using the identical RSI settings.
The linked script is identical and used solely for alerts, because Trading View still after 3 years of requesting does not provide the ability to use alert conditions inside a strategy script, only an indicator script. This strategy should be used to backtest your settings.
The approach to this strategy uses several parallel trades of different types. In order to generate multiple trade types the "pyramid trades" setting of the strategy (second tab of the settings that lets you adjust the number of pyramid contracts) should be used.
- Trade Types -
Swing: This trade is entered on the solid arrows after the RSI has become oversold or overbought. It is key that all trades wait for some degree of pullback before entering, even after the trend flips between positive and negative. This trade is held until stopped out or an opposite trade is triggered that reverses the position.
Target: These trades are entered at both the initial swing trade, or any subsequent pyramid/greedy trades that present themselves along the way while the trend remains in the same direction. The difference between these trades and the swing trade is that they have targets calculated as: Target = +/- * ATR. Until the target price is reached it does not change. When exceeded the next target trade will have a new target price.
Scalp: These trades have a limit buy/sell entry and a target. The target is very similar to the ATR Multiplier calculation for Target trades, but uses the instead.
Turning on/off the different trade types (strategy only) is simple done by decreasing the number of contracts used for that trade type to zero. When the quantity is set to zero, that trade is not considered.
- Session -
The session filter is used to narrow trade executions by only allowing trades that are inside the session boundaries. This can be used to isolate the London or New York session for example. The default is 24 x 7 which filters no trades (Trading View has a bug when resetting this, so simply reset the indicator to get it back to 24x7).
All feature requests or bug reports are welcome either by direct messaging or comments on this page or the linked indicator page.
Please PM for access. Cheers.

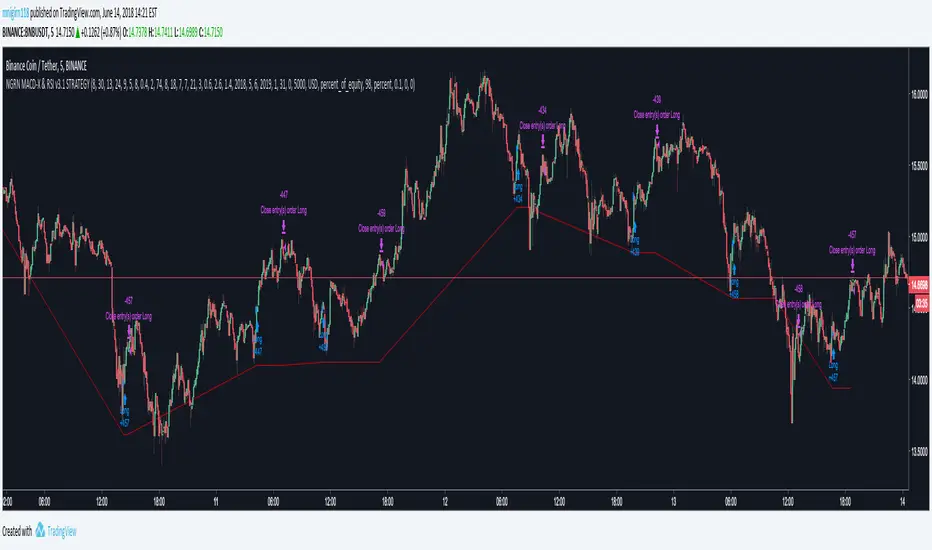
NGRN MACD-X & RSI v3.1 STRATEGYMACD-X, RSI & Volume Indicator Strategy - Version 3.1
Overview
This strategy and it's associated study were modeled after the famous Philakone described algorithms on his now defunct instructional video series.
This indicator allows for full customisation of parameters and interaction between three indicators that allow users to shape their trading methods to their desired goals. This associated strategy also allows users to backtest the study alerts script and find the best settings towards that end.
MACD + RSI + VOLUME - are of the most powerful and widely usded indicators, MACD/Histogram crosses, coupled with RSI & Volume increases/decreases will detects areas of deeply oversold / overbought and buys/sells on the reversal
Features
Full customisation - All parameters are open for customising to allow the trader to build their own strategy and adapt from market to market.
Clean/Simple UI - Facilitating ease of use.
Enable Buying or Selling, - or have them both active at the same time.
Toggle off and on ALTERNATING Buy and Sell feature (pyramiding) - to allow for consecutive dollar cost averaging style buys or SCALING out of an entry (partial sell).
Customizable Stop-Loss plot - to enable users to create a STOP-LOSS alert option or other alert(s) based on the plot location. See settings screenshot.
Study and associated Strategy - to use the TradingView ‘Strategy Tester’ back-testing features to find the best alert settings for specific coins in bear, bull and sideways markets.
Changes Version 3.1
UI consolidates reduntant script inputs making the script easier to use.
Fixes STOP-LOSS algorithm.
Adds a STOP-LOSS Plot (red line) to enable users to create a STOP-LOSS alert option or other alert(s) based on the plot location. See settings screenshot.
Access
Full Access is 0.1 ETH , one time fee for LIFETIME access to the STUDY indicator, STRATEGY and future updates as well as support and SETTINGS for various markets on the Binance Exchange.
Settings
BUY SETTINGS: prntscr.com
SELL SETTINGS: prntscr.com
STOP-LOSS SETTINGS : prntscr.com
Bitcoin Ninjas 'Ninja Signals' Script [NLM Edition] (STRATEGY)Bitcoin Ninjas 'Ninja Signals' Buy/Sell Alerts Script & Backtesting Strategy (NLM Edition)
Private script for research and development purposes based on our popular 'Ninja Signals' script. Public versions of our 'Ninja Signals' script are available below:
'Ninja Signals' v1.0 (SCRIPT)
'Ninja Signals' v1.0 (STRATEGY)
'Ninja Signals' v2.0 (SCRIPT)
'Ninja Signals' v2.0 (STRATEGY)

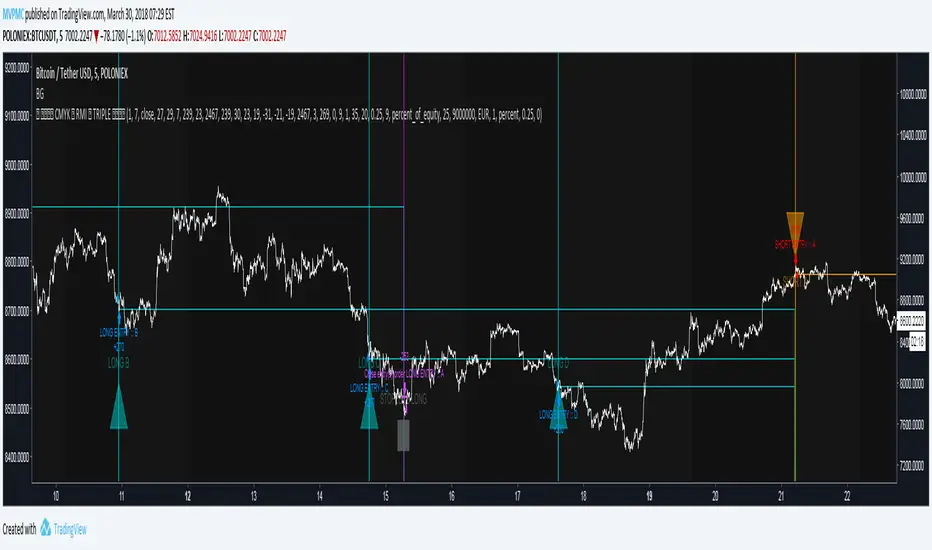
CMYK RMI TRIPLE Automated strategy▼ This is the strategy version of the script.
◊ Introduction
This script makes use of three RMI 's, that indicate Overbought/Oversold on different timescales that correspond with Frequency’s that move the market.
◊ Origin
The Relative Momentum Index was developed by Roger Altman and was introduced in his article in the February, 1993 issue of Technical Analysis of Stocks & Commodities magazine.
While RSI counts up and down ticks from close to close, the Relative Momentum Index counts up and down ticks from the close relative to a close x number of days ago.
This results in an RSI that is smoother, and has another setting for fine tuning results.
This bot originated out of Project XIAM , an investigative script that outlined my approach towards Automated Trading Strategies.
Are you interested in writing bots yourself ? check out the beta version of this script.
It has many bugs, but also most of the Skeleton.
◊ Usage
This script is intended for Automated Trading with AUTOVIEW or TVAUTOTRADER , on the 1 minute chart.
◊ Features Summary
Overlay Mode
Indicator Mode
Three RMI's
Trend adjustment
Pyramiding
Ignore first entries
Take Profit
Stop Loss
Interval between Entries
Multiring Fix
Alert signal Seperation
◊ Community
Wanna try this script out ? need help resolving a problem ?
CMYK :: discord.gg
AUTOVIEW :: discordapp.com
TRADINGVIEW UNOFFICIAL :: discord.gg
◊ Setting up Autoview Alerts
Use the study version of this script, To set up The Alerts Autoview Picks up on.
The Signals to work with are :
Open 1 Long
Use this to open one Long Position.
With quantity being : /
Once per bar
Being larger than 0
Comment example : e=exchange b=long q=amount t=market
Open 1 Short
Use this to open one Short Position.
With quantity being : /
Once per bar
Being larger than 0
Comment example : e=exchange b=short q=amount t=market
Close1 Position
Use this to Close The amount of one Open Position.
With quantity* being : /
Once per bar
Being larger than 0
Comment example : e=exchange c=position q=amount t=market
*Beware when using a percental % quantity, instead of an absolute quantity.
Percental Quantities are based on the , Not
And will change in absolute value relative to the amount of open trades.
Close All positions
Use this to Close All Open Positions.
With quantity being :
Once per bar
Being larger than 0
Comment example : e=exchange c=position t=market
For the specific Syntax used in the comment of the alert, visit Autoview .
◊ Setting up TVAutotrader
Use the strategy version of this script, And load it into TVAT .
◊ Backtesting
Use the strategy version of this script for backtesting.
◊ Contact
Wanna try this script out ? need help resolving a problem ?
CMYK :: discord.gg
AlgoIndex NQ/MNQ FuturesAlgoIndex Futures v3.15 - NQ/MNQ (10-Minute RTH)
This strategy is specifically tailored for trading CME Nasdaq futures - NQ and MNQ, including continuous symbols such as NQ1!/MNQ1!. It is optimized for a 10-minute chart during U.S. Regular Trading Hours (RTH), utilizing session settings defined in the Inputs. This strategy is not intended for other futures contracts or markets.
Core Concept
The strategy employs an ATR-based trend-band model similar to Supertrend for identifying directional mechanism changes in NQ/MNQ. Trade signals are evaluated at the bar close, incorporating session and time-based safety techniques to mitigate lower-quality trading opportunities near session boundaries.
Recommended Use (Optimized Defaults)
The default input parameters are fine-tuned for NQ/MNQ on the 10-minute chart. Users are encouraged to utilize these defaults initially and to make incremental adjustments to one variable at a time to understand the impact on the strategy's performance, trading frequency, and risk profile.
Configurable Inputs
- Take Profit / Stop Loss Settings:
- Enable Stop Loss and define Stop Loss (Points)
- Enable Take Profit and define Take Profit (Points)
- Enable Trailing Stop and set both Trailing Stop (Points) and Trailing Offset (Points)
- Time Avoidance Filter:
- Enable Time Avoidance
- Avoid First X Minutes
- Avoid Last X Minutes
- Display Avoidance Zones (visual overlay)
- Session Filter and End-of-Day Management:
- Enable Session Filter
- Define Trading Session (default: 09:30-16:00)
- Select Session Timezone
- Option to Close Positions at Session End
- Specify EOD Close Minutes Before (default: 20)
- Safety Controls:
- Option to Close Before Holidays (when enabled, this feature allows the strategy to flatten positions prior to holiday or early close conditions)
- Automation Settings (Optional):
- Ticker Override (optional)
- Define Contracts (position size)
- Strategy Configuration:
- Trade Direction: Both / Long Only / Short Only
- Visual Configuration:
- Option to Show Buy/Sell Signals
- Highlight Trend Zones
- Display Info Table
- Customizable Bull/Bear Colors
Alerts and Automation (Optional)
This strategy can generate order-fill alert payloads for hooking into webhook-based automation solutions. Keep in mind to validate your alert type and your bridge/broker configuration during Replay and paper trading. Note that reversals may trigger two sequential actions (e.g., exit followed by new entry).
Backtest Notes (Optional)
For more precise historical fill data, consider enabling TradingView’s Bar Magnifier in Strategy Properties. Always apply consistent assumptions for commission and slippage when comparing backtest results.
Disclaimer
This script is intended for informational and educational purposes only and does not constitute investment advice. Trading futures carries significant risk and may result in losses that exceed the initial deposit. Backtested results are hypothetical and do not guarantee future performance.

Trend Following $ZEC - Multi-Timeframe Structure Filter + Revers# Trend Following CRYPTOCAP:ZEC - Strategy Guide
## 📊 Strategy Overview
Trend Following CRYPTOCAP:ZEC is an enhanced Turtle Trading system designed for cryptocurrency spot trading, combining Donchian Channel breakouts, multi-timeframe structure filtering, and ATR-based dynamic risk management for both long and short positions.
---
## 🎯 Core Features
1. Multi-Timeframe Structure Filtering
- Uses Swing High/Low to identify market structure
- Customizable structure timeframe (default: 1 minute)
- Only enters trades in the direction of the trend, avoiding counter-trend positions
2. Reverse Signal Exit
- No fixed stop-loss or fixed-period exits
- Exits only when a reverse entry signal triggers
- Maximizes trend profits, reduces premature exits
3. ATR Dynamic Pyramiding
- Adds positions when price moves 0.5 ATR in favorable direction
- Supports up to 2 units maximum (adjustable)
- Pyramid scaling to enhance profitability
4. Complete Risk Management
- Fixed position size (5000 USD per unit)
- Commission fee 0.06% (Binance spot rate)
- Initial capital 10,000 USD
---
## 📈 Trading Logic
Entry Conditions
✅ Long Entry:
- Close price breaks above 20-period high
- Structure trend is bullish (price breaks above Swing High)
✅ Short Entry:
- Close price breaks below 20-period low
- Structure trend is bearish (price breaks below Swing Low)
Add Position Conditions
- Long: Price rises ≥ 0.5 ATR
- Short: Price falls ≥ 0.5 ATR
- Maximum 2 units including initial entry
Exit Conditions
- Long Exit: When short entry signal triggers (price breaks 20-period low + structure turns bearish)
- Short Exit: When long entry signal triggers (price breaks 20-period high + structure turns bullish)
---
## ⚙️ Parameter Settings
Channel Settings
- Entry Channel Period: 20 (Donchian Channel breakout period)
- Exit Channel Period: 10 (reserved parameter, actually uses reverse signal exit)
ATR Settings
- ATR Period: 20
- Stop Loss ATR Multiplier: 2.0 (reserved parameter)
- Add Position ATR Multiplier: 0.5
Structure Filter
- Swing Length: 160 (Swing High/Low calculation period)
- Structure Timeframe: 1 minute (can change to 5/15/60, etc.)
Position Management
- Maximum Units: 2 (including initial entry)
- Capital Per Unit: 5000 USD
---
## 🎨 Visualization Features
Background Colors
- Light Green: Bullish structure
- Light Red: Bearish structure
- Dark Green: Long entry
- Dark Red: Short entry
Optional Display (Default: OFF)
- Entry/exit channel lines
- Structure high/low lines
- ATR stop-loss line
- Next add position indicator
- Entry/exit labels
---
## 📱 Alert Message Format
Strategy sends notifications on entry/exit with the following format:
- Entry: `1m Long EP:428.26`
- Add Position: `15m Add Long 2/2 EP:429.50`
- Exit: `1m Close Long Reverse Signal`
Where:
- `1m`/`15m` = Current chart timeframe
- `EP` = Entry Price
---
## 💰 Backtest Settings
Capital Allocation
- Initial Capital: 10,000 USD
- Per Entry: 5,000 USD (split into 2 entries)
- Leverage: 0x (spot trading)
Trading Costs
- Commission: 0.06% (Binance spot VIP0)
- Slippage: 0
---
## 🎯 Use Cases
✅ Best Scenarios
- Trending markets
- Moderate volatility assets
- 1-minute to 4-hour timeframes
⚠️ Not Suitable For
- Highly volatile choppy markets
- Low liquidity small-cap coins
- Extreme market conditions (black swan events)
---
## 📊 Usage Recommendations
Timeframe Suggestions
| Timeframe | Trading Style | Suggested Parameter Adjustment |
|-----------|--------------|-------------------------------|
| 1-5 min | Scalping | Swing Length 100-160 |
| 15-30 min | Short-term | Swing Length 50-100 |
| 1-4 hour | Swing Trading | Swing Length 20-50 |
Optimization Tips
1. Adjust swing length based on backtest results
2. Different coins may require different parameters
3. Recommend backtesting on 1-minute chart first before live trading
4. Enable labels to observe entry/exit points
---
## ⚠️ Risk Disclaimer
1. Past Performance Does Not Guarantee Future Results
- Backtest data is for reference only
- Live trading may be affected by slippage, delays, etc.
2. Market Condition Changes
- Strategy performs better in trending markets
- May experience frequent stops in ranging markets
3. Capital Management
- Do not invest more than you can afford to lose
- Recommend setting total capital stop-loss threshold
4. Commission Impact
- Frequent trading accumulates commission fees
- Recommend using exchange discounts (BNB fee reduction, etc.)
---
## 🔧 Troubleshooting
Q: No entry signals?
A: Check if structure filter is too strict, adjust swing length or timeframe
Q: Too many labels displayed?
A: Turn off "Show Labels" option in settings
Q: Poor backtest performance?
A:
1. Check if the coin is suitable for trend-following strategies
2. Adjust parameters (swing length, channel period)
3. Try different timeframes
Q: How to set alerts?
A:
1. Click "Alert" in top-right corner of chart
2. Condition: Select "Strategy - Trend Following CRYPTOCAP:ZEC "
3. Choose "Order filled"
4. Set notification method (Webhook/Email/App)
---
## 📞 Contact Information
Strategy Name: Trend Following CRYPTOCAP:ZEC
Version: v1.0
Pine Script Version: v6
Last Updated: December 2025
---
## 📄 Copyright Notice
This strategy is for educational and research purposes only.
All risks of using this strategy for live trading are borne by the user.
Commercial use without authorization is prohibited.
---
## 🎓 Learning Resources
To understand the strategy principles in depth, recommended reading:
- "The Complete TurtleTrader" - Curtis Faith
- "Trend Following" - Michael Covel
- TradingView Pine Script Official Documentation
---
Happy Trading! Remember to manage your risk 📈

StrategyScript77 Is a rule-based strategy built on top of an Ichimoku based engine.
Ichimoku concepts are used as the backbone for trend and momentum filtering, so the strategy tends to stay on the side of the dominant move instead of fighting it.
The name “Super77” comes from the behavior I consistently observed in testing because the win rate tends to hover around the 70–80% range, often clustering around ~77% when used as intended.
It’s not a promise or guarantee, but it reflects the core design philosophy: frequent, relatively small but steady wins, with controlled and manageable losses.
Trading Style – Built for Conservative Traders
Super77 is intentionally designed for traders who prefer a conservative and calm approach:
Entries only at bar close
The strategy waits for bar close confirmation before entering a position. No intrabar guessing, no chasing half-formed signals. If the signal is still valid at close, only then will it enter.
Exits automated on bar close
Exits are also managed on bar close, which makes the logic transparent, easy to review on the chart, and more robust in backtesting compared to tick-based or intrabar hacks.
Semi-auto friendly
If you like to keep some discretion, you can treat it as semi-automatic:
Let the strategy generate entry signals
Manually cancel or skip certain trades if market context changes (news, extreme volatility, etc.)
This combination makes Super77 suitable for traders who don’t want to stare at the screen all day but still want structure and automation.
How to Use
Works best with bar-close execution (avoid trying to simulate intrabar fills if you want consistent behavior).
Designed for conservative, trend-aligned trading, not for hyper-scalping or news gambling.
Can be used as:
Fully automated (let all entries/exits trigger on bar close), or
Semi-automated (use alerts/signals but manually cancel some entries).
Step-by-Step: Automation with Cornix (Webhook Setup)
You can automate Super77 using Cornix by connecting TradingView alerts to your Cornix group via webhook.
Note: Exact button names may differ slightly depending on Cornix / TradingView updates, but the flow is always the same:
Cornix group → get webhook URL & mapping → TradingView alerts → signals sent to Cornix.
(Optional) Map specific pairs / directions
If you use UUID / signal mapping per symbol and per side (long/short), set them up in Cornix according to your own template.
Super77 can be used either:
On a single pair (simple setup), or
On multiple pairs if your alert / webhook structure supports that. So you can pick many pairs with 1 script.
Final Notes & Disclaimer
Super77 is an educational and experimental trading tool, not financial advice.
Past performance in back tests does not guarantee future results.
Always:
Test on demo or paper first
Adjust risk to match your own profile
Accept that losses and drawdowns are a natural part of any strategy
If you’re looking for a strategy that reflects a conservative, confirmation-based trading style with a focus on steady win rate and smoother equity behavior, Super77 was built exactly with that mindset in mind.

Ghost Robo [Bit2Billions]Ghost Robo — Automated Gap-Based Trading System
*An intelligent, fully automated trading strategy designed to identify high-probability opportunities using fair-value gaps, volume, and price action—without adding clutter to your chart.*
Ghost Robo combines gap detection, volume analysis, and smart entry logic into a single, streamlined system. It executes trades cleanly while offering backtesting, position sizing, alerts, and risk management—all internally. The strategy is engineered to maximize precision and reduce noise, giving traders an actionable, automated trading workflow.
Key Features
1. Automatic Gap Analysis
* Detects bullish and bearish fair-value gaps internally for trade logic.
* Evaluates gap “fill” percentages against configurable thresholds for high-probability entries.
2. Volume-Based Decision Making
* Integrates buying and selling activity to assess the strength of each gap.
* Filters trades based on real-time volume analysis for reliable execution.
3. Smart Entry Rules
* Trades are triggered automatically based on gap characteristics, candle confirmation, and user-defined thresholds.
* Queue management and deduplication avoid repeated trades on the same opportunity.
4. Flexible Filters
* Conditions include volume, bull/bear balance, gap age, and candle patterns.
* Allows traders to tune the strategy for their preferred market conditions.
5. Built-in Risk Management
* Stop-loss enforcement, optional trailing stops, and single-position restrictions.
* Ensures disciplined execution and controlled risk exposure.
6. Clean, No-Visual Execution
* All gap detection and calculations occur internally; charts remain uncluttered.
* Ideal for traders who prefer automated logic without additional chart overlays.
What Ghost Robo Solves
* Automates gap-based trading strategies with precision.
* Ensures disciplined entries using multiple filters and predictive gap logic.
* Reduces repeated trades and focuses on high-quality opportunities.
* Provides a complete system for backtesting, alerts, and position management.
Recommended Timeframes & Markets
* Timeframes: 15m and higher (15m, 1H, 4H, Daily). Works on intraday but benefits from higher timeframe structure.
* Markets: Liquid FX pairs, major crypto, indices, and liquid equities.
* Notes: For illiquid instruments, tighten volume filters or use higher timeframes for cleaner signals.
Inputs & Settings
* Default settings pre-configured
* Simple Show/Hide toggles for modules
* Minimal exposed fields for ease of use
Recommended Timeframes & Markets
* Works best on 15M, 1H, 4H, Daily, and higher
* Suitable across forex, crypto, indices, and liquid equities
* Pivot-based modules may show noise on illiquid assets
Performance & Limitations
* May draw many objects → disable unused modules for speed
* Refresh the chart if historical buffer issues occur
* TradingView platform limitations handled internally
License & Legal
* Proprietary © 2025
* Redistribution, resale, or disclosure prohibited
* Independently developed with proprietary extensions
* Any resemblance to other tools may result from public-domain concepts
Respect & Transparency
* Built on widely recognized public trading concepts.
* Developed with respect for the TradingView community.
* Any overlaps or similarities can be addressed constructively.
Disclaimer
* Educational purposes only
* Not financial advice
* Trading carries risk — always use paper testing and proper risk management
FAQs
* Source code is not public
* Works best on 15m, 1H, 4H, Daily, Weekly charts
* Modules can be hidden/shown with toggles
* Alerts can be set up manually by users
* Supports multiple markets: forex, crypto, indices, and equities
About Ghost Trading Suite
Author: BIT2BILLIONS
Project: Ghost Trading Suite © 2025
Indicators: Ghost Matrix, Ghost Protocol, Ghost Cipher, Ghost Shadow
Strategies: Ghost Robo, Ghost Robo Plus
Pine Version: V6
The Ghost Trading Suite is designed to simplify and automate many aspects of chart analysis. It helps traders identify market structure, divergences, support and resistance levels, and momentum efficiently, reducing manual charting time.
The suite includes several integrated tools — such as Ghost Matrix, Ghost Protocol, Ghost Cipher, Ghost Shadow, Ghost Robo, and Ghost Robo Plus — each combining analytical modules for enhanced clarity in trend direction, volatility, pivot detection, and momentum tracking.
Together, these tools form a cohesive framework that assists in visualizing market behavior, measuring momentum, detecting pivots, and analyzing price structure effectively.
This project focuses on providing adaptable and professional-grade tools that turn complex market data into clear, actionable insights for technical analysis.
Crafted with 💖 by BIT2BILLIONS for Traders. That's All Folks!
Changelog
v1.0 – Core Release
* Introduced fully automated gap-based strategy using fair-value gaps (FVGs) for trade logic.
* Added internal volume analysis to evaluate bullish/bearish strength for each gap.
* Implemented smart entry triggers based on gap “fill” percentages.
* Added configurable filters for volume, bull/bear balance, age of gap, candle confirmation, and cooldown between trades.
* Introduced queue management & deduplication, ensuring only the most relevant gaps are traded and repeated entries are avoided.
* Implemented risk management features, including percentage stop-loss, optional trailing stops, and single-position enforcement.
* Fully non-visual execution, keeping charts clean while all gap detection and trade calculations happen internally.
* Enabled backtesting, position sizing, and alert creation for complete strategy management.

ChronoPulse MS-MACD Resonance StrategyChronoPulse MS-MACD Resonance Strategy
A systematic trading strategy that combines higher-timeframe market structure analysis with dual MACD momentum confirmation, ATR-based risk management, and real-time quality assurance monitoring.
Core Principles
The strategy operates on the principle of multi-timeframe confluence, requiring agreement between:
Market structure breaks (CHOCH/BOS) on a higher timeframe
Dual MACD momentum confirmation (classic and crypto-tuned profiles)
Trend alignment via directional EMAs
Volatility and volume filters
Quality score composite threshold
Strategy Components
Market Structure Engine : Detects Break of Structure (BOS) and Change of Character (CHOCH) events using confirmed pivots on a configurable higher timeframe. Default structure timeframe is 240 minutes (4H).
Dual MACD Fusion : Requires agreement between two MACD configurations:
Classic MACD: 12/26/9 (default)
Fusion MACD: 8/21/5 (default, optimized for crypto volatility)
Both must agree on direction before trade execution. This can be disabled to use single MACD confirmation.
Trend Alignment : Uses two EMAs for directional bias:
Directional EMA: 55 periods (default)
Execution Trend Guide: 34 periods (default)
Both must align with trade direction.
ATR Risk Management : All risk parameters are expressed in ATR multiples:
Stop Loss: 1.5 × ATR (default)
Take Profit: 3.0 × ATR (default)
Trail Activation: 1.0 × ATR profit required (default)
Trail Distance: 1.5 × ATR behind price (default)
Volume Surge Filter : Optional gate requiring current volume to exceed a multiple of the volume SMA. Default threshold is 1.4× the 20-period volume SMA.
Quality Score Gate : Composite score (0-1) combining:
Structure alignment (0.0-1.0)
Momentum strength (0.0-1.0)
Trend alignment (0.0-1.0)
ATR volatility score (0.0-1.0)
Volume intensity (0.0-1.0)
Default threshold: 0.62. Trades only execute when quality score exceeds this threshold.
Execution Discipline : Trade budgeting system:
Maximum trades per session: 6 (default)
Cooldown bars between entries: 5 (default)
Quality Assurance Console : Real-time monitoring panel displaying:
Structure status (pass/fail)
Momentum confirmation (pass/fail)
Volatility readiness (pass/fail)
Quality score (pass/fail)
Discipline compliance (pass/fail)
Performance metrics (win rate, profit factor)
Net PnL
Certification requires: Win Rate ≥ 40%, Profit Factor ≥ 1.4, Minimum 25 closed trades, and positive net profit.
Integrity Suite : Optional validation panel that audits:
Configuration sanity checks
ATR data readiness
EMA hierarchy validity
Performance realism checks
Strategy Settings
strategy(
title="ChronoPulse MS-MACD Resonance Strategy",
shorttitle="ChronPulse",
overlay=true,
max_labels_count=500,
max_lines_count=500,
initial_capital=100000,
currency=currency.USD,
pyramiding=0,
commission_type=strategy.commission.percent,
commission_value=0.015,
slippage=2,
default_qty_type=strategy.percent_of_equity,
default_qty_value=2.0,
calc_on_order_fills=true,
calc_on_every_tick=true,
process_orders_on_close=true
)
Key Input Parameters
Structure Timeframe : 240 (4H) - Higher timeframe for structure analysis
Structure Pivot Left/Right : 3/3 - Pivot confirmation periods
Structure Break Buffer : 0.15% - Buffer for structure break confirmation
MACD Fast/Slow/Signal : 12/26/9 - Classic MACD parameters
Fusion MACD Fast/Slow/Signal : 8/21/5 - Crypto-tuned MACD parameters
Directional EMA Length : 55 - Primary trend filter
Execution Trend Guide : 34 - Secondary trend filter
ATR Length : 14 - ATR calculation period
ATR Stop Multiplier : 1.5 - Stop loss in ATR units
ATR Target Multiplier : 3.0 - Take profit in ATR units
Trail Activation : 1.0 ATR - Profit required before trailing
Trail Distance : 1.5 ATR - Distance behind price
Volume Threshold : 1.4× - Volume surge multiplier
Quality Threshold : 0.62 - Minimum quality score (0-1)
Max Trades Per Session : 6 - Daily trade limit
Cooldown Bars : 5 - Bars between entries
Win-Rate Target : 40% - Minimum for QA certification
Profit Factor Target : 1.4 - Minimum for QA certification
Minimum Trades for QA : 25 - Required closed trades
Signal Generation Logic
A trade signal is generated when ALL of the following conditions are met:
Higher timeframe structure shows bullish (CHOCH/BOS) or bearish structure break
Both MACD profiles agree on direction (if fusion enabled)
Price is above both EMAs for longs (below for shorts)
ATR data is ready and above minimum threshold
Volume exceeds threshold × SMA (if volume gate enabled)
Quality score ≥ quality threshold
Trade budget available (under max trades per day)
Cooldown period satisfied
Risk Management
Stop loss and take profit are set immediately on entry
Trailing stop activates after 1.0 ATR of profit
Trailing stop maintains 1.5 ATR distance behind highest profit point
Position sizing uses 2% of equity per trade (default)
No pyramiding (single position per direction)
Limitations and Considerations
The strategy requires sufficient historical data for higher timeframe structure analysis
Quality gate may filter out many potential trades, reducing trade frequency
Performance metrics are based on historical backtesting and do not guarantee future results
Commission and slippage assumptions (0.015% + 2 ticks) may vary by broker
The strategy is optimized for trending markets with clear structure breaks
Choppy or ranging markets may produce false signals
Crypto markets may require different parameter tuning than traditional assets
Optimization Notes
The strategy includes several parameters that can be tuned for different market conditions:
Quality Threshold : Lower values (0.50-0.60) allow more trades but may reduce average quality. Higher values (0.70+) are more selective but may miss opportunities.
Structure Timeframe : Use 240 (4H) for intraday trading, Daily for swing trading, Weekly for position trading
Volume Gate : Disable for low-liquidity pairs or when volume data is unreliable
Dual MACD Fusion : Disable for mean-reverting markets where single MACD may be more responsive
Trade Discipline : Adjust max trades and cooldown based on your risk tolerance and market volatility
Non-Repainting Guarantee
All higher timeframe data requests use lookahead=barmerge.lookahead_off to prevent repainting. Pivot detection waits for full confirmation before registering structure breaks. All visual elements (tables, labels) update only on closed bars.
Alerts
Three alert conditions are available:
ChronoPulse Long Setup : Fires when all long entry conditions are met
ChronoPulse Short Setup : Fires when all short entry conditions are met
ChronoPulse QA Certification : Fires when Quality Assurance console reaches CERTIFIED status
Configure alerts with "Once Per Bar Close" delivery to match the non-repainting design.
Visual Elements
Structure Labels : CHOCH↑, CHOCH↓, BOS↑, BOS↓ markers on structure breaks
Directional EMA : Orange line showing trend bias
Trailing Stop Lines : Green (long) and red (short) trailing stop levels
Dashboard Panel : Real-time status display (structure, MACD, ATR, quality, PnL)
QA Console : Quality assurance monitoring panel
Integrity Suite Panel : Optional validation status display
Recommended Usage
Forward test with paper trading before live deployment
Monitor the QA console until it reaches CERTIFIED status
Adjust parameters based on your specific market and timeframe
Respect the trade discipline limits to avoid over-trading
Review quality scores and adjust threshold if needed
Use appropriate commission and slippage settings for your broker
Technical Implementation
The strategy uses Pine Script v6 with the following key features:
Multi-timeframe data requests with lookahead protection
Confirmed pivot detection for structure analysis
Dynamic trailing stop management
Real-time quality score calculation
Trade budgeting and cooldown enforcement
Comprehensive dashboard and monitoring panels
All source code is open and available for review and modification.
Disclaimer
This script is for educational and informational purposes only. It is not intended as financial, investment, or trading advice. Past performance does not guarantee future results. Trading involves substantial risk of loss and is not suitable for all investors. Always conduct your own research and consult with a qualified financial advisor before making any trading decisions. The author and TradingView are not responsible for any losses incurred from using this strategy.

Hanzo Strategy - Volume & Smart Money📊 HANZO STRATEGY - Complete Description
## 🎯 Strategy Overview
The **Hanzo Strategy** is an advanced institutional trading system that combines Volume Profile analysis, Smart Money Concepts, and Price Action patterns to identify high-probability trade setups. This strategy is specifically designed for trading Gold (XAUUSD), NAS100, and US30 on the 15-minute timeframe.
---
## 🧠 Core Trading Philosophy
The Hanzo Strategy operates on the principle that **institutional money leaves footprints** in the market through:
- Volume accumulation at key price levels
- Liquidity sweeps and stop hunts
- Order block formations
- Strategic wick rejections at support/resistance
By identifying these institutional behaviors and combining them with precise volume analysis, the strategy aims to trade **with** the smart money, not against it.
---
## 🔑 Key Components
### 1️⃣ **Fixed Range Volume Profile (FRVP)**
- **What it does:** Analyzes the last 2 days of price action and calculates where the most volume traded
- **Point of Control (POC):** The price level with the highest trading volume - acts as a magnet for price
- **How we use it:** Price tends to revert to POC. When price is far from POC and starts moving toward it, we prepare for entries
- **Visual:** Yellow cross line on the chart marking the POC
### 2️⃣ **Wick Cluster Detection**
- **What it does:** Automatically identifies price levels where multiple candle wicks have rejected (2-6+ wicks)
- **Why it matters:** Multiple rejections at the same level indicate strong institutional support/resistance
- **Upper wick clusters:** Resistance zones where price was rejected downward
- **Lower wick clusters:** Support zones where price was rejected upward
- **Visual:** Dashed lines (red for resistance, green for support)
### 3️⃣ **Session Volatility Boxes**
- **London Session (8:00-16:00 UTC+3):** Captures European market volatility range
- **New York Session (13:30-20:00 UTC+3):** Captures US market volatility range
- **How we use it:** These ranges often act as support/resistance for the rest of the day
- **Visual:** Blue box for London, Orange box for New York
### 4️⃣ **Smart Money Zones**
**Order Blocks:**
- Strong institutional areas where banks and hedge funds placed large orders
- **Bullish Order Block:** Area where smart money bought heavily before a strong upward move
- **Bearish Order Block:** Area where smart money sold heavily before a strong downward move
- **Visual:** Green/Red filled boxes with "Bull OB" or "Bear OB" labels
**Liquidity Sweeps:**
- Price breaks above recent high or below recent low, then quickly reverses
- This is a "stop hunt" - institutions triggering retail stops before moving in the real direction
- **Bullish Sweep:** Price dips below support, grabs stops, then reverses up
- **Bearish Sweep:** Price pops above resistance, grabs stops, then reverses down
- **Visual:** Triangle markers (green up = bullish, red down = bearish)
### 5️⃣ **Engulfing Pattern Recognition**
- **Bullish Engulfing:** Large green candle fully engulfs the previous red candle - shows strong buying pressure
- **Bearish Engulfing:** Large red candle fully engulfs the previous green candle - shows strong selling pressure
- **How we use it:** Confirmation signal when combined with other factors
- **Visual:** Small circles below/above candles
### 6️⃣ **Trend Bias Indicator**
- Dynamically calculates market bias based on price position relative to POC
- **Bullish:** Price > 0.2% above POC
- **Neutral:** Price within 0.2% of POC
- **Bearish:** Price > 0.2% below POC
- **Visual:** Label at top of chart showing current bias
---
## 📈 Entry Signal Logic
The strategy generates **LONG** and **SHORT** signals based on confluence of multiple factors:
### 🟢 LONG ENTRY CONDITIONS:
1. **POC Break:** Price crosses above POC from below + Trend Bias is Bullish
**OR**
2. **Support Bounce:** Price touches a lower wick cluster + Bullish Engulfing pattern forms
3. **Additional Filter:** Trend Bias must NOT be Bearish
### 🔴 SHORT ENTRY CONDITIONS:
1. **POC Break:** Price crosses below POC from above + Trend Bias is Bearish
**OR**
2. **Resistance Rejection:** Price touches an upper wick cluster + Bearish Engulfing pattern forms
3. **Additional Filter:** Trend Bias must NOT be Bullish
---
## 🎯 Risk Management
### Stop Loss:
- **Calculation:** 2 × ATR(14) from entry price
- **Logic:** Uses Average True Range to adapt to current market volatility
- **Example:** If ATR = 10 points, stop loss is 20 points away
### Take Profit:
- **Calculation:** 3 × ATR(14) from entry price
- **Risk:Reward Ratio:** 1:1.5 (risking 2 ATR to make 3 ATR)
- **Example:** If ATR = 10 points, take profit is 30 points away
### Position Sizing:
- **Default:** 2% of account equity per trade
- **Adjustable:** Can be modified in strategy settings
---
## ⚙️ Strategy Settings & Customization
### Volume Profile Settings:
- **Lookback Days:** How many days to analyze (default: 2)
- **Profile Rows:** Resolution of volume calculation (default: 24)
- **POC Distance Threshold:** Minimum distance from POC for "far from POC" status (default: 0.3%)
### Wick Cluster Settings:
- **Min Wicks for Cluster:** How many wicks needed to form a cluster (default: 3)
- **Lookback Bars:** How far back to search for wicks (default: 50)
- **Tolerance %:** How close wicks must be to cluster together (default: 0.15%)
### Session Settings:
- **London Session:** 08:00-16:00 (adjustable)
- **New York Session:** 13:30-20:00 (adjustable)
- **UTC Offset:** Timezone adjustment (default: +3)
### Smart Money Settings:
- **Order Block Lookback:** How far back to search for order blocks (default: 20)
- **Toggle On/Off:** Can enable/disable order blocks and liquidity sweeps independently
---
## 📊 Performance Metrics Display
The strategy includes a real-time **Information Table** (top-right corner) showing:
| Metric | Description |
|--------|-------------|
| **Trend Bias** | Current market direction (Bullish/Neutral/Bearish) |
| **POC Price** | Current Point of Control price level |
| **Distance from POC** | How far current price is from POC (%) |
| **ATR (14)** | Current volatility measurement |
| **High Wick Clusters** | Number of resistance clusters detected |
| **Low Wick Clusters** | Number of support clusters detected |
| **Current Signal** | Active signal (LONG/SHORT/None) |
---
## 🚨 Alert System
The strategy can send alerts for:
1. **LONG Signal Triggered** - When all conditions met for long entry
2. **SHORT Signal Triggered** - When all conditions met for short entry
3. **Price Touching Support Cluster** - Warning that price at key support
4. **Price Touching Resistance Cluster** - Warning that price at key resistance
**Alert Frequency:** Once per bar (prevents spam)
---
## 📅 Best Trading Timeframes & Instruments
### ✅ Recommended Timeframes:
- **Primary Entry:** 15-minute chart
- **Trend Confirmation:** 30-minute or 1-hour chart
- **Higher Timeframe Filter:** 4-hour for major trend direction
### ✅ Recommended Instruments:
1. **Gold (XAUUSD)** - High volatility, respects key levels well
2. **NAS100 (US Tech 100)** - Strong trends, good liquidity
3. **US30 (Dow Jones)** - Reliable institutional participation
4. **EUR/USD, GBP/USD** - Can work on major forex pairs with adjustments
### ⏰ Best Trading Sessions:
- **London Open (08:00-12:00 UTC+3)** - High volatility, clear directional moves
- **New York Open (13:30-17:00 UTC+3)** - Strongest moves, highest volume
- **Overlap (13:30-16:00 UTC+3)** - Best liquidity and movement
### ⚠️ Avoid Trading:
- Asian session (low volatility)
- Major news events (first 15 minutes after high-impact news)
- Sundays and holidays (low liquidity)
---
## 💡 Pro Trading Tips
### 1. **Multiple Timeframe Confirmation**
- Check 1-hour chart for overall trend before taking 15-minute signals
- Only take LONG signals if 1-hour is bullish
- Only take SHORT signals if 1-hour is bearish
### 2. **POC Strategy**
- Best entries occur when price returns to POC after being far away
- Wait for POC touch + confirmation pattern (engulfing, order block)
- POC acts as support in uptrends, resistance in downtrends
### 3. **Wick Cluster Strategy**
- Strongest signals occur when wick clusters align with POC
- Look for 4+ wicks at the same level for highest probability
- Recent clusters (formed in last 2 days) are stronger than old ones
### 4. **Order Block Strategy**
- Fresh order blocks (just formed) are more powerful
- Wait for price to return to order block zone before entering
- Best when order block + wick cluster occur at same level
### 5. **London/NY Box Strategy**
- If price breaks above session high → look for LONG pullback entries
- If price breaks below session low → look for SHORT pullback entries
- Price often returns to session mid-point before continuing
### 6. **Risk Management Rules**
- **Never risk more than 2% per trade**
- **Don't trade more than 3 positions simultaneously**
- **If 2 losses in a row, reduce size to 1% or stop for the day**
- **Move stop to breakeven after 1:1 profit reached**
### 7. **High-Probability Setups**
Look for **CONFLUENCE** - the more factors aligned, the better:
✅ **BEST LONG SETUP:**
- Price at lower wick cluster (support)
- Price at/near POC
- Bullish order block present
- Bullish engulfing pattern forms
- Trend Bias = Bullish
- 1-hour chart = uptrend
✅ **BEST SHORT SETUP:**
- Price at upper wick cluster (resistance)
- Price at/near POC
- Bearish order block present
- Bearish engulfing pattern forms
- Trend Bias = Bearish
- 1-hour chart = downtrend
---
## 📈 Performance Expectations
### Typical Win Rate:
- **Conservative Trading (high confluence only):** 55-65% win rate
- **Moderate Trading (good setups):** 45-55% win rate
- **Aggressive Trading (all signals):** 35-45% win rate
### Typical Risk:Reward:
- **Average R:R:** 1:1.5 (with 2 ATR stop and 3 ATR target)
- **Breakeven adjusted:** Often improves to 1:2+ when stop moved to BE
### Monthly Trade Frequency (15M chart):
- **Gold:** 60-100 signals per month
- **NAS100:** 50-80 signals per month
- **US30:** 40-70 signals per month
---
## 🎓 Strategy Philosophy Summary
The Hanzo Strategy is built on three core principles:
1. **Follow the Volume** - Trade where institutions are active
2. **Respect the Levels** - Key support/resistance zones matter
3. **Confirm with Price Action** - Wait for confirmation before entering
This is NOT a holy grail - it requires:
- ✅ Discipline to wait for proper setups
- ✅ Patience to let trades play out
- ✅ Risk management to protect capital
- ✅ Emotional control to handle losses
---
## 🛠️ How to Use This Strategy
### Step 1: Initial Setup
1. Add strategy to 15-minute chart
2. Check that all components are visible (POC, clusters, boxes, etc.)
3. Adjust colors if needed for your chart theme
### Step 2: Daily Routine
1. **Pre-Market (before 8:00 AM):**
- Check POC location
- Note wick clusters from previous days
- Mark London/NY session boxes from yesterday
2. **London Session (8:00-16:00):**
- Watch for POC interactions
- Monitor for order blocks forming
- Wait for confluence setups
3. **NY Session (13:30-20:00):**
- Highest activity period
- Best signal quality
- More aggressive entries allowed
### Step 3: Trade Execution
1. Wait for signal label (LONG or SHORT) to appear
2. Check confluence factors (minimum 3)
3. Enter immediately or on next candle
4. Set stop loss at 2 × ATR from entry
5. Set take profit at 3 × ATR from entry
6. Move stop to breakeven at +1.5 ATR profit
### Step 4: Trade Management
- **Don't move stop closer** (let trade breathe)
- **Can trail stop** after 2:1 profit reached
- **Can take partial profits** at 1.5:1 and let rest run
- **Journal every trade** for future improvement
---
## ⚠️ Important Disclaimers
1. **Past performance does not guarantee future results**
2. **This strategy involves risk** - only trade with money you can afford to lose
3. **Backtest thoroughly** on your specific instruments before live trading
4. **Start small** - test with minimum position sizes first
5. **Market conditions change** - what works today may not work tomorrow
6. **Use proper risk management** - this is the #1 key to long-term success
---
## 🎯 Quick Reference Checklist
Before taking any trade, ask yourself:
- ✅ Is there a clear LONG or SHORT signal?
- ✅ Are we in London or NY session?
- ✅ Is price at/near POC or wick cluster?
- ✅ Is trend bias aligned with my direction?
- ✅ Is there an order block or engulfing pattern?
- ✅ Is my risk:reward at least 1:1.5?
- ✅ Am I risking no more than 2% of my account?
**If 5+ are YES → Take the trade!**
**If 3 or fewer YES → Skip and wait for better setup!**
---
## 🚀 Final Words
The Hanzo Strategy is a professional-grade trading system that combines institutional analysis with precise technical execution. Success comes not from taking every signal, but from taking only the **highest probability setups** with proper risk management.
**Trade smart. Trade safe. Trade like an institution.**
📊 **Good luck and profitable trading!** 📊

Mustang Algo - Momentum Trend Zone Backtest🐎 MUSTANG ALGO - Momentum Trend Zone Strategy
A complete trading system combining MACD momentum analysis with visual trend zones, full backtesting capabilities, and advanced risk management tools.
══════════════════════════════════════════════════════════════════════════
🔹 OVERVIEW
Mustang Algo transforms traditional MACD analysis into a powerful visual trading system. It instantly identifies market bias through colored background zones and provides clear entry/exit signals with customizable stop loss and take profit management.
══════════════════════════════════════════════════════════════════════════
🔹 KEY FEATURES
✅ Visual Trend Zones (Green = Bullish | Red = Bearish)
✅ Clear Buy/Sell Triangles on Chart
✅ Full Backtesting Engine
✅ Multiple Stop Loss Types
✅ Multiple Take Profit Types
✅ Trailing Stop Option
✅ Time Filter for Backtesting
✅ Real-time Info Panel
✅ Customizable Alerts
══════════════════════════════════════════════════════════════════════════
🔹 HOW IT WORKS
The strategy uses a smoothed MACD system to detect trend changes:
- MACD Line (White): Fast EMA minus Slow EMA - shows raw momentum
- Signal Line (Yellow): EMA of MACD - shows smoothed trend direction
- Trend Zone: Changes when the smoothed signal line crosses zero
- Entry Signals: Generated at zone transitions
When the trend line crosses above zero → GREEN zone → BUY signal 🔺
When the trend line crosses below zero → RED zone → SELL signal 🔻
══════════════════════════════════════════════════════════════════════════
🔹 STOP LOSS OPTIONS
🛑 Percentage: Fixed percentage from entry price
🛑 ATR-Based: Dynamic SL based on market volatility
🛑 Fixed Points: Set number of points/pips
🛑 Swing Low/High: Uses recent swing levels as stops
══════════════════════════════════════════════════════════════════════════
🔹 TAKE PROFIT OPTIONS
🎯 Percentage: Fixed percentage target
🎯 ATR-Based: Dynamic TP based on volatility
🎯 Fixed Points: Set number of points/pips
🎯 Risk Reward: Automatic TP based on R:R ratio (e.g., 2:1, 3:1)
══════════════════════════════════════════════════════════════════════════
🔹 TRAILING STOP
📈 Percentage-Based: Trail by a fixed percentage
📈 ATR-Based: Trail using ATR multiplier for dynamic adjustment
══════════════════════════════════════════════════════════════════════════
🔹 SETTINGS
MACD Parameters:
- Fast Length (default: 12)
- Slow Length (default: 26)
- Signal Length (default: 9)
- Trend Smoothing (default: 5)
Risk Management:
- Enable/Disable Stop Loss
- Enable/Disable Take Profit
- Enable/Disable Trailing Stop
- Customize all SL/TP parameters
Visual Options:
- Show/Hide Buy/Sell Triangles
- Show/Hide SL/TP Lines
- Show/Hide Labels
Time Filter:
- Set Start Date for backtest
- Set End Date for backtest
══════════════════════════════════════════════════════════════════════════
🔹 SIGNALS EXPLAINED
🟢 GREEN TRIANGLE (Below Bar):
Bullish zone detected - Consider LONG entry
🔴 RED TRIANGLE (Above Bar):
Bearish zone detected - Consider SHORT entry
🟢 GREEN BACKGROUND:
Currently in bullish trend zone
🔴 RED BACKGROUND:
Currently in bearish trend zone
══════════════════════════════════════════════════════════════════════════
🔹 INFO PANEL
The real-time info panel (top right) displays:
- Current Trend Zone status
- MACD value
- Signal Line value
- Active SL Type
- Active TP Type
══════════════════════════════════════════════════════════════════════════
🔹 ALERTS
Set up alerts for:
🔔 Buy Signals: "🐎 Mustang Algo: BUY Signal on {ticker} at {price}"
🔔 Sell Signals: "🐎 Mustang Algo: SELL Signal on {ticker} at {price}"
══════════════════════════════════════════════════════════════════════════
🔹 BEST PRACTICES
1. Use higher timeframes (1H, 4H, Daily) for more reliable signals
2. Combine with price action and support/resistance levels
3. Adjust ATR multipliers based on asset volatility
4. Use Risk Reward ratio for consistent risk management
5. Backtest on your preferred asset before live trading
══════════════════════════════════════════════════════════════════════════
🔹 RECOMMENDED TIMEFRAMES
⏱️ Scalping: 5M, 15M (more signals, more noise)
⏱️ Day Trading: 1H, 4H (balanced signals)
⏱️ Swing Trading: Daily, Weekly (fewer but stronger signals)
══════════════════════════════════════════════════════════════════════════
🔹 MARKETS
Works on all markets:
📈 Forex
📈 Crypto
📈 Stocks
📈 Indices
📈 Commodities
📈 Futures
══════════════════════════════════════════════════════════════════════════
🐎 RIDE THE TREND WITH MUSTANG ALGO!
══════════════════════════════════════════════════════════════════════════
⚠️ DISCLAIMER
This indicator/strategy is for educational and informational purposes only. It is not financial advice. Trading involves substantial risk of loss and is not suitable for all investors. Past performance is not indicative of future results. Always use proper risk management, do your own research, and consider consulting a financial advisor before making any trading decisions. Use at your own risk.
══════════════════════════════════════════════════════════════════════════
📝 VERSION HISTORY
v1.0 - Initial Release
- MACD-based trend detection
- Visual trend zones
- Multiple SL/TP options
- Full backtesting support
- Trailing stop functionality
- Time filter
- Info panel
- Alert system
══════════════════════════════════════════════════════════════════════════
💬 FEEDBACK
If you find this strategy useful, please leave a comment or suggestion!
Your feedback helps improve future updates.
🐎 Happy Trading!

AlosAlgo V2 (BETA)— V2 BETA —
V2 – 2025-11-21 (Update)
• Rebuilt the core signal engine to remove repainting – higher-timeframe Heikin Ashi / Renko now use confirmed bars only for more stable signals & alerts.
• Added Trend Filter MA so longs are only taken above the MA and shorts only below (optional).
• Added MACD momentum filter and Price Action filter (Higher Low for longs, Lower High for shorts) to cut a lot of chop.
• Introduced a loss-streak “circuit breaker” – after X consecutive losing trades the strategy pauses for a set number of bars.
• New TP/SL engine with 2 modes: ATR-based or Fixed % moves, with 4 staged TPs plus an optional runner and break-even SL after TP2.
• Cleaned up TP/SL lines & labels so levels are fixed per trade and easier to read.
• General refactor for more realistic backtests, better live behaviour and easier parameter tuning compared to V1.
ABOUT
AlosAlgo V2 is a multi-timeframe trend + momentum strategy designed for BTC and other high-liquidity markets. It takes directional bias from a higher timeframe, then filters that bias with volatility, momentum and simple price-action structure before it ever opens a trade.
Purely rule-based, no AI / Bayesian / ML.
Core idea
– Use higher-timeframe structure for direction.
– Only trade when trend, momentum and basic price action agree.
– Manage exits with multiple TPs, an optional runner and a hard SL so risk is defined from the start.
Setups
Two main engines:
• Open/Close – Higher-timeframe Heikin Ashi body direction (close vs open) as the core trend signal.
• Renko – ATR-based Renko feed with EMA cross (fast vs slow) as the core trend signal.
Classic sideways filters (ATR + RSI) can be layered on top if you want to only trade in trending or ranging conditions.
Filters added in V2
• Trend Filter MA – Longs only above the MA, shorts only below (length configurable).
• Momentum Filter – Optional MACD filter; only takes longs when MACD is bullish and shorts when MACD is bearish.
• Price Action Filter – Optional HL/LH logic using pivots: longs after a Higher Low, shorts after a Lower High.
• Loss-Streak Circuit Breaker – After N losing trades in a row, the strategy pauses entries for a set number of bars to avoid bad regimes / tilt.
Risk & exits
Two TP/SL modes:
• ATR mode – SL and TP1–TP4 based on ATR at entry (stopFactor / profitFactor).
• Fixed % mode – SL and TP1–TP4 defined as % moves from entry.
On entry the strategy:
• Opens a single position.
• Places 4 staged TPs (TP1–TP4) with user-defined % sizing.
• Optionally leaves a “runner” managed only by SL and trend changes.
• Can move SL to break-even automatically after TP2 (toggle).
All TP/SL levels are locked at entry and drawn on the chart with labels so you can see exactly what the trade is trying to do.
Non-repainting behaviour
V2 is refactored to avoid the repainting behaviour that V1 used. Higher-timeframe and Renko data are taken from confirmed bars only, and entries are based on state (e.g. > / <) instead of repaint-prone crosses. Backtests are much closer to what you’ll see live, and alerts line up with executed trades more reliably.
How to use (suggested defaults)
• Setup: Open/Close
• TPSType: Fixed %
• Trend Filter: ON
• Momentum Filter: ON
• Price Action Filter: ON
• Sideways Filter: No Filtering
Then tweak TP/SL distances and filters per asset + timeframe, and forward-test before sizing up.
Disclaimer
This is not financial advice, not a guarantee of profit and not a “set and forget” money printer. Always forward-test, paper trade and tune risk before using real capital or automation. Markets change – this is a tool, not a promise.