QuantCat Mom Finder Strategy (1H)QuantCat Momentum Finder Strategy
This strategy is designed to be used on the 1 hour time frame, on all x/btc pairs.
The beautiful thing is it plots the take profit, and stoploss for you for each entry- where I would say use the stoploss for sure and feel with water with how the price action is looking when in profit.
In this strategy, I actually implemented my own trading style into building the strategy. Having to replicate my own trading strategy into an algorithm, I can't make it exactly perfect to how I would trade, but what I can do is try and program the parameters that give it the absolute best chance of making a big move with a small drawdown- which replicates part of my momentum trading style. Here I am using RSI, MACD, EMA and trend filtering values to find moments where there has been a momentum change to play the rest of the move. It only picks the best entries.
There is always a 3-4 R/R move on average with with these trades, meaning 1 in 4 only need to hit to be a break even trader- where most of these strategies have about 35% hit rate.
The stoploss is so crucial to minimise any damage from huge unexpected candles, the strategies can just be used for entries as well, you don't have to stick to the exact formula- of the long and short system, but this by itself is profitable.
The system nets positive results on
-ETH/BTC
-LTC/BTC
-XRP/BTC
-ADA/BTC
-NEO/BTC etc.
We also have a free 15M strategy available too.
You can join our discord server to get live alerts for the strategy as well as speak to our devs! Link in signature below!!!
Recherche dans les scripts pour "algo"

Odin's Kraken (TK Cross Strategy)A simple, yet profitable, trend following system based on 1 hour TK Crosses and ADX.
Works best on ETH/BTC, but is also profitable on other large-cap altcoin BTC pairs (ADA/BTC, EOS/BTC, and TRX/BTC ).
I'm still just getting started in the algo trading world, but if you have any questions I am more than happy to answer them in the comment section here or on Twitter (@pascaltmn).
Cheers.

Global Market Signals: Is the Trend Your Friend? AlgorithmWelcome!
This is a fully customizable strategy to help generate great trade signals as well as provide basic analysis on any market of your choice. All the trades occur at the open of a candle.
Settings:
1. Long or Short
2. Look back length
3. New Highs or New Lows?
4. Trade Duration
5. Trend SMA Length
6. Above or Below Trend SMA
Example:
Using a Daily SPY chart.
The Default Settings are:
1. Long
2. 10
3. New Lows
4. 5
5. 200
6. Above
What this means is that you will be going long when there is a new 10 day lowest close, you'll hold the trade for 5 days, and the trades only occur above the 200 day simple moving average.
**When you test your settings, make sure that in the Properties tab, you have the "Order Size" set at 100 and in the drop down menu to the right, make sure "% of equity" is selected.**

QuantCat 1H Momentum Strategy [Crypto]**NOTE: IF YOU DO NOT OWN TRADINGVIEW PRO YOUR STRATEGIES WILL TAKE DATA FROM A SMALLER SAMPLE SIZE, AND THUS GIVE LESS ACCURATE BACKTESTING RESULTS TO THE ONES WE SHOW (LINKS WITH STEP 3) AND OPTIMISED OUR STRATEGIES WITH**
QuantCat 15M Crypto Trend Strategy
This strategy will allow you to absolutely smash the Crypto/BTC pairs with a high hit rate and incredible risk/reward. We have optimised this strategy to work best for the x/BTC pairs on the 1H minute time frame. There are 7 pairs that we optimised the strategy to work for. There are a few main steps are as follows to use the strategy in it's most efficient manner-
1. Recommended % of equity per trade = 10-50%.
2. 1H Minute time frame needs to be applied (obvious, we know).
3. Pairs we used to optimise and backtest the strategy should ideally be used when using the strategy-
ETH/BTC - prntscr.com
XRP/BTC - prntscr.com
LTC/BTC - prntscr.com
BNB/BTC - prntscr.com
ADA/BTC - prntscr.com
NEO/BTC - prntscr.com
EOS/BTC - prntscr.com
We have a list of Visual and Technical features that are implemented into our strategy to make sure it is easy to use, consistent and giving it the highest chance of being profitable.
Visual Features
Colored Candles- aesthetics to notify you of an alert.
Stop Loss Horizontal Line- a red line to show you where the stop-loss has been placed.
Take Profit Line- horizontal line to show your where you take profits
Technical Features
Trend filtering- Our algorithm prevents signals being created in sideways periods to mitigate the chance of fake outs and larger run ups.
Momentum confirmation- Every time a position is entered; strict conditions have been met to maximize the chance of predicting the right move.
If you have discord alerts access, be sure to watch out in the discord for entries!

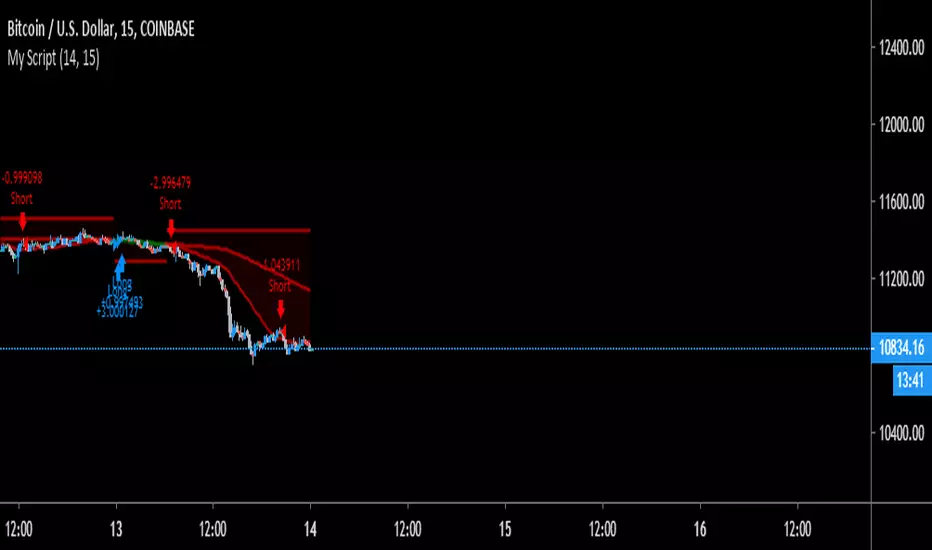
QuantCat 15M Trend Strategy [Crypto]**NOTE: IF YOU DO NOT OWN TRADINGVIEW PRO YOUR STRATEGIES WILL TAKE DATA FROM A SMALLER SAMPLE SIZE, AND THUS GIVE LESS ACCURATE BACKTESTING RESULTS TO THE ONES WE SHOW (LINKS WITH STEP 3) AND OPTIMISED OUR STRATEGIES WITH**
QuantCat 15M Crypto Trend Strategy
This strategy will allow you to absolutely smash the Crypto/USD pairs. We have optimised this strategy to work best for the Crypto/USD pairs on the 15 minute time frame. There are 4 pairs that we optimised the strategy to work for. There are a few main steps are as follows to use the strategy in it's most efficient manner-
1. Pyramiding orders needs to be set to 2 for maximum efficiency of the strategy due to aggressive and conservative entries, recommended % of equity per trade = 10-50%.
2. 15 Minute time frame needs to be applied (obvious, we know).
3. Pairs we used to optimise and backtest the strategy should ideally be used when using the strategy-
BTC/USD - prntscr.com
LTC/USD - prntscr.com
BCH/USD - prntscr.com
ETH/BTC - prntscr.com
XRP/BTC - prntscr.com
LTC/BTC - prntscr.com
We have a list of Visual and Technical features that are implemented into our strategy to make sure it is easy to use, consistent and giving it the highest chance of being profitable.
Visual Features
Colored candles- a visual to notification of an entry.
Stop-loss line- a horizontal red line to show the user where the stop-loss has been placed. Our testing proved a horizontal stop was more profitable than implementation of a trailing.
Price Bands- a dynamic price band to show the direction of the trend and support zones.
Technical Features
Trend Confirmation- Our algorithm fires entries only on trend confirmation and looks to trade the move for as long as it can, while also filtering out any false entries.
Aggressive and Conservative Entries- Two different types of entries have been incorporated in the strategy to maximise profit.
If you have discord alerts access, be sure to watch out in the discord for entries!

QuantCat 15M Crypto Trend StrategyQuantCat 15M Crypto Trend Strategy
This strategy will allow you to absolutely smash the Crypto/USD pairs. We have optimised this strategy to work best for the Crypto/USD pairs on the 15 minute time frame. There are 4 pairs that we optimised the strategy to work for. There are a few main steps are as follows to use the strategy in it's most efficient manner-
1. Pyramiding orders needs to be set to 2 for maximum efficiency of the strategy.
2. 15 Minute timeframe needs to be applied (obvious, we know)
3. Pairs we used to optimise and backtest the strategy should ideally be used when using the strategy-
BTC/USD
ETH/USD
LTC/USD
BCH/USD
We have a list of Visual and Technical features that are implemented into our strategy to make sure it is easy to use, consistent and giving it the highest chance of being profitable.
Visual Features
Colored candles- a visual to notification of an entry.
Stop-loss line- a horizontal red line to show the user where the stop-loss has been placed. Our testing proved a horizontal stop was more profitable than implementation of a trailing.
Price Bands- a dynamic price band to show the direction of the trend and support zones.
Technical Features
Trend Confirmation- Our algorithm fires entries only on trend confirmation and looks to trade the move for as long as it can, while also filtering out any false entries.
Aggressive and Conservative Entries- Two different types of entries have been incorporated in the strategy to maximise profit.
If you have discord alerts access, be sure to watch out in the discord for entries!
2-Period RSI strategy (with filter)2-period RSI strategy backtest described in several books of the trader Larry Connors . This strategy uses a 2 periods RSI , one slow arithmetic moving average and one fast arithmetic moving average.
Entry signal:
- RSI 2 value below oversold level (Larry Connors usually sets oversold to be below 5, but other authors prefer to work below 10 due to the higher number of signals).
- Closing above the slow average (200 periods).
- Entry at closing of candle or opening of next candle.
Exit signal:
- Occurs when the candlestick closes above the fast average (the most common fast average is 5 periods, but some traders also suggest the 10 period average).
Entry Filter (modification made by me):
- Applied an RSI2 arithmetic moving average to smooth out oscillations.
- Entered only when RSI2 is below oversold level and RSI2 moving average is below 30.
* NOTE: In the stocks that I evaluate daily the averages of 4 and 6 periods work very well as a filter.
Comments:
This strategy works very well in Daily charts but can be applied in other chart times as well. As this is a strategy to catch market fluctuations, it presents different results with different stocks.
I have been applying this strategy to the stocks of the Brazilian market (BOVESPA) and have enjoyed the result. Every day I evaluate the stocks that are generating entry signals and choose which one to trade based on the stocks with the highest Profit Value.
The RSI 2 averaging filter probably will reduce profit of the backtests because reduces the number of signals, but the Profit Value will usually increase. For me this was a good thing because without the filter, this strategy usually shows more signals than I have capital to allocate.
Before entering a trade I look at which fast average the paper has the highest Profit Value and then I use this average as my output signal for that trade (this change has greatly improved the result of the outputs).
This strategy does not use Stop Loss because normally Stop Loss decreases effectiveness (profit). In any case, the option to apply a percentage Stop Loss if desired is added in the script. As the strategy does not use stop, extra caution with risk management is advisable. I advise not to allocate more than 20% of the trade capital in the same operation.
I'm still studying ways to improve this strategy, but so far this is the best setup I've found. Suggestions are always welcome and we can test to see if they improve the backtest result.
Good luck and good trades.
================================================
Backtest das estratégia do IFR de 2 períodos descrita em varios livros do trader Larry Connors . Esta estratégia usa um IFR de 2 períodos, uma média movel aritmética lenta e uma média movel aritmética rápida.
Sinal de entrada:
- Valor do IFR 2 abaixo do nível de sobrevenda (Larry Connors usualmente define sobrevenda sendo abaixo de 5, mas outros autores preferem trabalhar abaixo de 10 devido ao maior número de sinais).
- Fechamento acima da média lenta (200 períodos).
- Realizado a compra no fechamento do candle ou na abertura do candle seguinte.
Sinal de saída:
- Ocorre quando o candle fecha acima da média rápida (a média rápida mais comum é a de 5 períodos, mas alguns traders sugerem também a média de 10 períodos).
Filtro para entrada (modificação feita por mim):
- Aplicado uma média móvel aritmética do IFR2 para suavisar as oscilações.
- Realizado a entrada apenas quando o IFR2 está abaixo do nível de sobrevenda e a média móvel do IFR2 está abaixo de 30.
*OBS: nos ativos que avalio diariamente as médias de 4 e 6 períodos funcionam muito bem como filtro.
Comentários:
Esta estratégia funciona muito bem no tempo gráfico Diário mas pode ser aplicada tambem em outros tempos gráficos. Como trata-se de uma estratégia para pegar oscilações do mercado, ela apresenta diferentes resultados com diferentes ativos.
Eu venho aplicando esta estratégia nos ativos do mercado brasileiro (BOVESPA) e tenho gostado do resultado. Diariamente eu avalio os papeis que estão gerando entrada e escolho qual irei realizar o trade baseado nos papeis que apresentam maior Profit Value.
O filtro da média do IFR 2 reduz o lucro nos backtests pois reduz também a quantidade de sinais, mas em compensação o Profit Value irá normalmente aumentar. Para mim isto foi algo positivo pois, sem o filtro, normalmente esta estratégia apresenta mais sinais do que possuo capital para alocar.
Antes de entrar em um trade eu olho em qual média rápida o papel apresenta maior Profit Value e então eu utilizo está média como meu sinal de saída para aquele trade (esta mudança tem melhorado bastante o resultado das saídas).
Está estratégia não utiliza Stop Loss pois normalmente o Stop Loss diminui a eficácia (lucro). De qualquer maneira, foi acrescentado no script a opção de aplicar um Stop Loss percentual caso seja desejado. Como a estratégia não utiliza stop é aconselhável um cuidado redobrado com o gerenciamento de risco. Eu aconselho não alocar mais de 20% do capital de trade em uma mesma operação.
Ainda estou estudando formas de melhorar esta estratégia, mas até o momento está é a melhor configuração que encontrei. Sugestões são sempre bem vindas e podemos testar para verificar se melhoram o resultado do backtest.
Boa sorte e bons trades.

Volty Expan Close StrategyVolty Expan Close Strategy, didnt really do anything except for change the parameters, would like to use a genetic algo to find the best params but i will leave it like this.


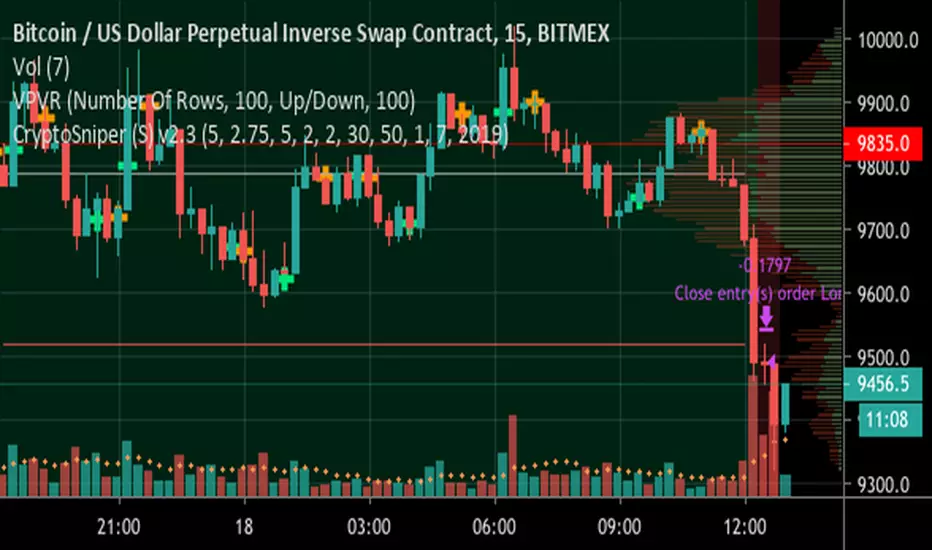
ck - CryptoSniper (Strategy) v2.1This strategy is radically different to the v1 script previously released.
It has ***NO REPAINTING*** - as such the algorithm had to change to remove it’s reliance on HMAs from future timeframes to establish trend, this is now accomplished with EMAs.
It is completely written in Pinescript v4.
It has integrated Stoploss and you can plot this & with the recommended Entry on the chart.
WARNING - This strategy has to be “tuned” to the instrument you are trading, for example, Bitcoin. The default settings work well for BTC/USD, XBT/USD on 15m chart timeframe but not for ETH/USD - it is possible the default settings will work with other crypto’s but I haven’t had time to test - if you find good settings PLEASE share them!
How to use:
1) Load up your favourite chart/instrument and select your favourite timeframe
2) Adjust the “signal” EMA and “baseline” EMA settings until you get the majority of uptrending moves highlighted with a green background and the majority of downtrending moves with a red background. The signal has to be faster (that is a lower number) than the baseline.
3) Adjust the “Sensitivity” - this will plot more green & orange Trigger points on the chart.
The strategy waits until in a trend, for example, a Long (green background) then waits for first green cross before opening a deal. It will Trigger a sell if the background turns red (downtrend) and a orange cross is printed.
4) Fine tuning:
A) Increase your profits by changing the Stoploss value - getting this right protects you from bad trades but also resets the indicator to provide another alert faster
B) You can increase the delay positions are opened or closed with the “Bar(s) offset to open position” and “Bar(s) offset to close position” settings. When you adjust these, 0 will buy/sell immediately when a Trigger cross is printed, 2 will wait until 2 bars/candles AFTER the Trigger cross prints to strat/close a position.
TIP: When adjusting indicator settings, load your chart and timeframe first.
Add the indicator/strategy (if you haven’t already).
Click the Strategy Tester tab at the bottom of the chart window so it is visible.
Open the strategy/indicator settings so you can see this wind AND the Strategy Tester display
Change a setting and click into a different setting input box, this will update the test results WITHOUT closing the settings window! This will save you a lot of time!
Write down any OK settings you find, you can come back later to fine tune them!
Please provide any feedback & let’s share the best settings for different crypto’s!
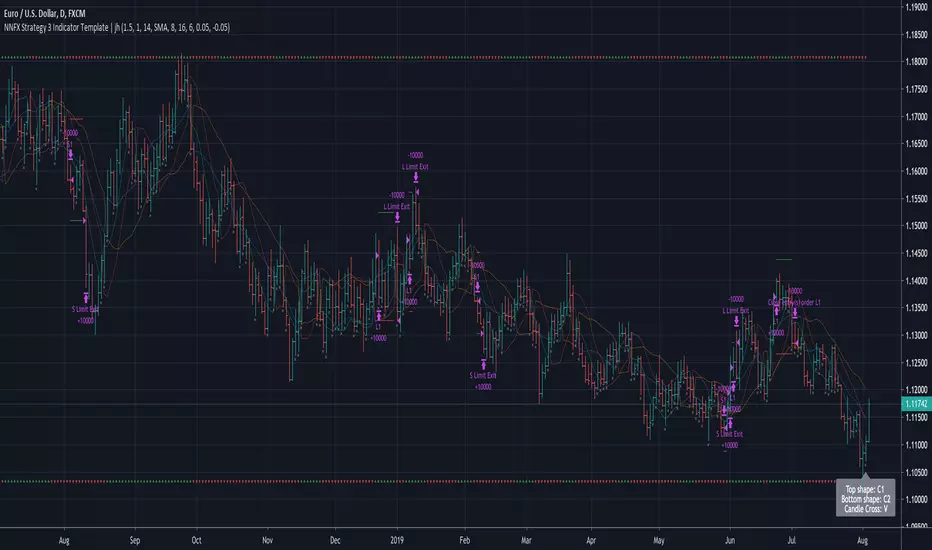
No Nonsense NNFX VP Strategy for Back Testing 3 x Indicators| jhAfter testing your individual indicators, it's time to build up your algo with additional indicators and further backtest the strategy.
Using SSL twice here, faster SSL for 1st confirmation, slower SSL for 2nd confirmation and TDFI for volume validation.

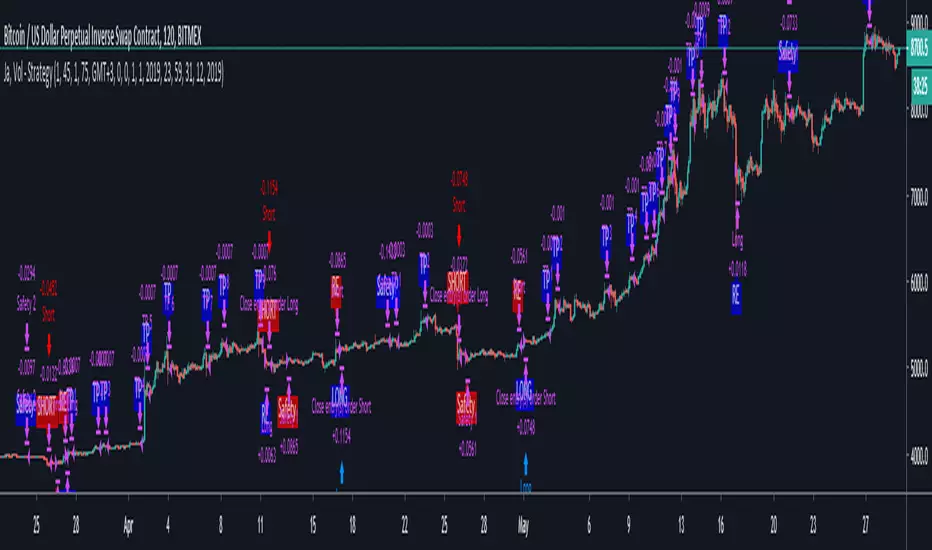
Ja, Vol - StrategyIncredibly sophisticated trading algorithm creates with non repaint take profit, re-entry and safety exit signals.


PerPro V7 V3 STOCK AND INDICESin this version Perpro V7 is only for trade indices and stock, the algorithm only send buy signal, the bes performance is in 1h time frame, 1 day and 1 w.
you need to find the best money management for stock or indices.


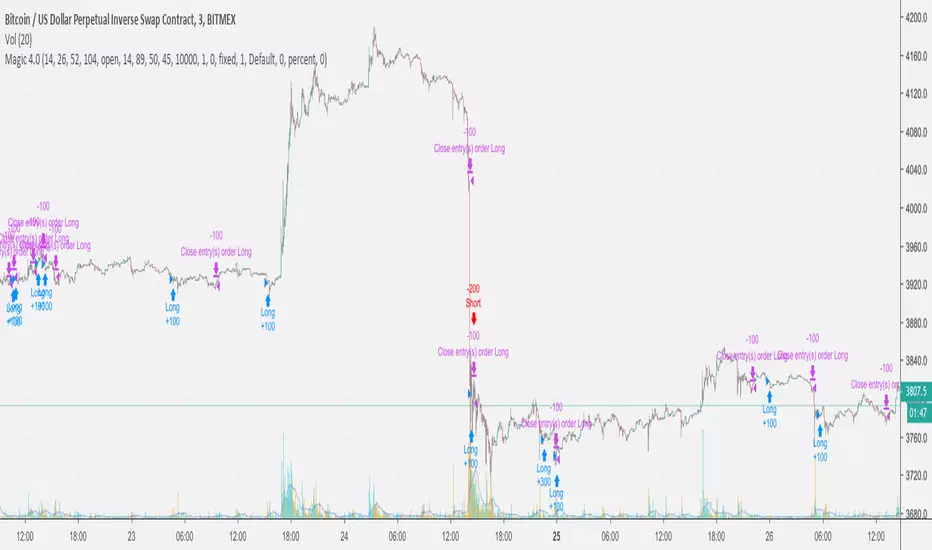
Magic 4.0 with Dynamic Stops [FINAL]The wait is over. I've ran countless simulations, stayed up days and days away slaving on this code and pulled rabbit out of the hat. This is the best of Magic I currently have to offer. It is protected by dynamic stop losses, allow it to countertrade strong trends -- but there's more. The algorithm switches to a long and short only strategy based on volatility , candle structure, volume , and ELAPSED TIME from previous impulse. Yes, there's a time component.
I was make a disclaimer here: This strategy is subscription-based; it is not open to the public, so if you're interested in making this a staple of your trading strategy and you're serious about it enough to invest a small amount to reap the benefits of my greatest work, send me a DM , and let's talk.
And by the way...
NO. IT DOES NOT REPAINT.
Sim-pe-Lyfe
FractalSqueezeRecommended; Range Bars / find the optimal hit rate between the 33R / 66R / 100R for individual securities or a combination of all 3.
Algorithm determines the geometric state of securities prices and is triggered by volatility expansion on multiple key scales in a unified direction. The unique advantage of this system is that the signal is capable of both strengthening on the long side in the face of negative price action and strengthening on the short side in the face of positive price action, to optimize the signal, trade the divergence of price and output value.

Hakimi - Decision Tree Based Strategy V.1This is a strategy based on Decision Tree (DT) algorithm which can be used as a Decision Support System (DSS).
How to use:
1- Select the Heikin Ashi chart.
2- select the strategy: "1=Long , 2=Short , 3=Long & Short".
3. Set the P value. Default value is 1000.
4- Enter Start time and End time
