ATR SL/TP Precision Zones (Dots)ATR SL/TP Precision Zones (Dots) is a volatility-based tool designed to help traders set accurate Stop Loss and Take Profit levels based on real market volatility — not fixed pips or emotion.
This indicator uses ATR (Average True Range) multiplied by 1.2 to calculate dynamic distance bands.
Instead of drawing a ribbon or channel, it places simple dots above and below each candle:
Upper Dot (Green) → Suggested Take Profit / Price Stretch Zone
Lower Dot (Red) → Suggested Stop Loss Cushion / Support Expansion Zone
Because ATR measures market volatility, these dots expand during high volatility and tighten during slow markets, helping traders avoid stop-loss hunts and premature exits.
Why This Works
Most traders lose because:
They set SL too close → stopped out by noise
They set TP too far → price never reaches it
This tool calibrates those distances automatically based on real price movement behavior.
ATR = volatility
Volatility = market breathing room
This indicator ensures your trade has room to breathe, increasing win consistency.
Best Use Cases
Scalping
Swing trading
Trend continuation entries
Reversal confirmations with support/resistance
Works on Crypto / Forex / Stocks / Futures
Recherche dans les scripts pour "atr"

PSAR with ATR Trailing Stop + SMA Filter📈 Strategy Overview: PSAR + 6×ATR Trailing Stop with SMA Filter
This strategy is built around the principle of “Cut the losers, let the winners run” — a disciplined, trend-following approach that combines the Parabolic SAR indicator with dynamic risk management and a Simple Moving Average (SMA) trend filter.
🔍 Strategy Logic
Trend Filter Trades are only taken in the direction of the prevailing trend, defined by a user-selected SMA (default: 100).
✅ Long trades only when price is above the SMA
✅ Short trades only when price is below the SMA
Entry Signal: A trade is triggered when the Parabolic SAR flips to the opposite side of the price bars, signaling a potential trend reversal.
Stop Loss: The stop loss is dynamically set at 6×ATR from the entry price. This adapts to market volatility and is recalculated every bar — effectively acting as a trailing stop.
Exit Logic: There is no fixed take profit. The trade remains open until the trailing stop is hit — allowing winners to run and losers to be cut quickly.
Risk Management: Each trade risks 0.5% of total equity, ensuring consistent position sizing and capital preservation.
📊 Visual Elements
PSAR dots mark trend direction changes
SMA line shows the broader trend filter
Trailing stop crosses (with 50% opacity) indicate the current stop level without cluttering the chart
⚙️ Customizable Inputs
PSAR parameters: Start, Increment, Maximum
ATR length and multiplier
SMA length
Risk percentage per trade
This strategy is ideal for traders who want to stay aligned with the trend, automate disciplined exits, and avoid emotional decision-making. Clean, simple, and powerful.
Wishing you calm and successful trades!

Vol-Pace Projected-ATR-ADX-Alert-MAThe VolSC indicator analyzes stock volume trends with a focus on the Pace metric, which projects today's volume as a percentage of the 30-day average, highlighting unusual activity (e.g., over 200% turns bright green with alerts). The phantom projection bar, a wide green histogram to the right of the last bar, visually represents this projected volume on daily charts only, aiding quick identification of potential volume surges without cluttering intraday or weekly views. Additional features include ADX strength, ATR averages, and customizable table display for comprehensive insights.
Key Features:
* Primary Indicator: Volume with ADX (Average Directional Index) text.
* Pacing and Alerts: Calculates the volume pace for the day. Features an unusual volume alert with an adjustable threshold (e.g., 200%).
* Volume Projection: Projects a visual "Phantom Volume" for the day, offset to the right of the actual volume bar.
* ATR Indicator: Displays the 2x ATR (Average True Range) value as text.
* Volume Average: Displays the ADV (Average Daily Volume) Moving Average as text.
* Customization: Most settings are adjustable.

MACD + RSI + EMA + BB + ATR Day Trading StrategyEntry Conditions and Signals
The strategy implements a multi-layered filtering approach to entry conditions, requiring alignment across technical indicators, timeframes, and market conditions .
Long Entry Requirements
Trend Filter: Fast EMA (9) must be above Slow EMA (21), price must be above Fast EMA, and higher timeframe must confirm uptrend
MACD Signal: MACD line crosses above signal line, indicating increasing bullish momentum
RSI Condition: RSI below 70 (not overbought) but above 40 (showing momentum)
Volume & Volatility: Current volume exceeds 1.2x 20-period average and ATR shows sufficient market movement
Time Filter: Trading occurs during optimal hours (9:30-11:30 AM ET) when market volatility is typically highest
Exit Strategies
The strategy employs multiple exit mechanisms to adapt to changing market conditions and protect profits :
Stop Loss Management
Initial Stop: Placed at 2.0x ATR from entry price, adapting to current market volatility
Trailing Stop: 1.5x ATR trailing stop that moves up (for longs) or down (for shorts) as price moves favorably
Time-Based Exits: All positions closed by end of trading day (4:00 PM ET) to avoid overnight risk
Best Practices for Implementation
Settings
Chart Setup: 5-minute timeframe for execution with 15-minute chart for trend confirmation
Session Times: Focus on 9:30-11:30 AM ET trading for highest volatility and opportunity

High-Low Breakout Strategy with ATR traling Stop LossThis script is a TradingView Pine Script strategy that implements a High-Low Breakout Strategy with ATR Trailing Stop.created by SK WEALTH GURU, Here’s a breakdown of its key components:
Features and Functionality
Custom Timeframe and High-Low Detection
Allows users to select a custom timeframe (default: 30 minutes) to detect high and low levels.
Tracks the high and low within a user-specified period (e.g., first 30 minutes of the session).
Draws horizontal lines for high and low, persisting for a specified number of days.
Trade Entry Conditions
Long Entry: If the closing price crosses above the recorded high.
Short Entry: If the closing price crosses below the recorded low.
The user can choose to trade Long, Short, or Both.
ATR-Based Trailing Stop & Risk Management
Uses Average True Range (ATR) with a multiplier (default: 3.5) to determine a dynamic trailing stop-loss.
Trades reset daily, ensuring a fresh start each day.
Trade Execution and Partial Profit Taking
Stop-loss: Default at 1% of entry price.
Partial profit: Books 50% of the position at 3% profit.
Max 2 trades per day: If the first trade hits stop-loss, the strategy allows one re-entry.
Intraday Exit Condition
All positions close at 3:15 PM to ensure no overnight risk.

RSI and ATR Trend Reversal SL/TPQuick History:
I was frustrated with a standard fixed percent TP/SL as they often were not receptive to quick market rallies/reversals. I developed this TP/SL and eventually made it into a full fledge strategy and found it did well enough to publish. This strategy can be used as a standalone or tacked onto another strategy as a TP/SL. It does function as both with a single line. This strategy has been tested with TSLA , AAPL, NVDA, on the 15 minutes timeframe.
HOW IT WORKS:
Inputs:
Length: Simple enough, it determines the length of the RSI and ATR used.
Multiplier: This multiplies the RSI and ATR calculation, more on this later.
Delay to prevent Idealization: TradingView will use the open of the bar the strategy triggers on when calculating the backtest. This can produce unrealistic results depending on the source. If your source is open, set to 0, if anything else, set to 1.
Minimum Difference: This is essentially a traditional SL/TP, it is borderline unnecessary, but if the other parameters are wacky this can be used to ensure the SL/TP. It multiplies the source by the percent, so if it is set to 10, the SL/TP is initialized at src +- 10%.
Source input: Self Explanatory, be sure to update the Delay if you use open.
CALCULATION:
Parameters Initialization:
The strategy uses Heikinashi values for calculations, this is not toggleable in parameters, but can be easily changed by changing hclose to equal src.
FUNCTION INITIALIZATION:
highest_custom and lowest_custom do the same thing as ta.highest and ta.lowest, however the built in ta library does not allow for var int input, so I had to create my own functions to be used here. I actually developed these years ago and have used them in almost every strategy since. Feel especially free to use these in your own scripts.
The rsilev is where the magic happens.
SL/TP min/max are initially calculated to be used later.
Then we begin by establishing variables.
BullGuy is used to determine the length since the last crossup or crossdown, until one happens, it returns na, breaking the function. BearGuy is used in all the calculations, and is the same as BullGuy, unless BullGuy is na, where BearGuy counts up from 1 on each bar from 0.
We create our rsi and have to modify the second one to suit the function. In the case of the upper band, we mirror the lower one. So if the RSI is 80, we want it to be 20 on the upper band.
the upper band and lower band are calculated the exact same way, but mirrored. For the purpose of writing, I'm going to talk about the lower band. Assume everything is mirrored for the upper one. It finds the highest source since the last crossup or crossdown. It then multiplies from 1 / the RSI, this means that a rapid RSI increase will increase the band dramatically, so it is able to capture quick rally/reversals. We add this to the atr to source ratio, as the general volatility is a massive factor to be included. We then multiply this number by our chosen amount, and subtract it from the highest source, creating the band.
We do this same process but mirrored with both bands and compared it to the source. If the source is above the lower band, it suggests an uptrend, so the lower band is outputted, and vice versa for the upper one.
PLOTTING:
We also determine the line color in the same manner as we do the trend direction.
STRATEGY:
We then use the source again, and if it crosses up or down relative to the selected band, we enter a long or short respectively.
This may not be the most superb independent strategy, but it can be very useful as a TP/SL for your chosen entry conditions, especially in volatile markets or tickers.
Thank you for taking the time to read, and please enjoy.

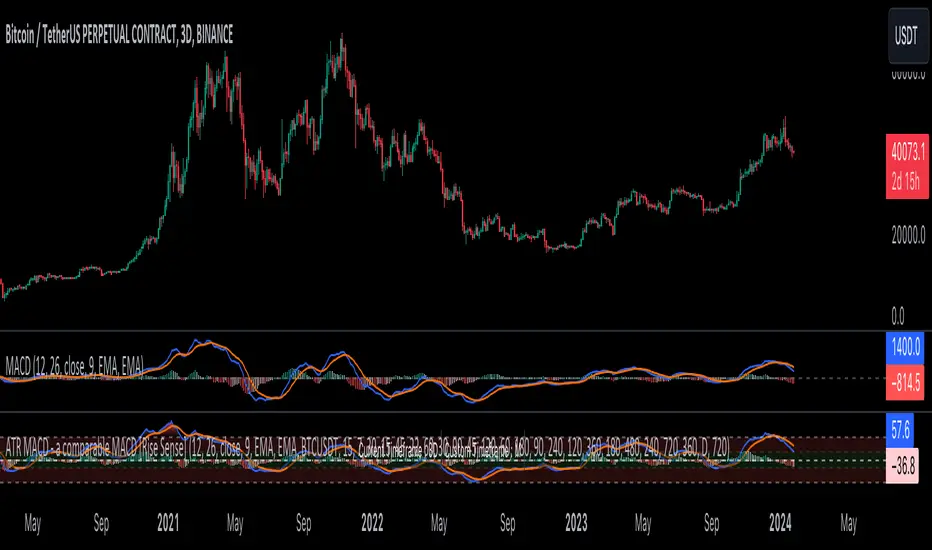
ATR MACD - a comparable MACD [Rise Sense]ATR MACD - a comparable MACD 是一位名为tonyblackwhite在知乎上发表的关于MACD的文章启发下制作的指标。这个指标克服了MACD在多个方面的痛点,例如时间变化、跨市场对比和MACD动量生命周期等问题。通过在基础上引入新功能,该指标不仅解决了这些问题,还使用户能够更轻松地比较不同时间级别和商品。
这一创新不仅提高了MACD的使用体验,而且为用户提供更便捷的获取所需信息的途径。通过解决原有MACD存在的限制,ATR MACD - a comparable MACD 为使用者提供了更为全面和灵活的分析工具,有望在MACD的应用中发挥更大的作用。
ATR MACD - a comparable MACD is an indicator created after reading an article on MACD by the author tonyblackwhite on Zhihu. This indicator overcomes various pain points of MACD, such as the MACD time change issue, cross-market MACD issue, MACD momentum lifecycle issue, and more. Building upon this foundation, it directly incorporates features that allow for comparing different timeframes and commodities, aiming to enhance users' experience in utilizing MACD and helping them effortlessly obtain desired information.
This innovation not only improves the user experience with MACD but also provides a more user-friendly way for users to compare different timeframes and commodities. By addressing the limitations of the original MACD, ATR MACD - a comparable MACD offers users a more comprehensive and flexible analytical tool, potentially playing a greater role in the application of MACD.
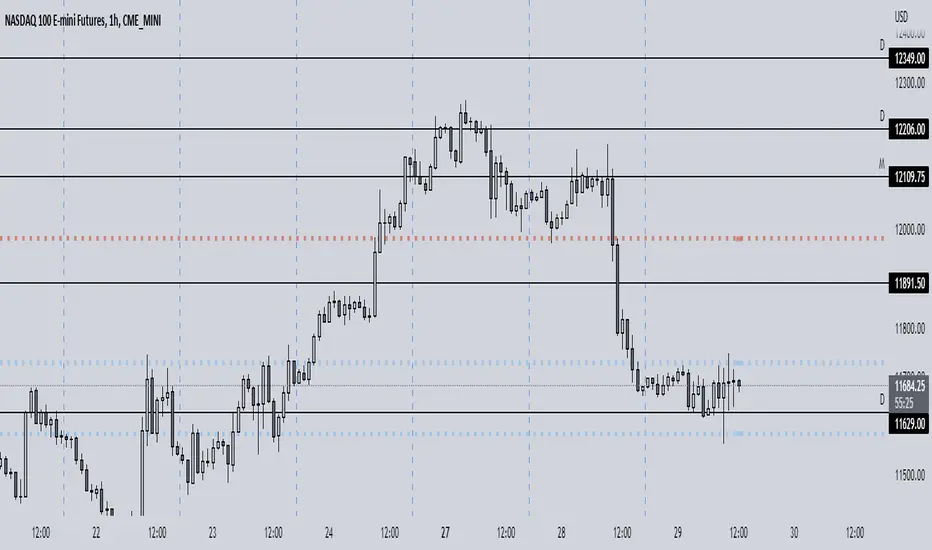
Price Legs: Average Heights; 'Smart ATR'Price Legs: Average Heights; 'Smart ATR'. Consol Range Gauge
~~ Indicator to show small and large price legs (based on short and long input pivot lengths), and calculating the average heights of these price legs; counting legs from user-input start time ~~
//Premise: Wanted to use this as something like a 'Smart ATR': where the average/typical range of a distinct & dynamic price leg could be calculated based on a user-input time interval (as opposed to standard ATR, which is simply the average range over a consistent repeating period, with no regard to market structure). My instinct is that this would be most useful for consolidated periods & range trading: giving the trader an idea of what the typical size of a price leg might be in the current market state (hence in the title, Consol Range gauge)
//Features & User inputs:
-Start time: confirm input when loading indicator by clicking on the chart. Then drag the vertical line to change start time easily.
-Large Legs (toggle on/off) and user-input pivot lookback/lookforward length (larger => larger legs)
-Small Legs (toggle on/off) and user-input pivot lookback/lookforward length (smaller => smaller legs)
-Display Stats table: toggle on/off: simple view- shows the averages of large (up & down), small (up & down), and combined (for each).
-Extended stats table: toggle on/off option to show the averages of the last 3 legs of each category (up/down/large/small/combined)
-Toggle on/off Time & Price chart text labels of price legs (time in mins/hours/days; price in $ or pips; auto assigned based on asset)
-Table position: user choice.
//Notes & tips:
-Using custom start time along with replay mode, you can select any arbitrary chunk of price for the purpose of backtesting.
-Play around with the pivot lookback lengths to find price legs most suitable to the current market regime (consolidating/trending; high volatility/ low volatility)
-Single bar price legs will never be counted: they must be at least 2 bars from H>>L or L>>H.
//Credits: Thanks to @crypto_juju for the idea of applying statistics to this simple price leg indicator.
Simple View: showing only the full averages (counting from Start time):
View showing ONLY the large legs, with Time & Price labels toggled ON:

ATR ChartATR Levels
Calculated by adding ATR to daily low and subtracting ATR from daily high.
Inputs can change ATR timeframe and range, defaults to 6 hr and daily.
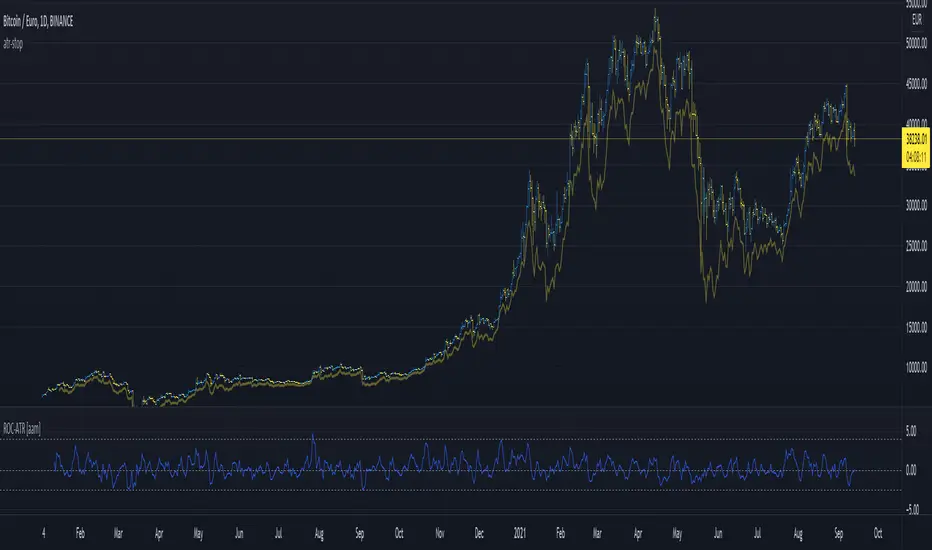
Rate Of Change ATRThis is a very basic, but powerful script.
It gives you the ratio between the rate of change of the last x days and the average true range of the last y days.
---> ROC-ATR Ratio = ROC/ATR
Therefore, you can see how much the price has moved relative to the prices in the past.
This is important because (in my opinion) the basic ROC indicator is not very meaningful if you don't look at the average volatility of recent history.
For example, a ROC of 5% over the last 3 days might be very high for Forex but very small for some crypto.
Consequently, this indicator makes it possible to compare (and be used on) every instrument in every industry the same way.
Generally speaking, it makes more sense if the ATR length is larger than the ROC length.
Roc & Atr
Roc & Atr Orders
My indicator, where I compare the 20 bar change percentage with the 14 bar atr band, I hope it will be useful to everyone. the green zones can be interpreted as BUY and the red zone as SELL zone. In graphs with high motion and low atr, the channel narrowing can be interpreted as BUY and the channel opening as SELL.
No indicator shows you the right way ... The best way is your own thoughts

Triple ATR multiplier - 3 ATR Values in OneHere you can choose to plot 3 different ATR values in 1 window. I use this indicator to get the values of my stop loss and take profits.
You can change the multiplier value for each ATR Line and the length of the base ATR.
Ty

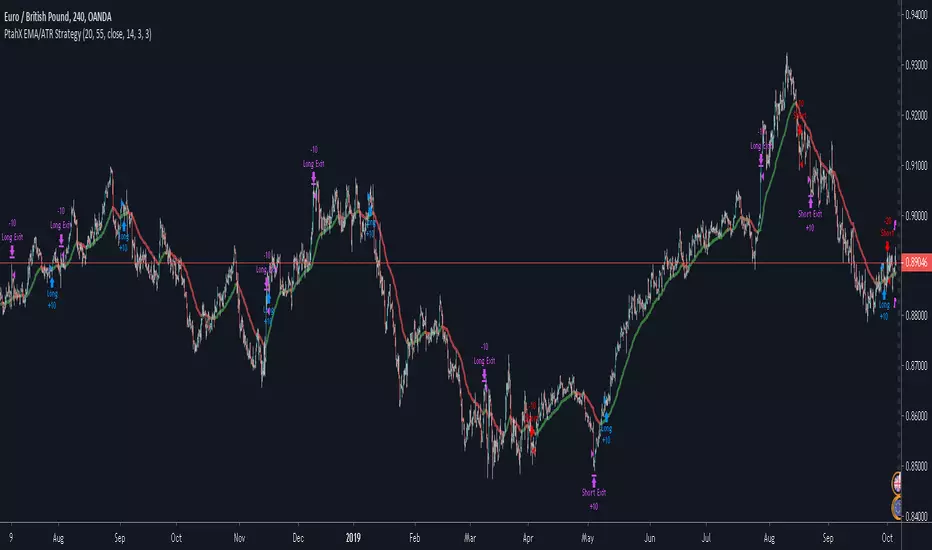
PtahX EMA/ATR StrategyPtahX EMA/ATR Strategy Public Release
written October 2019
EMA Strategy with ATR & "Fear Factor" built in
* modifications welcome
* please let me know if you improve it so I can continue to learn :)
* use at your own risk - I'm a new programmer and still learning
* Best of luck on your trades!!
// Take Profit (TP) option based on ATR or MA Crossover
Traded Range & True ATRBlack line = Trade Range from the last X periods.
Red Line = 61.8% of black line value.
Green bar = The current trade period range.
Default Value = 21 (21 days = I business month)
Generally speaking, a stock moves approximately the same value daily. Knowing the approximate value it likes to stay within calms the nerves when you see retracement of price occuring.
IE. Price average = 1.00 in a day. It move .75 within first hour then retraces in the opposite direction. There are still hours left in the trade day, so it is trading in its value range in order to not over extend itself.
This differs in calculation from the Wells Wilder version as it smooths out jumps and only examines the ranges between high and low.
A good rule of thumb is.
Stop Loss = Entry Price +/- (ATR * 1.5)
Take Profit = (1) Entry Price +/- ATR - 50% exit (Set Trailing Stop @ Entry Value), (2) Entry Price +/- ATR * 2 (50% of remaining).

Lancelot Band - ATR Reversal+Trending IndicatorThis is an indicator I created recently, with the mind of spotting where price might reverse and where the price is trending. You can see this as the primary indicator for your system, however, it is recommended you use this in conjunction with other confirmation indicators.
This script focus solely on ATR or Average True Range.
This indicator is the combination of the baseline from the Ichimoku cloud and the concept of the Keltner channel.
Baseline period = 14
ATR period = 14
ATR Mult = 1.5
For reversal
Long when price crossover Lower band & Stop loss at xLower band
Sell when price crossunder Upper band & Stop loss at xUpper band
For Trend Following
Long when price crossover xUpper band and Stop loss at Upper band
Short when price crossunder xLower band and Stop loss at Upper band
Again, you will need other indicators to help you to succeed in this system. This indicator will not generate the best exit for your position but will generate a good entry signal when you use it with both volume indicator and exit indicator.
Works well on BTCUSD XBTUSD, as well as other major liquid Pair.
Feel free to follow me on Twitter @Lancelot_Auger for more free Alpha.
Please acknowledge my effort by like and follow.
And lastly,
Save Hong Kong, the revolution of our times.

SUPERTREND ATR WITH TRAILING STOP LOSS## THIS SCRIPT IS ON GITHUB
## MORE BACKTEST
SuperTrend is a moving stop and reversal line based on the volatility (ATR).
The strategy will ride up your stop loss when price moviment 1%.
The strategy will close your operation when the market price crossed the stop loss.
The strategy will close operation when the line based on the volatility will crossed
The strategy has the following parameters:
+ **ATR PERIOD** - To select number of bars back to execute calculation
+ **ATR MULTPLIER** - To add a multplier factor on volatility
+ **INITIAL STOP LOSS** - Where can isert the value to first stop.
+ **POSITION TYPE** - Where can to select trade position.
+ **BACKTEST PERIOD** - To select range.
## DISCLAIMER
1. I am not licensed financial advisors or broker dealers. I do not tell you when or what to buy or sell. I developed this software which enables you execute manual or automated trades multiple trades using TradingView. The software allows you to set the criteria you want for entering and exiting trades.
2. Do not trade with money you cannot afford to lose.
3. I do not guarantee consistent profits or that anyone can make money with no effort. And I am not selling the holy grail.
4. Every system can have winning and losing streaks.
5. Money management plays a large role in the results of your trading. For example: lot size, account size, broker leverage, and broker margin call rules all have an effect on results. Also, your Take Profit and Stop Loss settings for individual pair trades and for overall account equity have a major impact on results. If you are new to trading and do not understand these items, then I recommend you seek education materials to further your knowledge.
**YOU NEED TO FIND AND USE THE TRADING SYSTEM THAT WORKS BEST FOR YOU AND YOUR TRADING TOLERANCE.**
**I HAVE PROVIDED NOTHING MORE THAN A TOOL WITH OPTIONS FOR YOU TO TRADE WITH THIS PROGRAM ON TRADINGVIEW.**
## NOTE
I accept suggestions to improve the script.
If you encounter any problems i will be happy to share with me.
+ Authors: @exit490
+ Revision: v1.0.0
+ Date: 5-Aug-2019
+ Pinescript version: 4
## LICENSE
Copyright 2019 Mauricio Pimenta / exit490
SuperTrend with Trailing Stop Loss script may be freely distributed under the (../LICENSE).

HMA ATR Range v2In Alan Hull's books he talks about his 'range indicator' which is the HMA and ATR to give buy / hold / sell signals.
It is the HMA with the ATR SL with the Trend and (ATR multiplier * Period) + HMA for the TP (upper range)

THAIT Moving Averages Tight within # ATR EMA SMA convergence
THAIT(tight) indicator is a powerful tool for identifying moving average convergence in price action. This indicator plots four user-defined moving averages (EMA or SMA). It highlights moments when the MAs converge within a user specified number of ATRs, adjusted by the 14-period ATR, signaling potential trend shifts or consolidation.
A convergence is flagged when MA1 is the maximum, the spread between MAs is tight, and the price is above MA1, excluding cases where the longest MA (MA4) is the highest. The indicator alerts and visually marks convergence zones with a shaded green background, making it ideal for traders seeking precise entry or exit points.

Vinicius Setup ATR
Description:
This script is a strategy based on the Supertrend indicator combined with volume analysis, candle strength, and RSI. Its goal is to identify potential entry points for buy and sell trades based on technical criteria, without promising profitability or guaranteed results.
Script Components:
Supertrend: Used as the main trend compass. When the trend is positive (direction = 1), buy signals are considered; when negative (direction = -1), sell signals are considered.
Volume: Entries are only validated if the volume is above the average of the last 20 candles, adjusted with a 1.2 multiplier.
Candle Body: The candle body must be larger than a certain percentage of the ATR, ensuring sufficient strength and volatility.
RSI: Used as a filter to avoid trades in extreme overbought or oversold zones.
Support and Resistance: Identified based on simple pivots (5 periods before and after).
Customizable Parameters:
ATR Length and Multiplier: Controls the sensitivity of the Supertrend.
RSI Period: Adjusts the relative strength filter.
Minimum Volume and Candle Body: Settings to validate entry signals.
Entry Conditions:
Buy: Positive trend + strong candle + high volume + RSI below 70.
Sell: Negative trend + strong candle + high volume + RSI above 30.
Exit Conditions:
The trade is closed upon the appearance of an opposite signal.
Notes:
This is a technical system with no profit guarantees.
It is recommended to test with realistic capital values and parameters suited to your risk management.
The script is not optimized for specific profitability, but rather to support study and the construction of setups with objective criteria.

ATR BeamsATR Beams is a simple indicator that utilizes the ATR to determine levels above and below price action that can serve as stop loss or trailing visual aids across all instruments.
This indicator is preset to an ATR value of 14 and a multiplier of 1 for the ATR.
Both of these parameters can be modified to your specific trading preference, the color and indicator line style can both also be modified to your visual preference.
I hope this provides you with a good visual aid

Visual ATR StopThis indicator uses the Average True Range (ATR) to display a visual range for stop placement. Two multiplier values (example, 1 and 3) can be set to create a filled area below the price. This area represents the range between the two ATR levels, adjusted by subtracting the current price, providing a simple way to visualize stop-loss placement based on volatility.
The indicator is customizable; for example, negative values can place the area above the price for short positions. The filled color can also be removed, which allows precise levels to be marked above and below.

TradePro's 2 EMA + Stoch RSI + ATR StrategySaw TradePro's "NEW BEST HIGHEST PROFITING STRATEGY WITH CRAZY RESULTS - 2 EMA+ Stochastic RSI+ ATR", and was curious on the back testing results. This strategy is an attempt to recreate it.
This strategy uses 50 / 200 EMAs, Stochastic RSI and ATR.
Long Entry Criteria:
- 50 EMA > 200 EMA
- Price closes below 50 EMA
- Stochastic RSI has gone into oversold < 20
- Stochastic RSI crosses up while making higher low from previous cross up
Short Entry Criteria:
- 50 EMA < 200 EMA
- Price closes above 50 EMA
- Stochastic RSI has gone into overbought > 80
- Stochastic RSI crosses down while making lower high from previous cross down
Stop-loss is set to ATR stop-loss
Take Profit is 2x the risk
All parameters are configurable.
Enjoy~~

Short vs Long ATRSimple pinescript that compares a long ATR against short ATR and let you define a threshold in %
