Alert-QuarryLake Indicator Map - ATR Trend Following Strategy A lot of times I don't like my chart crowding with indicators, thus the reason for creating this script for my strategy QuarryLake.
This script also comes with alert.
Below is the explanation for QuarryLake
I have also updated the script in version 4.
This strategy consists of 3 indicators that I found works quite well together.
Keltner Channel, Waddah Attah Explosion, and Volatility Stop.
You can find WAE here
KC Period = 200
KCATR = 5
Vstop Period = 3
Vstop Mult = 1.5
Long when close > KC, close > Vstop, WAE trendUp
Short when close < KC, close < Vstop, WAE trendDown
Works well on BTCUSD XBTUSD, as well as other major liquid Pair.
Feel free to follow me on Twitter @Lancelot_Auger for more free Alpha.
Please acknowledge my effort by like and follow.
And lastly,
Save Hong Kong, the revolution of our times.
Recherche dans les scripts pour "atr"

RSI ATR ChannelDraws a channel based on ATR (Average True Range) and RSI. Detects band touches and colors the background appropriately.

Powerfull strategy MACD + RSI + Stoch buy on High exit on ATRMy strategy uses a combination of three indicators MACD Stochastic RSI .
The Idea is to buy when ( MACD > Signal and RSI > 50 and Stochastic > 50) occures at the same time the BUY STop we place on previous day HIGH
We exit on Take profit or Stop loss which is calculated by ATR (10) or on the opposite signal "Volatility breakout"
This strategy works well on stocks, commodities and cryptos especially during market breaking up after consolidation
The best results are on Daily charts , so its NOT a scalping strategy. But it can work also on 1H charts.
The strategy does not have any stops and profit targets, so we can take all the market can give us at the moment.
The exit point only when MACD goes under Signal
Its Preformance is significantly better with "buy stop on High.1" idea and exit on "volatility price breakout"
So, use it, trade it.
If it will help you to imprive your trading results, please donate me
BTC: 12kd1F8buWisUBdq27BBwRkUvzW7Ey3og5

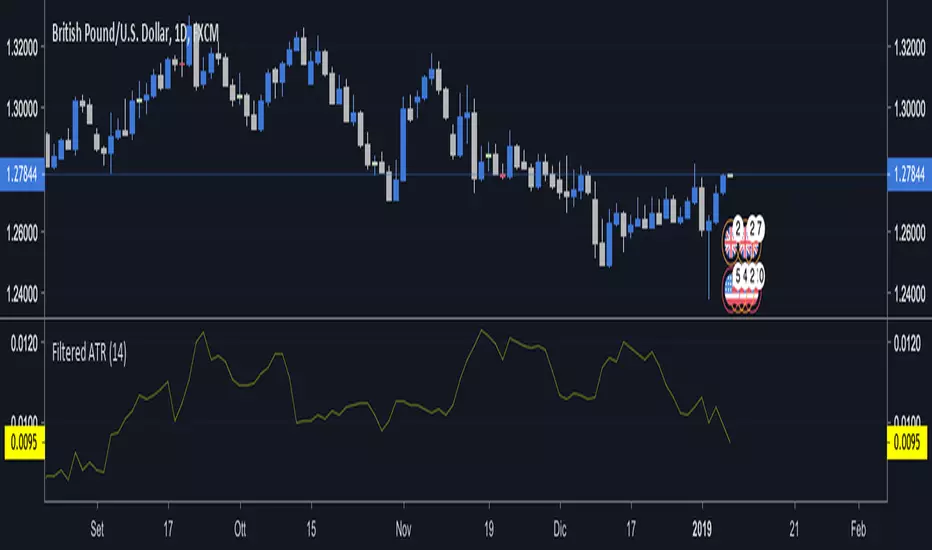
Filtered ATRThis script defines an average true range where extreme events are filtered out.
Extreme events are those bars with a true range larger than 3*sigma+average,
where average and standard deviation are estimated from the last 200 bars.
In this way the ATR is not altered by exceptional events (e.g. the flash crash of Jan 3rd 2019)
and can still be used safely for Stop Losses and Take Profits.
Hitting the like button is a free sign of gratitude, thanks.

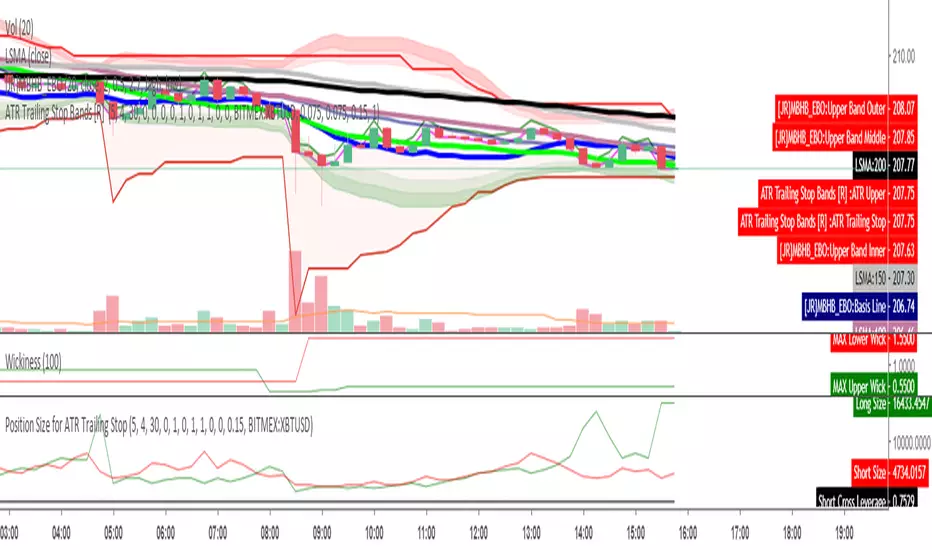
Position Size for ATR Trailing StopThis indicator will calculate your position size, short or long, based on the ATR Trailing Stop indicator of mine, and are needed to be used together. General risk management suggests risking just 1 percent of your equity and using low leverage.
CDC ATR Trailing Stop V1Based on the standard ATR trailing stop indicator.
A few minor tweaks as used in Chaloke.com's community

ET-ATR-Price-OverlayOverlays the Average True Range high/low over Price. Shifts between support and resistance levels (based on ATR-21) according to price trend and breaks.
Average true range: en.wikipedia.org
@EmpoweredTrader

[RS]Multiple ATR Analysis V1UPDATE:
• added a mean version of atr using fractional lengths (requested by IvanLabrie):
• uses slow length property for setup.
• added Average Dayly Range (ADR) (requested by IvanLabrie)
• uses fast length property for setup.
• added Average Weekly Range (AWR)
• uses fast length property for setup.
• added Average Monthly Range (AMR)
• uses fast length property for setup.
• added Average Yearly Range (AYR)
• uses fast length property for setup.

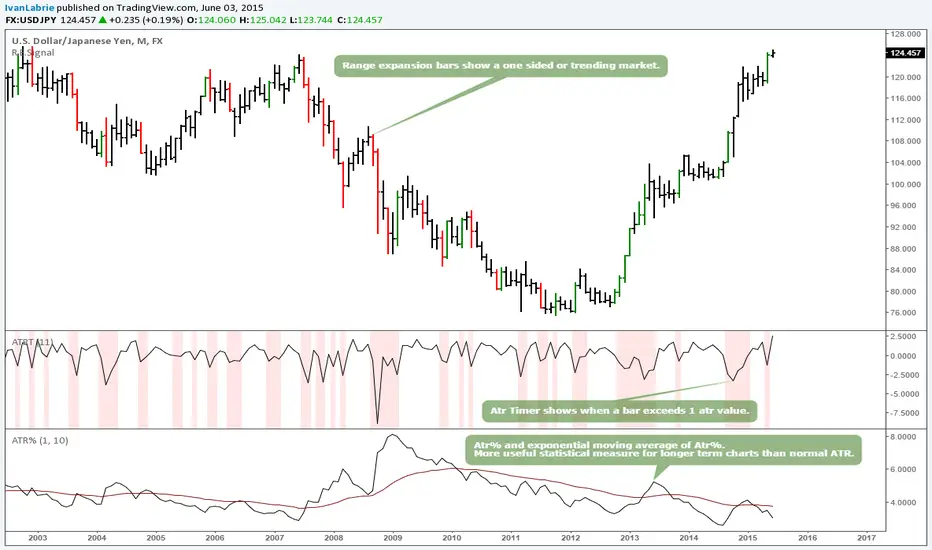
ATR%, ATR Timer and Range Expansion signalThese 3 indicators can be really useful.
The usage is fairly straightforward, if you understand price action, having an statistical edge like these provide can be useful.
Refer to Tim West's charts to learn more about range expansion bars.
The idea for the Atr% and Atr timer come from discussions I had with Yacine Kanoun, props to him for his contribution.
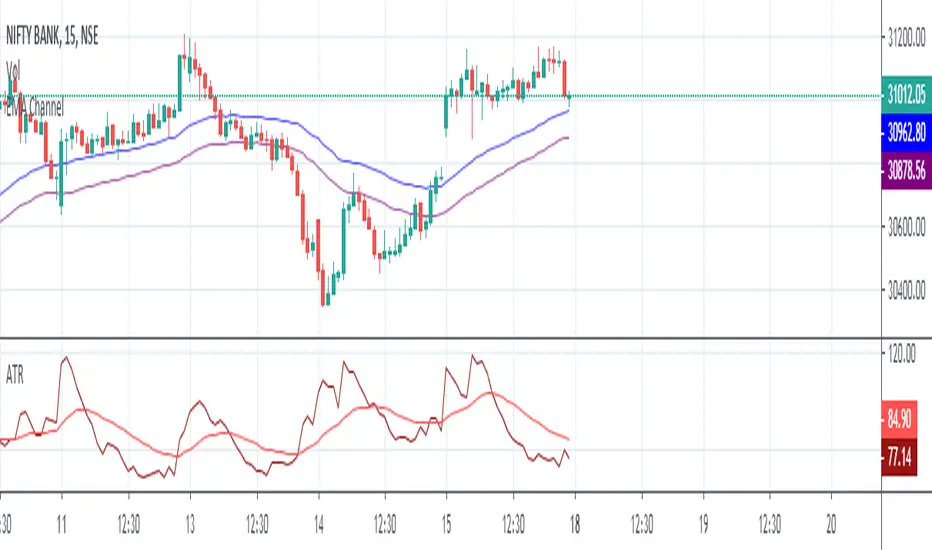
Keltner Channel with Custom ATRKeltner Channel EMA based. Use Custom ATR value.
Reversion to the mean band from TTM $400+
List of All my Indicators - www.tradingview.com


ATR with EMAATR is a very powerful indicator to understand volatility in market, using along with EMA gives you fair idea with is volatility is moving high and low.


ATR BandThe indicator is intended to be used with daily or higher time frames.
Options:
Mark out of Band: show a symbol if price has moved beyond the band

ATR BandThe indicator is intended to be used with daily or higher time frames.
Options:
Mark out of Band: show a symbol is price has moved beyond the band

ATR BandThe indicator is intended to be used with daily or higher time frames.
Options:
Mark out of Band: show a symbol is price has moved beyond the band

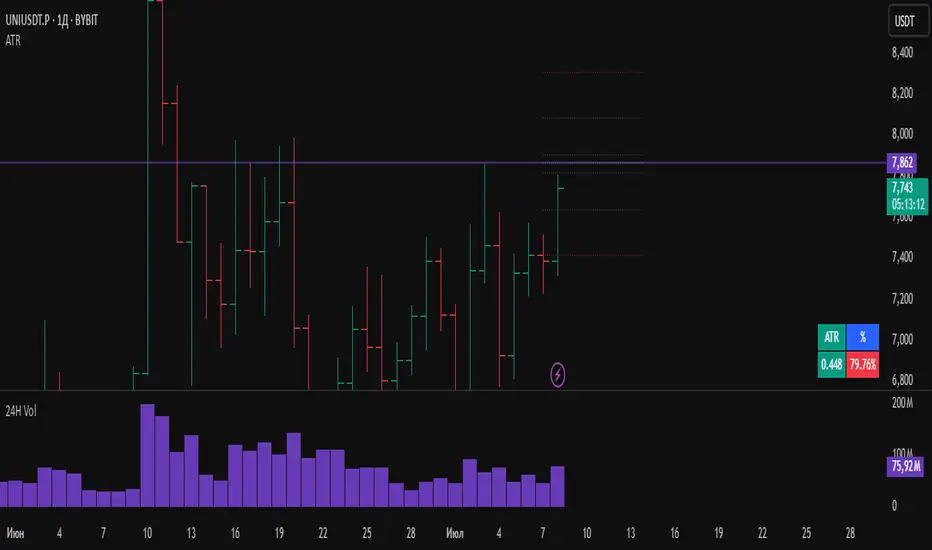
ATRWhat the Indicator Shows:
A compact table with four cells is displayed in the bottom-left corner of the chart:
| ATR | % | Level | Lvl+ATR |
Explanation of the Columns:
ATR — The averaged daily range (volatility) calculated with filtering of abnormal bars (extremely large or small daily candles are ignored).
% — The percentage of the daily ATR that the price has already covered today (the difference between the daily Open and Close relative to ATR).
Level — A custom user-defined level set through the indicator settings.
Lvl+ATR — The sum of the daily ATR and the user-defined level. This can be used, for example, as a target or stop-loss reference.
Color Highlighting of the "%" Cell:
The background color of the "%" ATR cell changes depending on the value:
✅ If the value is less than 10% — the cell is green (market is calm, small movement).
➖ If the value is between 10% and 50% — no highlighting (average movement, no signal).
🟡 If the value is between 50% and 70% — the cell is yellow (movement is increasing, be alert).
🔴 If the value is above 70% — the cell is red (the market is actively moving, high volatility).
Key Features:
✔ All ATR calculations and percentage progress are performed strictly based on daily data, regardless of the chart's current timeframe.
✔ The indicator is ideal for intraday traders who want to monitor daily volatility levels.
✔ The table always displays up-to-date information for quick decision-making.
✔ Filtering of abnormal bars makes ATR more stable and objective.
What is Adaptive ATR in this Indicator:
Instead of the classic ATR, which simply averages the true range, this indicator uses a custom algorithm:
✅ It analyzes daily bars over the past 100 days.
✅ Calculates the range High - Low for each bar.
✅ If the bar's range deviates too much from the average (more than 1.8 times higher or lower), the bar is considered abnormal and ignored.
✅ Only "normal" bars are included in the calculation.
✅ The average range of these normal bars is the adaptive ATR.
Detailed Algorithm of the getAdaptiveATR() Function:
The function takes the number of bars to include in the calculation (for example, 5):
The average of the last 5 normal bars is calculated.
pinescript
Копировать
Редактировать
adaptiveATR = getAdaptiveATR(5)
Step-by-Step Process:
An empty array ranges is created to store the ranges.
Daily bars with indices from 1 to 100 are iterated over.
For each bar:
🔹 The daily High and Low with the required offset are loaded via request.security().
🔹 The range High - Low is calculated.
🔹 The temporary average range of the current array is calculated.
🔹 The bar is checked for abnormality (too large or too small).
🔹 If the bar is normal or it's the first bar — its range is added to the array.
Once the array accumulates the required number of bars (count), their average is calculated — this is the adaptive ATR.
If it's not possible to accumulate the required number of bars — na is returned.
Что показывает индикатор:
На графике внизу слева отображается компактная таблица из четырех ячеек:
ATR % Уровень Ур+ATR
Пояснения к столбцам:
ATR — усреднённый дневной диапазон (волатильность), рассчитанный с фильтрацией аномальных баров (слишком большие или маленькие дневные свечи игнорируются).
% — процент дневного ATR, который уже "прошла" цена на текущий день (разница между открытием и закрытием относительно ATR).
Уровень — пользовательский уровень, который задаётся вручную через настройки индикатора.
Ур+ATR — сумма уровня и дневного ATR. Может использоваться, например, как ориентир для целей или стопов.
Цветовая подсветка ячейки "%":
Цвет фона ячейки с процентом ATR меняется в зависимости от значения:
✅ Если значение меньше 10% — ячейка зелёная (рынок пока спокоен, маленькое движение).
➖ Если значение от 10% до 50% — фон не подсвечивается (среднее движение, нет сигнала).
🟡 Если значение от 50% до 70% — ячейка жёлтая (движение усиливается, повышенное внимание).
🔴 Если значение выше 70% — ячейка красная (рынок активно движется, высокая волатильность).
Особенности работы:
✔ Все расчёты ATR и процентного прохождения производятся исключительно по дневным данным, независимо от текущего таймфрейма графика.
✔ Индикатор подходит для трейдеров, которые торгуют внутри дня, но хотят ориентироваться на дневные уровни волатильности.
✔ В таблице всегда отображается актуальная информация для принятия быстрых торговых решений.
✔ Фильтрация аномальных баров делает ATR более устойчивым и объективным.
Что такое адаптивный ATR в этом индикаторе
Вместо классического ATR, который просто усредняет истинный диапазон, здесь используется собственный алгоритм:
✅ Он берет дневные бары за последние 100 дней.
✅ Для каждого из них рассчитывает диапазон High - Low.
✅ Если диапазон бара слишком сильно отличается от среднего (более чем в 1.8 раза больше или меньше), бар считается аномальным и игнорируется.
✅ Только нормальные бары попадают в расчёт.
✅ В итоге считается среднее из диапазонов этих нормальных баров — это и есть адаптивный ATR.
Подробный алгоритм функции getAdaptiveATR()
Функция принимает количество баров для расчёта (например, 5):
Считается 5 последних нормальных баров
pinescript
Копировать
Редактировать
adaptiveATR = getAdaptiveATR(5)
Пошагово:
Создаётся пустой массив ranges для хранения диапазонов.
Перебираются дневные бары с индексами от 1 до 100.
Для каждого бара:
🔹 Через request.security() подгружаются дневные High и Low с нужным смещением.
🔹 Считается диапазон High - Low.
🔹 Считается временное среднее диапазона по текущему массиву.
🔹 Проверяется, не является ли бар аномальным (слишком большой или маленький).
🔹 Если бар нормальный или это самый первый бар — его диапазон добавляется в массив.
Как только массив набирает заданное количество баров (count), берётся их среднее значение — это и есть адаптивный ATR.
Если не удалось набрать нужное количество баров — возвращается na.
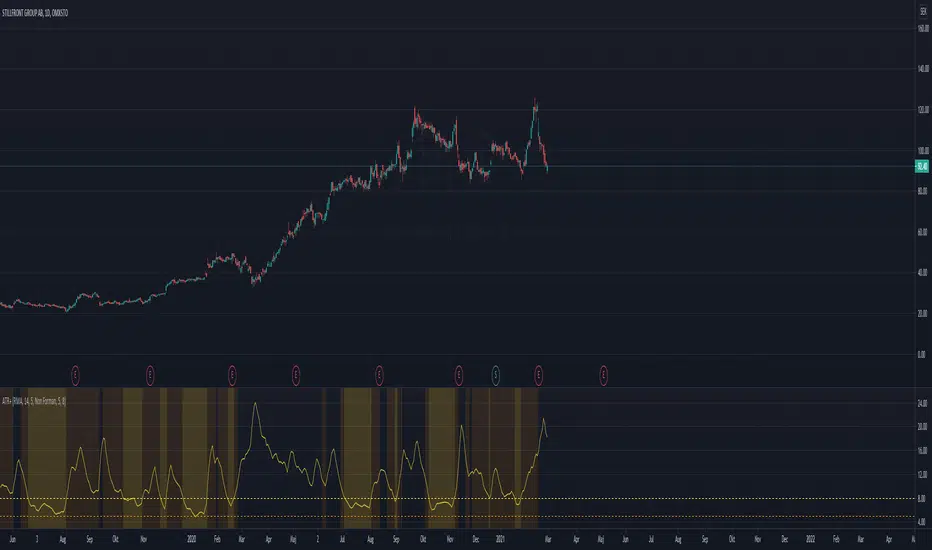
ATR+(Experimental)
I often use the ATR as a volatility filter, to get better entries or to just get a quick understand of the volatility when screening different stocks.
With this indicator you can use the ATR in a few different ways:
-- Dynamic ATR --
To get more comparability between stocks I use a dynamic/normalized ATR, so I've experimented with two different methods.
ATR% can be calculated using John Forman’s approach called Normalized ATR (ATR / Close * 100). Or it can be calculated using what I call "Non Forman",
where the normalization happens to the true range and not to the average true range (average of (TR / Close * 100)). I think this method is "cleaner",
though the difference between the two is minimal. For more on this see www.macroption.com
You can chose between normal ATR (not normalized), Forman's normazation method, and "Non-Forman" normalization.
-- Smoothed ATR --
I originally used an ATR on a higher timeframe to get an idea of the overall volatility. But with higher time frames you always end up lag (or repainting
issues when combining into an indicator). So I expertimented on smoothing the true range, by including several bars into the calculation. I most trade
on a daily time frame so to my default "smoothing" is calculating the true range based on the last 5 days. This pretty much equals how the weekly TR
would be calculated, but since it updates daily we get a different result.
You can chose between displaying the standard ATR, the smoothed ATR or both.
-- Thresholds --
To make it more clear and visually more appealing I added thresholds and I'm plotting warning zones for low volatily.
-- Moving Average Method --
I think the best results from ATR comes when using RMA. But since I wanted to experiment with different options, the moving averages can be done using
RMA, SMA, EMA, Hull MA, or WMA.
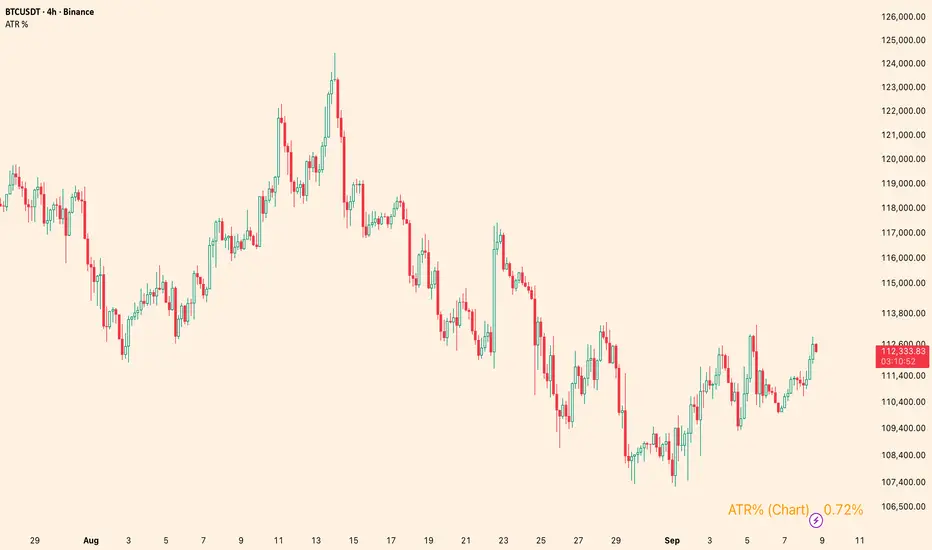
ATR %Overview
Shows the Average True Range (ATR) as a percentage of a chosen price basis. Useful for a quick, apples-to-apples view of current volatility across symbols and timeframes. The value is displayed in a clean table at the bottom-right of the chart.
What it shows
Basis can be: Close, EMA(len), SMA(len), or VWAP.
Data timeframe can be the Chart timeframe or a Daily aggregation.
Inputs
ATR length (len) – ATR lookback.
Percent basis – Close / EMA / SMA / VWAP.
Data timeframe – Chart (uses the current chart TF) or Daily (computes ATR and basis from daily data).
Decimals – number of decimal places to display.
Text / Background / Frame colors – customize the table appearance.
Notes
In Daily mode, ATR and basis are taken from daily data and update on daily close.
VWAP is available only in Chart mode (Daily + VWAP will show n/a by design).
The script overlays the chart but does not plot lines—only a compact info box.
Use cases
Compare volatility across coins/stocks quickly using ATR% instead of raw ATR.
Switch basis to match your style (e.g., EMA for trend-aware scaling, VWAP for intraday context).
Set Daily to track higher-timeframe volatility while trading lower TFs.
Disclaimer
For educational purposes only. Not financial advice. Trading involves risk.