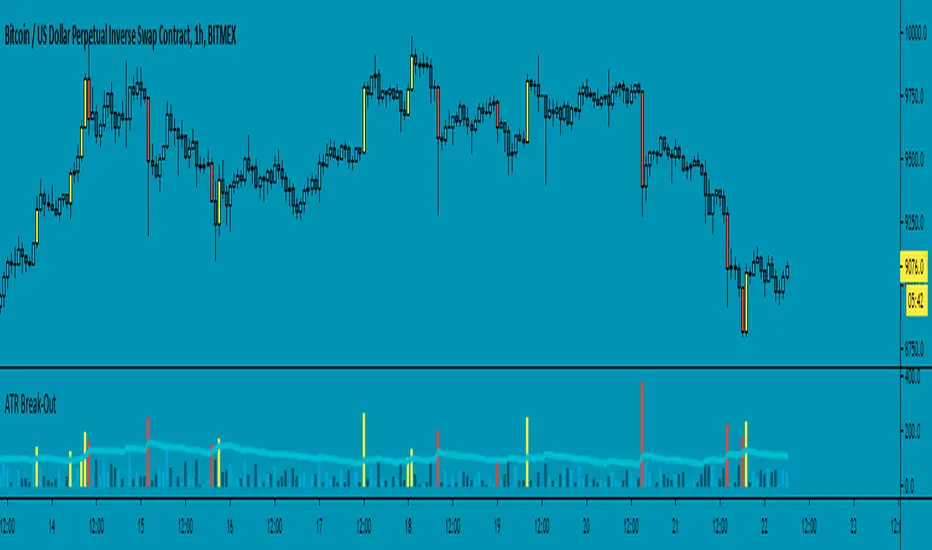
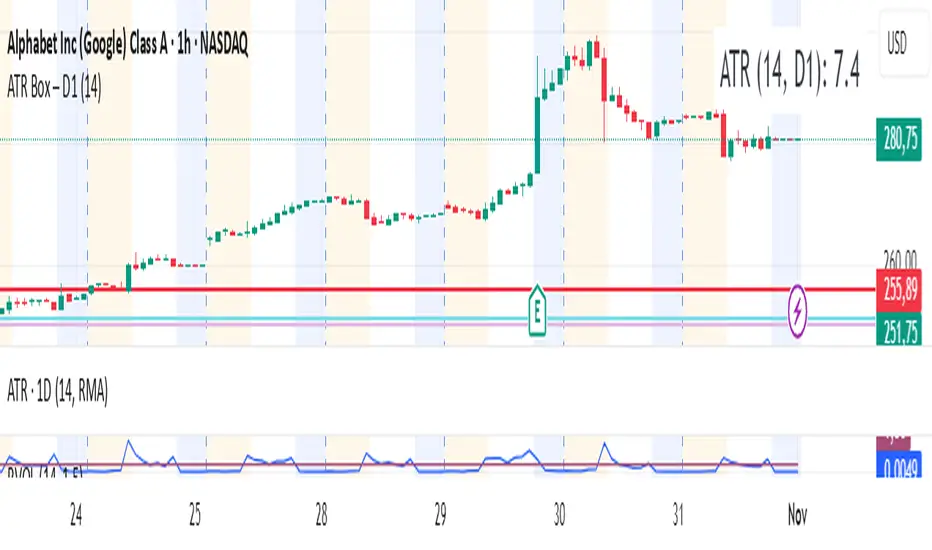
ATR Break-Out - evoThis script measures candle length and average true range (ATR). A break out occurs when a candle is larger than the given ATR value. You can choose to calculate length from wicks or from the body (open & close).
You can use this as trend direction indicator by following the last break out candle or open a position after a break out with a stop just above or below the candle. Enjoy!
Recherche dans les scripts pour "atr"

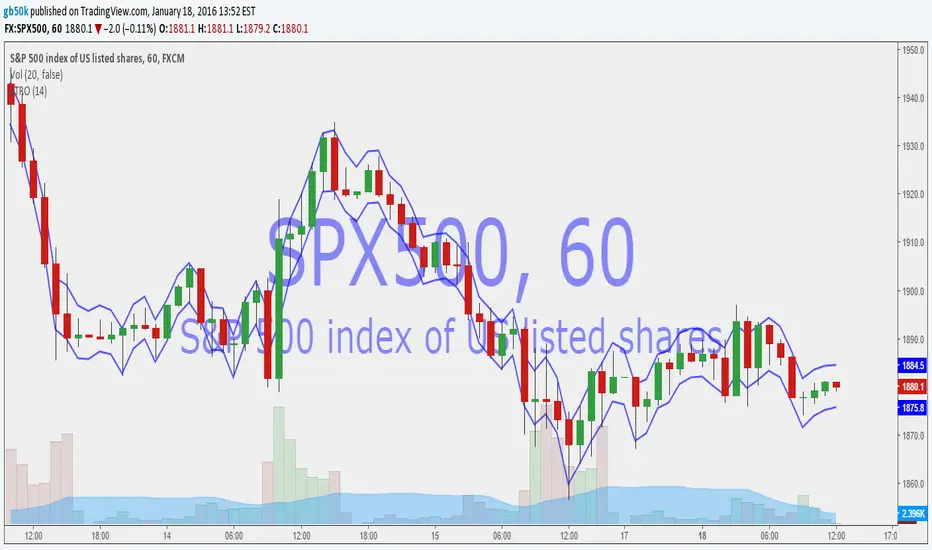
Scott’s ATR volatility histogram with smoothingATR shows volatility. The sma of the ATR (default=14 period) shows the average volatility over the look-back period, (default=200 period.)
When volatility is higher than average, the histogram turns green. When volatility is less than average, the histogram turns red. This shows volatility expansion and contraction. Volatility expansion is a good confirmation for entering a trade position. Volatility contraction is a sign that a trend is not developing.
Now I have added an sma which acts as a smoothing of expanding or contracting volatility. When the histogram is higher than this smoothing (default=21) then volatility expansion momentum is creasing. WWhen the histogram is lower than the smoothing sma, volatility contraction momentum is increasing.
I introduce an idea that volatility momentum can be used as a substitute for volatility expansion and contraction.
Now we have volatility expansion momentum and volatility contraction momentum.

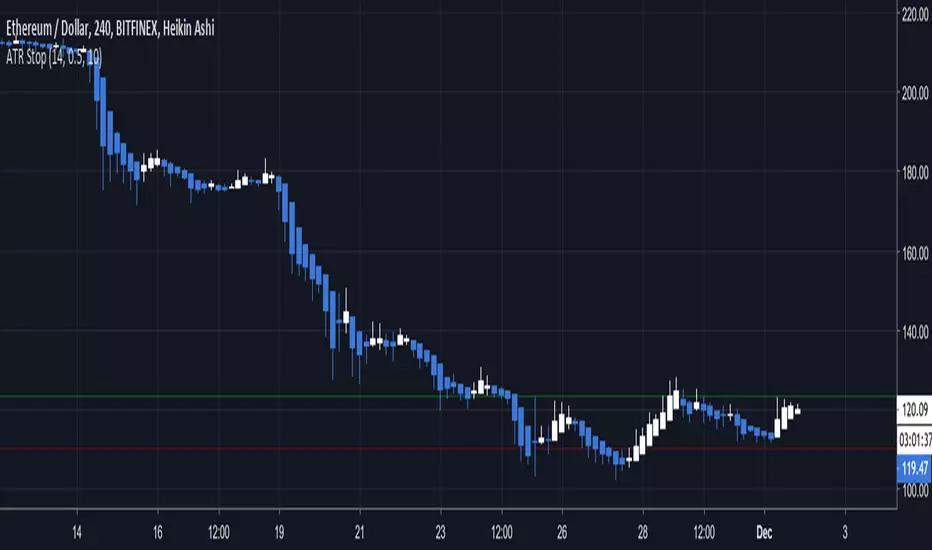
ATR stop and threshold valueOne can use the average true range for both entries and stops. A possible way to reduce false breakouts is to enter (say) at 0.5 * atr above the breakout level. Then you could use a 1.0*atr for a stop setting. This indicator allows you to set entries and stops for both long and short setups directly on the chart. I use it with breakout systems as it allows me to easily setup my trades.

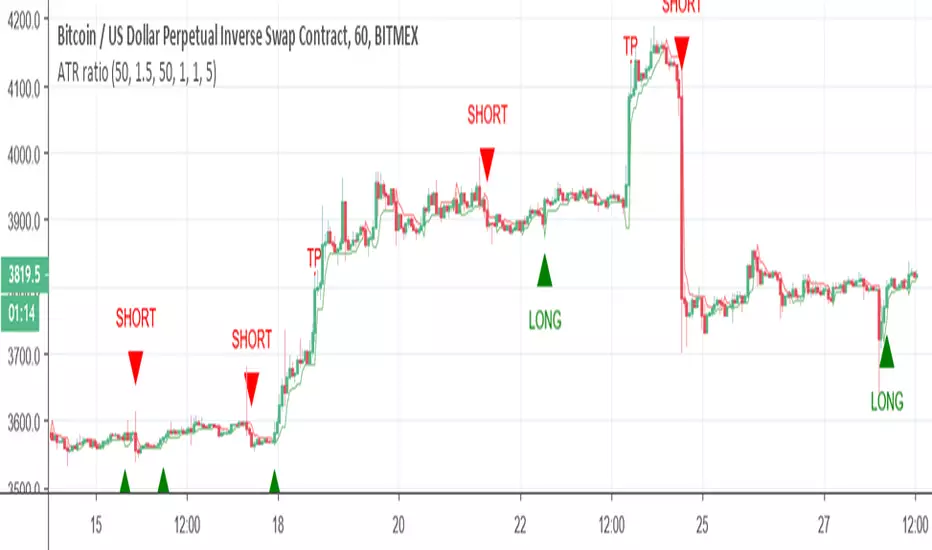
ATR ratioThis model is based on ATR ratio between the high and the low.
I add to Super trend that can act as filter or act by its own (setting is 1 and 1 but try to change it to find better outcome)
add take profit on 5%
Similar to price channel model and don ratio model I use the difference between the high and the low to create the signal
The aim of the super trend is to try to filter sideway signal . You can replace it with another method if you think its better in order to remove stupid signals when market go sideway
or add what ever you want
the ATR signal controlled by lookback (now on 50)
alerts is inside
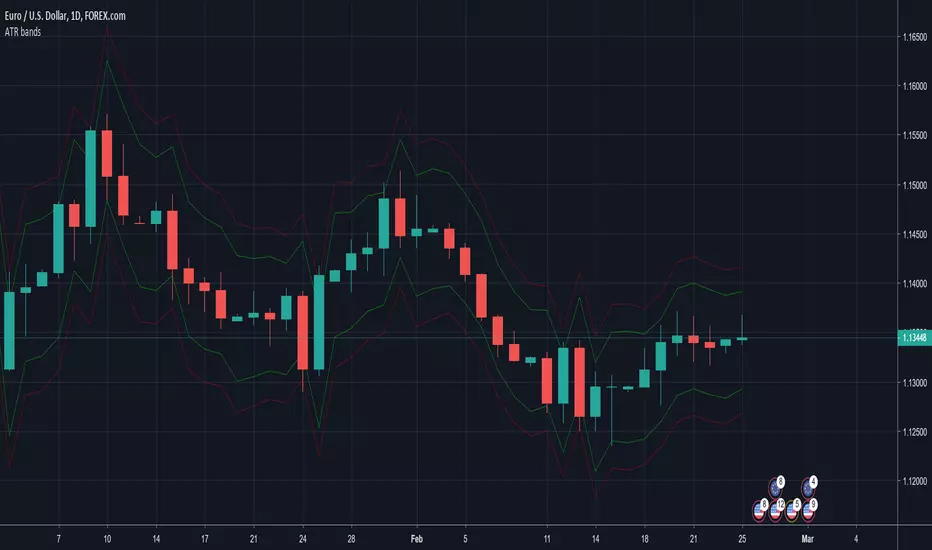
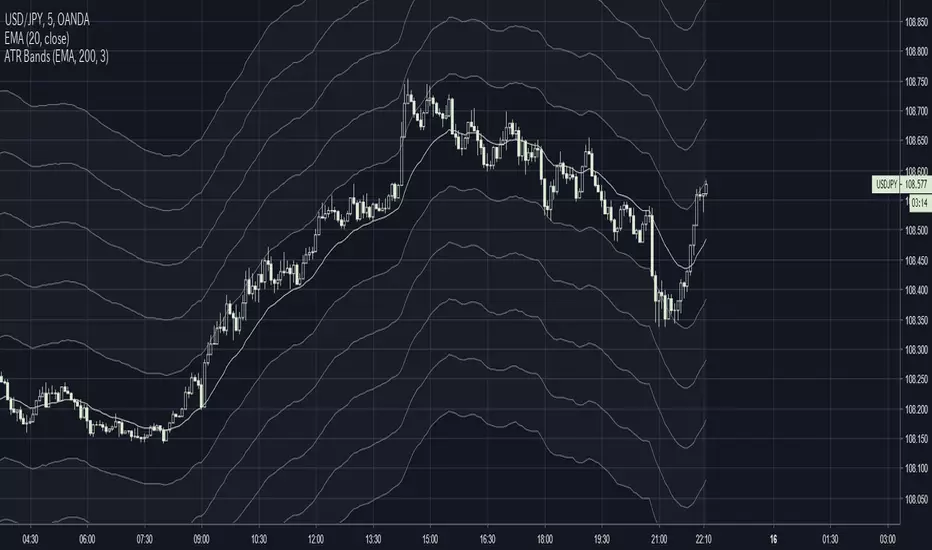
ATR BandsEach line is drawn at intervals based on the value ATR * Coefficient.
Params
Source: Specifies a center line. Default value is close.
Period: ATR Period.
Coefficient: Adjusts the bandwidth.
ATR Stop Loss VisualizerThis will help you figure out what stop loss settings work best for you. Some people might prefer ATR 14 * 0.5 for shorter timeframes, some might prefer more extreme settings such as ATR 30 * 2 to not get stopped out as often.

Average True Range Overlay - BandPlots a band of width 1 ATR around the midpoint (HL2)
Settings:
- Length of ATR
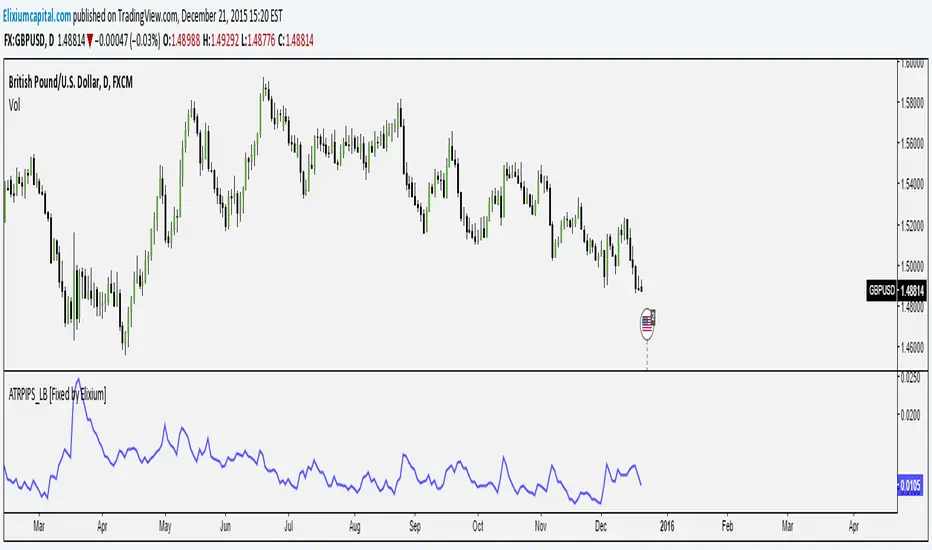
ATR Pips [LazyBear] [Fixed by Elixium]This is ATR in pips. This was requested by user @ElixiumCapital on Twitter. ATRPIPs in his words:
How to use: Change the chart to the Daily time frame. The indicators value e.g. 0.0105 means that the average daily range of the past 5 trading days is 105 pips. (On standard pairs like EURUSD, GBPUSD)
"ATR PIPs is useful for finding markets with your desired amount of volatility, for example I prefer to trade forex pairs with the highest amount of volatility in the past 5 days, setting the length parameter to 5 days. And setting my stop loss at 25% to 33% of the the indicators value."
Fixed: Default parameters and a critical bug.
ATR Trend Table with DI both waysThis indicator is used confirm entry point whether it has met ATR and DI direction criterias
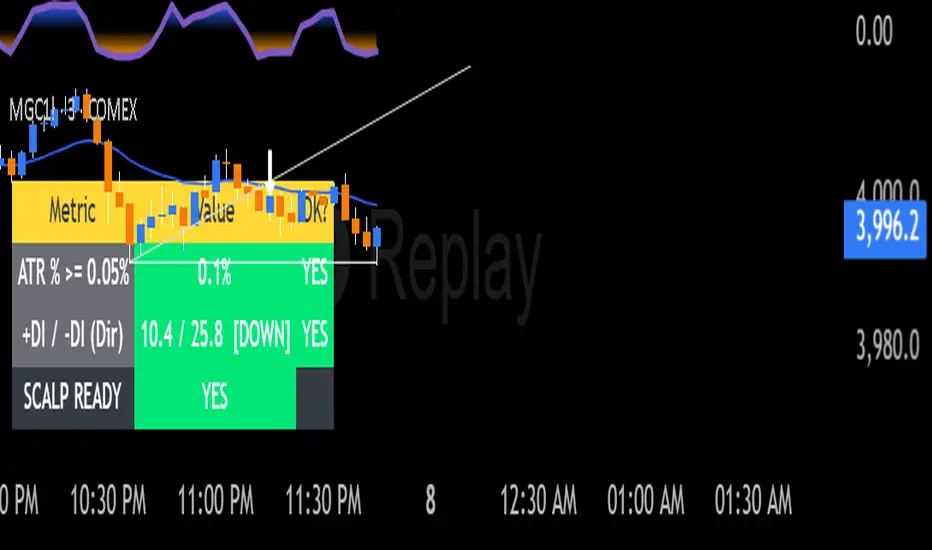
ATR/ADX Trend Table - Compact & Positionable (Fixed init)Table to determine qualified ATR & ADX DI for follow trend entry

ATR-BHEEM-NOCHANGE-CANDLESCandles remain normal — removed barcolor(barCol)
ATR trailing stop line still shows trend direction (green/red)
Optional buy/sell labels added only when trend flips
Clean and ready for intraday 1-min charts

ATR Trailing Stop Without tradepanel Open✅ Only plots ATR trailing stop line
✅ Only colors candles
✅ No trades / entries
✅ No “Strategy Tester” panel
✅ No arrows, markers, or trade lists

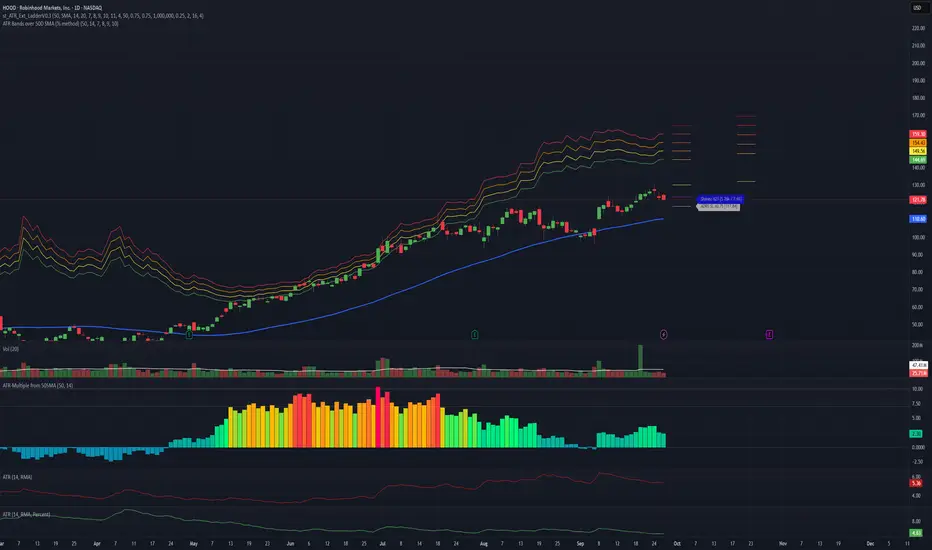
ATR Bands over 50D SMA (% method)Indicator that shows multiples of ATR% above the 50d SMA as bands on a chart, building off of
Jeff Sun 's methodology. You should tinker with the settings to chose your multiples, colors and which multiple lines to show. I don't know if the negative multiple lines have any use, so I turn mine off. Offered as is. I am not a programmer. Note the other indicators shown on the print screen are not mine.
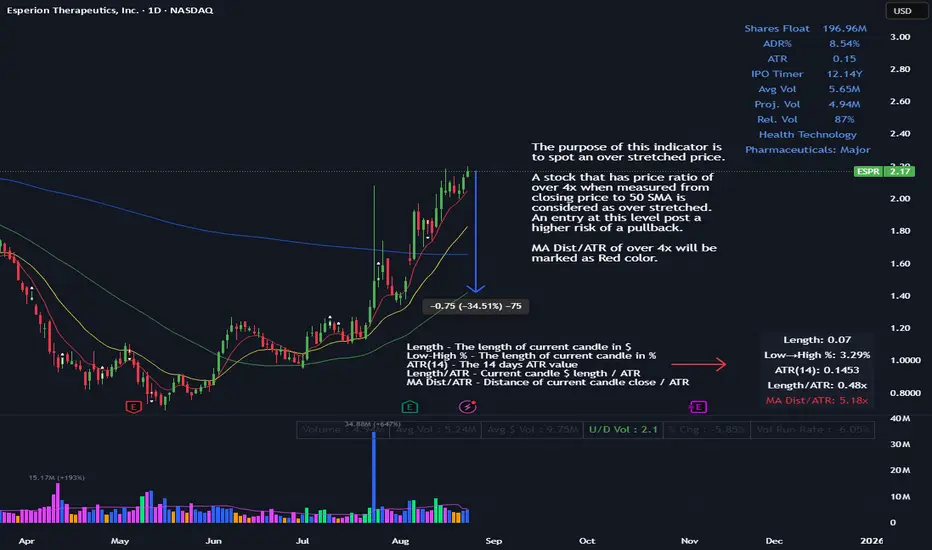
ATR Multiple from MAThe purpose of this indicator is to spot an over stretched price.
A stock that has price ratio of over 4x when measured from closing price to 50 SMA is considered as over stretched. An entry at this level post a higher risk of a pullback.
MA Dist/ATR of over 4x will be marked as Red color.
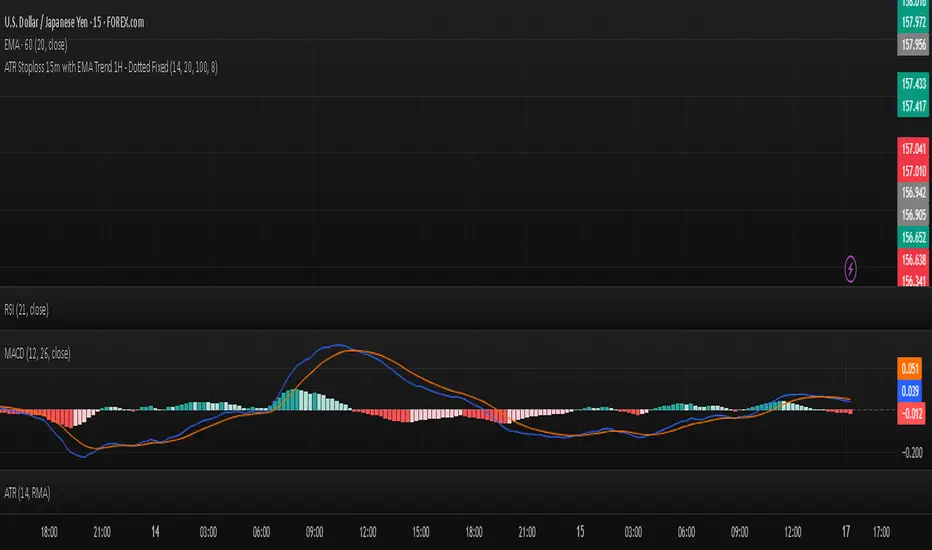
ATR Stoploss 15m with EMA Trend 1H - Dotted Fixeduse this as a basic ATR stoploss. It uses 100 and 20 EMA on 1hr to determine trend.
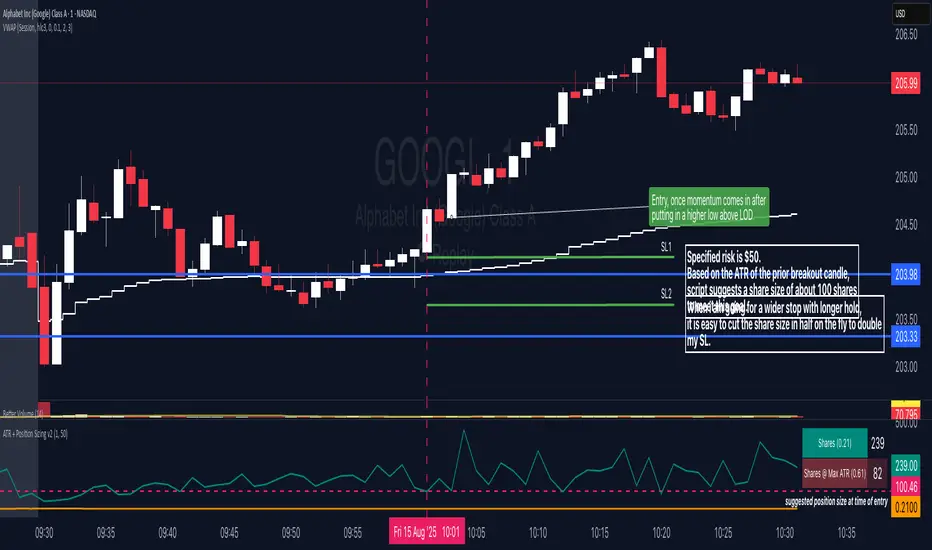
ATR + Position SizingThis is an equalized risk calculation for easy position sizing when trading multiple instruments at the open.
The formula is simple:
Position Size = $ Risk / X-period ATR
ATR Volatility Breakout - Daily (Minimal) - SyTheInvestorGuycolor-coded TradingView Pine Script that highlights the background green/red on days when these ATR breakout conditions
ATR Dynamische Candles 1.2 (by Droes)This script visualizes ATR values as candles to the right of the last candle at today's high and today's low.
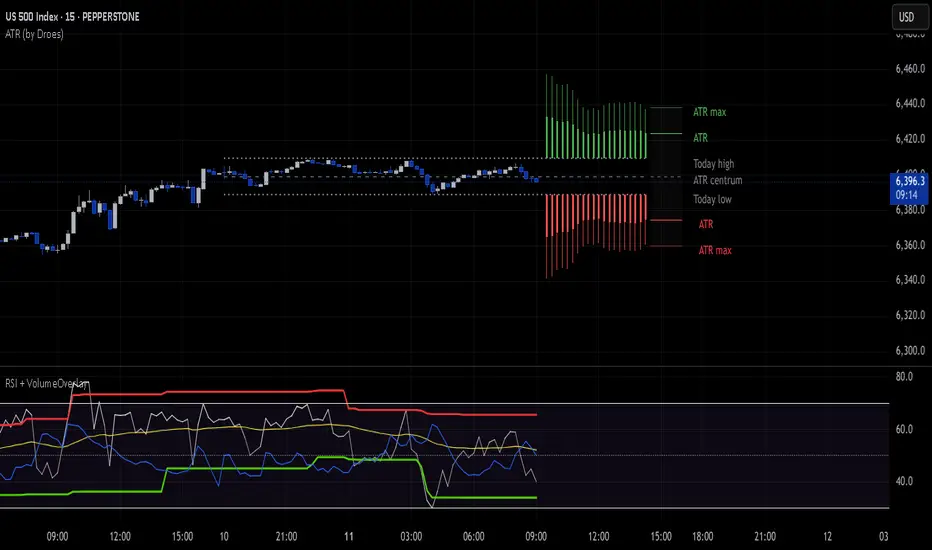
ATR Daily Viz V30.0This script visualizes ATR values as candles to the right of the last candle at today's high and low.
This is the first version.
