Momentum Breakout Filter + ATR ZonesMomentum Breakout Filter + ATR Zones - User Guide
What This Indicator Does
This indicator helps you with your MACD + volume momentum strategy by:
Filtering out fake breakouts - Shows ⚠️ warnings when breakouts lack confirmation
Showing clear entry signals - 🚀 LONG and 🔻 SHORT labels when all conditions align
Automatic stop loss & profit targets - Based on ATR (Average True Range)
Visual trend confirmation - Background color + EMA alignment
Signal Types
🚀 LONG Entry Signal (Green Label)
Appears when ALL conditions met:
✅ MACD crosses above signal line
✅ Volume > 1.5× average
✅ Price > EMA 9 > EMA 21 > EMA 200 (bullish trend)
✅ Price closes above recent 20-bar high
🔻 SHORT Entry Signal (Red Label)
Appears when ALL conditions met:
✅ MACD crosses below signal line
✅ Volume > 1.5× average
✅ Price < EMA 9 < EMA 21 < EMA 200 (bearish trend)
✅ Price closes below recent 20-bar low
⚠️ FAKE Breakout Warning (Orange Label)
Appears when price breaks high/low BUT lacks confirmation:
❌ Low volume (below 1.5× average), OR
❌ Wick break only (didn't close through level), OR
❌ MACD not aligned with direction
Hover over the warning label to see what's missing!
ATR Stop Loss & Targets
When you get a signal, colored lines automatically appear:
Long Position
Red solid line = Stop Loss (Entry - 1.5×ATR)
Green dashed lines = Profit Targets:
Target 1: Entry + 2×ATR
Target 2: Entry + 3×ATR
Target 3: Entry + 4×ATR
Short Position
Red solid line = Stop Loss (Entry + 1.5×ATR)
Green dashed lines = Profit Targets:
Target 1: Entry - 2×ATR
Target 2: Entry - 3×ATR
Target 3: Entry - 4×ATR
The lines move with each bar until you exit the position.
Chart Elements
Moving Averages
Blue line = EMA 9 (fast)
Orange line = EMA 21 (medium)
White line = EMA 200 (trend filter)
Volume
Yellow bars = High volume (above threshold)
Gray bars = Normal volume
Background Color
Light green = Bullish trend (all EMAs aligned up)
Light red = Bearish trend (all EMAs aligned down)
No color = Neutral/mixed
MACD (Bottom Pane)
Green/Red columns = MACD Histogram
Blue line = MACD Line
Orange line = Signal Line
Info Dashboard (Bottom Right)
ItemWhat It ShowsVolumeCurrent volume vs average (✓ HIGH or ✗ Low)MACDDirection (BULLISH or BEARISH)TrendEMA alignment (BULL, BEAR, or NEUTRAL)ATRCurrent ATR value in dollarsPositionCurrent position (LONG, SHORT, or NONE)R:RRisk-to-Reward ratio (shows when in position)
How To Use It
Basic Workflow
Wait for setup
Watch for MACD to approach signal line
Volume should be building
Price should be near EMA structure
Get confirmation
Wait for 🚀 LONG or 🔻 SHORT label
Check dashboard shows "✓ HIGH" volume
Verify trend is aligned (green or red background)
Enter the trade
Enter when signal appears
Note your stop loss (red line)
Note your targets (green dashed lines)
Manage the trade
Exit at first target for partial profit
Move stop to breakeven
Trail remaining position
What To Avoid
❌ Don't trade when you see:
⚠️ FAKE labels (wait for confirmation)
Neutral background (no clear trend)
"✗ Low" volume in dashboard
MACD and Trend not aligned
Settings You Can Adjust
Volume Sensitivity
High Volume Threshold: Default 1.5×
Increase to 2.0× for cleaner signals (fewer trades)
Decrease to 1.2× for more signals (more trades)
Fake Breakout Filters
You can toggle these ON/OFF:
Volume Confirmation: Requires high volume
Close Through: Requires candle close, not just wick
MACD Alignment: Requires MACD direction match
Tip: Turn all three ON for highest quality signals
ATR Stop/Target Multipliers
Default settings (conservative):
Stop Loss: 1.5×ATR
Target 1: 2×ATR (1.33:1 R:R)
Target 2: 3×ATR (2:1 R:R)
Target 3: 4×ATR (2.67:1 R:R)
Aggressive traders might use:
Stop Loss: 1.0×ATR
Target 1: 2×ATR (2:1 R:R)
Target 2: 4×ATR (4:1 R:R)
Conservative traders might use:
Stop Loss: 2.0×ATR
Target 1: 3×ATR (1.5:1 R:R)
Target 2: 5×ATR (2.5:1 R:R)
Example Trade Scenarios
Scenario 1: Perfect Long Setup ✅
Stock consolidating near EMA 21
MACD curling up toward signal line
Volume bar turns yellow (high volume)
🚀 LONG label appears
Red stop line and green target lines appear
Result: High probability trade
Scenario 2: Fake Breakout Avoided ✅
Price breaks above resistance
Volume is normal (gray bar)
⚠️ FAKE label appears (hover shows "Low volume")
No entry signal
Price falls back below breakout level
Result: Avoided losing trade
Scenario 3: Premature Entry ❌
MACD crosses up
Volume is high
BUT trend is NEUTRAL (no background color)
No signal appears (trend filter blocks it)
Result: Avoided choppy/sideways market
Quick Reference
Entry Checklist
🚀 or 🔻 label on chart
Dashboard shows "✓ HIGH" volume
Dashboard shows aligned MACD + Trend
Colored background (green or red)
ATR lines visible
No ⚠️ FAKE warning
Exit Strategy
Target 1 (2×ATR): Take 50% profit, move stop to breakeven
Target 2 (3×ATR): Take 25% profit, trail stop
Target 3 (4×ATR): Take remaining profit or trail aggressively
Stop Loss: Exit entire position if hit
Alerts
Set up these alerts:
Long Entry: Fires when 🚀 LONG signal appears
Short Entry: Fires when 🔻 SHORT signal appears
Fake Breakout Warning: Fires when ⚠️ appears (optional)
Tips for Success
Use on 5-minute charts for day trading momentum plays
Only trade high volume stocks ($5-20 range works best)
Wait for full confirmation - don't jump early
Respect the stop loss - it's calculated based on volatility
Scale out at targets - don't hold for home runs
Avoid trading first 15 minutes - let market settle
Best during 10am-11am and 2pm-3pm - peak momentum times
Common Questions
Q: Why didn't I get a signal even though MACD crossed?
A: All conditions must be met - check dashboard for what's missing (likely volume or trend alignment)
Q: Can I use this on any timeframe?
A: Yes, but it's designed for 5-15 minute charts. On daily charts, adjust ATR multipliers higher.
Q: The stop loss seems too tight, can I widen it?
A: Yes, increase "Stop Loss (×ATR)" from 1.5 to 2.0 or 2.5 in settings.
Q: I keep seeing FAKE warnings but price keeps going - what gives?
A: The filter is conservative. You can disable some filters in settings, but expect more false signals.
Q: Can I use this for swing trading?
A: Yes, but use larger timeframes (1H or 4H) and adjust ATR multipliers up (3× for stops, 6-9× for targets).
Recherche dans les scripts pour "atr"

BOCS AdaptiveBOCS Adaptive Strategy - Automated Volatility Breakout System
WHAT THIS STRATEGY DOES:
This is an automated trading strategy that detects consolidation patterns through volatility analysis and executes trades when price breaks out of these channels. Take-profit and stop-loss levels are calculated dynamically using Average True Range (ATR) to adapt to current market volatility. The strategy closes positions partially at the first profit target and exits the remainder at the second target or stop loss.
TECHNICAL METHODOLOGY:
Price Normalization Process:
The strategy begins by normalizing price to create a consistent measurement scale. It calculates the highest high and lowest low over a user-defined lookback period (default 100 bars). The current close price is then normalized using the formula: (close - lowest_low) / (highest_high - lowest_low). This produces values between 0 and 1, allowing volatility analysis to work consistently across different instruments and price levels.
Volatility Detection:
A 14-period standard deviation is applied to the normalized price series. Standard deviation measures how much prices deviate from their average - higher values indicate volatility expansion, lower values indicate consolidation. The strategy uses ta.highestbars() and ta.lowestbars() functions to track when volatility reaches peaks and troughs over the detection length period (default 14 bars).
Channel Formation Logic:
When volatility crosses from a high level to a low level, this signals the beginning of a consolidation phase. The strategy records this moment using ta.crossover(upper, lower) and begins tracking the highest and lowest prices during the consolidation. These become the channel boundaries. The duration between the crossover and current bar must exceed 10 bars minimum to avoid false channels from brief volatility spikes. Channels are drawn using box objects with the recorded high/low boundaries.
Breakout Signal Generation:
Two detection modes are available:
Strong Closes Mode (default): Breakout occurs when the candle body midpoint math.avg(close, open) exceeds the channel boundary. This filters out wick-only breaks.
Any Touch Mode: Breakout occurs when the close price exceeds the boundary.
When price closes above the upper channel boundary, a bullish breakout signal generates. When price closes below the lower boundary, a bearish breakout signal generates. The channel is then removed from the chart.
ATR-Based Risk Management:
The strategy uses request.security() to fetch ATR values from a specified timeframe, which can differ from the chart timeframe. For example, on a 5-minute chart, you can use 1-minute ATR for more responsive calculations. The ATR is calculated using ta.atr(length) with a user-defined period (default 14).
Exit levels are calculated at the moment of breakout:
Long Entry Price = Upper channel boundary
Long TP1 = Entry + (ATR × TP1 Multiplier)
Long TP2 = Entry + (ATR × TP2 Multiplier)
Long SL = Entry - (ATR × SL Multiplier)
For short trades, the calculation inverts:
Short Entry Price = Lower channel boundary
Short TP1 = Entry - (ATR × TP1 Multiplier)
Short TP2 = Entry - (ATR × TP2 Multiplier)
Short SL = Entry + (ATR × SL Multiplier)
Trade Execution Logic:
When a breakout occurs, the strategy checks if trading hours filter is satisfied (if enabled) and if position size equals zero (no existing position). If volume confirmation is enabled, it also verifies that current volume exceeds 1.2 times the 20-period simple moving average.
If all conditions are met:
strategy.entry() opens a position using the user-defined number of contracts
strategy.exit() immediately places a stop loss order
The code monitors price against TP1 and TP2 levels on each bar
When price reaches TP1, strategy.close() closes the specified number of contracts (e.g., if you enter with 3 contracts and set TP1 close to 1, it closes 1 contract). When price reaches TP2, it closes all remaining contracts. If stop loss is hit first, the entire position exits via the strategy.exit() order.
Volume Analysis System:
The strategy uses ta.requestUpAndDownVolume(timeframe) to fetch up volume, down volume, and volume delta from a specified timeframe. Three display modes are available:
Volume Mode: Shows total volume as bars scaled relative to the 20-period average
Comparison Mode: Shows up volume and down volume as separate bars above/below the channel midline
Delta Mode: Shows net volume delta (up volume - down volume) as bars, positive values above midline, negative below
The volume confirmation logic compares breakout bar volume to the 20-period SMA. If volume ÷ average > 1.2, the breakout is classified as "confirmed." When volume confirmation is enabled in settings, only confirmed breakouts generate trades.
INPUT PARAMETERS:
Strategy Settings:
Number of Contracts: Fixed quantity to trade per signal (1-1000)
Require Volume Confirmation: Toggle to only trade signals with volume >120% of average
TP1 Close Contracts: Exact number of contracts to close at first target (1-1000)
Use Trading Hours Filter: Toggle to restrict trading to specified session
Trading Hours: Session input in HHMM-HHMM format (e.g., "0930-1600")
Main Settings:
Normalization Length: Lookback bars for high/low calculation (1-500, default 100)
Box Detection Length: Period for volatility peak/trough detection (1-100, default 14)
Strong Closes Only: Toggle between body midpoint vs close price for breakout detection
Nested Channels: Allow multiple overlapping channels vs single channel at a time
ATR TP/SL Settings:
ATR Timeframe: Source timeframe for ATR calculation (1, 5, 15, 60, etc.)
ATR Length: Smoothing period for ATR (1-100, default 14)
Take Profit 1 Multiplier: Distance from entry as multiple of ATR (0.1-10.0, default 2.0)
Take Profit 2 Multiplier: Distance from entry as multiple of ATR (0.1-10.0, default 3.0)
Stop Loss Multiplier: Distance from entry as multiple of ATR (0.1-10.0, default 1.0)
Enable Take Profit 2: Toggle second profit target on/off
VISUAL INDICATORS:
Channel boxes with semi-transparent fill showing consolidation zones
Green/red colored zones at channel boundaries indicating breakout areas
Volume bars displayed within channels using selected mode
TP/SL lines with labels showing both price level and distance in points
Entry signals marked with up/down triangles at breakout price
Strategy status table showing position, contracts, P&L, ATR values, and volume confirmation status
HOW TO USE:
For 2-Minute Scalping:
Set ATR Timeframe to "1" (1-minute), ATR Length to 12, TP1 Multiplier to 2.0, TP2 Multiplier to 3.0, SL Multiplier to 1.5. Enable volume confirmation and strong closes only. Use trading hours filter to avoid low-volume periods.
For 5-15 Minute Day Trading:
Set ATR Timeframe to match chart or use 5-minute, ATR Length to 14, TP1 Multiplier to 2.0, TP2 Multiplier to 3.5, SL Multiplier to 1.2. Volume confirmation recommended but optional.
For Hourly+ Swing Trading:
Set ATR Timeframe to 15-30 minute, ATR Length to 14-21, TP1 Multiplier to 2.5, TP2 Multiplier to 4.0, SL Multiplier to 1.5. Volume confirmation optional, nested channels can be enabled for multiple setups.
BACKTEST CONSIDERATIONS:
Strategy performs best during trending or volatility expansion phases
Consolidation-heavy or choppy markets produce more false signals
Shorter timeframes require wider stop loss multipliers due to noise
Commission and slippage significantly impact performance on sub-5-minute charts
Volume confirmation generally improves win rate but reduces trade frequency
ATR multipliers should be optimized for specific instrument characteristics
COMPATIBLE MARKETS:
Works on any instrument with price and volume data including forex pairs, stock indices, individual stocks, cryptocurrency, commodities, and futures contracts. Requires TradingView data feed that includes volume for volume confirmation features to function.
KNOWN LIMITATIONS:
Stop losses execute via strategy.exit() and may not fill at exact levels during gaps or extreme volatility
request.security() on lower timeframes requires higher-tier TradingView subscription
False breakouts inherent to breakout strategies cannot be completely eliminated
Performance varies significantly based on market regime (trending vs ranging)
Partial closing logic requires sufficient position size relative to TP1 close contracts setting
RISK DISCLOSURE:
Trading involves substantial risk of loss. Past performance of this or any strategy does not guarantee future results. This strategy is provided for educational purposes and automated backtesting. Thoroughly test on historical data and paper trade before risking real capital. Market conditions change and strategies that worked historically may fail in the future. Use appropriate position sizing and never risk more than you can afford to lose. Consider consulting a licensed financial advisor before making trading decisions.
ACKNOWLEDGMENT & CREDITS:
This strategy is built upon the channel detection methodology created by AlgoAlpha in the "Smart Money Breakout Channels" indicator. Full credit and appreciation to AlgoAlpha for pioneering the normalized volatility approach to identifying consolidation patterns and sharing this innovative technique with the TradingView community. The enhancements added to the original concept include automated trade execution, multi-timeframe ATR-based risk management, partial position closing by contract count, volume confirmation filtering, and real-time position monitoring.

Rolling ATR Momentum
Rolling ATR Momentum Indicator – User Manual
---
🔍 Overview
The Rolling ATR Momentum Indicator is a simple yet powerful tool designed to detect shifts in market volatility. It compares the current Average True Range (ATR) with the ATR from a previous point in time to measure how market volatility is changing.
This indicator is especially useful for:
- Spotting the beginning or fading of a momentum phase
- Filtering out low-volatility market conditions
- Enhancing timing for entries and exits in trending or breakout trades
---
📊 Key Components
✅ ATR Delta (Rolling)
- Definition: `ATR Delta = Current ATR - Past ATR`
- Inputs:
- ATR Period (default: 14): The base ATR calculation window
- Lookback Period (default: 5): How many bars ago to compare ATR
- Interpretation:
- Positive ATR Delta (Green Line): Market volatility is increasing
- Negative ATR Delta (Red Line): Market volatility is decreasing
📈 Zero Line
- A horizontal baseline at zero helps you easily see when ATR momentum shifts from negative to positive (or vice versa).
🟩/🟥 Background Color
- Green Background: ATR Delta is positive (rising volatility)
- Red Background: ATR Delta is negative (falling volatility)
🔵 Optional: ATR Reference Lines
- You can optionally display raw Current ATR and Past ATR by changing their visibility settings.
---
✅ How to Use It
Entry Timing (Futures/Options)
- Use ATR Delta as a filter:
- Only take trades when ATR Delta is positive → confirms momentum is building
- Avoid trades when ATR Delta is negative → market might be slow, sideways, or losing steam
Breakout Anticipation
- A rising ATR Delta after a tight range or consolidation can suggest that a breakout is underway
Stop-loss Strategy
- Use high ATR periods for wider stops (to avoid noise)
- Use low ATR periods for tighter stops or skip trading
---
🧠 Pro Tips
- This indicator doesn’t predict direction—combine with trend or price structure tools (like EMA, PPMA, candlesticks)
- Works best in trending or breakout environments
- Add it to multi-timeframe layouts to see volatility buildup on higher timeframes
---
⚙️ Settings
| Parameter | Description |
|----------|-------------|
| ATR Period | Length of the ATR calculation (default 14) |
| Lookback Period | How many bars back to compare ATR values |
---
🧭 Best For:
- Index futures (Nifty, BankNifty)
- Option buyers needing volatility confirmation
- Intraday & swing traders looking to trade momentum setups
---
Use the Rolling ATR Momentum indicator as your volatility radar—simple, clean, and highly effective for staying on the right side of market energy.
End of Manual

Composite Indicator (CCI + ATR)Composite Indicator (CCI + ATR)
The Composite Indicator (CCI + ATR) combines the Commodity Channel Index (CCI) with the Average True Range (ATR) , providing traders with a dynamic tool for identifying entry and exit points based on momentum and volatility. This indicator is particularly useful for markets like cryptocurrencies, which often exhibit sharp sell-offs and gradual upward trends.
Key Features
Momentum Analysis with CCI: The CCI calculates price momentum by comparing the current price level to its average over a specific period. The indicator generates signals when CCI crosses predefined thresholds.
- Buy Signal: Triggered when CCI crosses above the lower threshold (e.g., -100).
- Sell Signal: Triggered when CCI crosses below the upper threshold (e.g., +100).
Volatility Filtering with ATR: The ATR measures market volatility, ensuring signals occur only during significant price movements.
Separate multipliers for buy and sell signals allow tailored filtering based on market behavior.
Stop Loss Calculation: Dynamic stop loss levels are calculated using the ATR multiplier to adapt to market volatility, offering better risk management.
How It Works
CCI Calculation: The CCI is calculated using the typical price ((High + Low + Close) / 3) and a user-defined length. It detects momentum changes by measuring deviations from the average price.
ATR Calculation: The ATR determines the average price range over a specified period, identifying the market’s volatility. The ATR SMA acts as a baseline to filter signals.
Buy Signal: A buy signal is triggered when:
- CCI crosses above the lower threshold (e.g., -100).
- ATR exceeds its SMA multiplied by the buy multiplier (e.g., 1.0).
Sell Signal: A sell signal is triggered when:
- CCI crosses below the upper threshold (e.g., +100).
- ATR exceeds its SMA multiplied by the sell multiplier (e.g., 0.95).
Stop Loss Integration:
- Long positions: Stop loss = Low – (ATR * ATR Multiplier)
- Short positions: Stop loss = High + (ATR * ATR Multiplier)
Advantages
Combines momentum (CCI) and volatility (ATR) for precise signal generation.
Customizable thresholds and multipliers for different market conditions.
Dynamic stop loss ensures better risk management in volatile markets.
Suggested Parameter Settings
CCI Length: 20 (default). Adjust as follows:
- 10–15: Shorter timeframes (e.g., 5-15 minutes).
- 20: General use for 1-hour timeframes.
- 30–50: Longer timeframes (e.g., 4-hour or daily charts).
CCI Threshold: 100 (default). Adjust as follows:
- 50–75: For more frequent signals in ranging markets.
- 100: Balanced for most trading conditions.
- 150–200: For strong trends to reduce noise.
ATR Length: 14 (default). Adjust as follows:
- 10–14: For assets with moderate volatility.
- 20: For assets with lower volatility.
ATR Buy Multiplier: 1.0 (default). Adjust as follows:
- 0.9–1.0: For gradual uptrends in crypto markets.
- 1.1–1.2: For stronger trend filtering.
ATR Sell Multiplier: 0.95 (default). Adjust as follows:
- 0.8–0.95: For sharp sell-offs.
- 1.0–1.1: For stable downward trends.
ATR Multiplier (Stop Loss): 1.5 (default). Adjust as follows:
- 1.0–1.2: For shorter timeframes or less volatile markets.
- 2.0–2.5: For highly volatile markets like cryptocurrencies.
Example Use Cases
Scalping (5-15 minute charts): Use CCI Length = 10, CCI Threshold = 75, ATR Buy Multiplier = 0.9, ATR Sell Multiplier = 0.8.
Day Trading (1-hour charts): Use CCI Length = 20, CCI Threshold = 100, ATR Buy Multiplier = 1.0, ATR Sell Multiplier = 0.95.
Swing Trading (4-hour or daily charts): Use CCI Length = 30, CCI Threshold = 150, ATR Buy Multiplier = 1.2, ATR Sell Multiplier = 1.0.
Final Thoughts The Composite Indicator (CCI + ATR) is a versatile tool designed to enhance trading decisions by combining momentum analysis with volatility filtering. Whether scalping or swing trading, this indicator provides actionable insights and robust risk management to navigate complex markets effectively.

Fibonacci ATR Fusion - Strategy [presentTrading]Open-script again! This time is also an ATR-related strategy. Enjoy! :)
If you have any questions, let me know, and I'll help make this as effective as possible.
█ Introduction and How It Is Different
The Fibonacci ATR Fusion Strategy is an advanced trading approach that uniquely integrates Fibonacci-based weighted averages with the Average True Range (ATR) to identify and capitalize on significant market trends.
Unlike traditional strategies that rely on single indicators or static parameters, this method combines multiple timeframes and dynamic volatility measurements to enhance precision and adaptability. Additionally, it features a 4-step Take Profit (TP) mechanism, allowing for systematic profit-taking at various levels, which optimizes both risk management and return potential in long and short market positions.
BTCUSD 6hr Performance
█ Strategy, How It Works: Detailed Explanation
The Fibonacci ATR Fusion Strategy utilizes a combination of technical indicators and weighted averages to determine optimal entry and exit points. Below is a breakdown of its key components and operational logic.
🔶 1. Enhanced True Range Calculation
The strategy begins by calculating the True Range (TR) to measure market volatility accurately.
TR = max(High - Low, abs(High - Previous Close), abs(Low - Previous Close))
High and Low: Highest and lowest prices of the current trading period.
Previous Close: Closing price of the preceding trading period.
max: Selects the largest value among the three calculations to account for gaps and limit movements.
🔶 2. Buying Pressure (BP) Calculation
Buying Pressure (BP) quantifies the extent to which buyers are driving the price upwards within a period.
BP = Close - True Low
Close: Current period's closing price.
True Low: The lower boundary determined in the True Range calculation.
🔶 3. Ratio Calculation for Different Periods
To assess the strength of buying pressure relative to volatility, the strategy calculates a ratio over various Fibonacci-based timeframes.
Ratio = 100 * (Sum of BP over n periods) / (Sum of TR over n periods)
n: Length of the period (e.g., 8, 13, 21, 34, 55).
Sum of BP: Cumulative Buying Pressure over n periods.
Sum of TR: Cumulative True Range over n periods.
This ratio normalizes buying pressure, making it comparable across different timeframes.
🔶 4. Weighted Average Calculation
The strategy employs a weighted average of ratios from multiple Fibonacci-based periods to smooth out signals and enhance trend detection.
Weighted Avg = (w1 * Ratio_p1 + w2 * Ratio_p2 + w3 * Ratio_p3 + w4 * Ratio_p4 + Ratio_p5) / (w1 + w2 + w3 + w4 + 1)
w1, w2, w3, w4: Weights assigned to each ratio period.
Ratio_p1 to Ratio_p5: Ratios calculated for periods p1 to p5 (e.g., 8, 13, 21, 34, 55).
This weighted approach emphasizes shorter periods more heavily, capturing recent market dynamics while still considering longer-term trends.
🔶 5. Simple Moving Average (SMA) of Weighted Average
To further smooth the weighted average and reduce noise, a Simple Moving Average (SMA) is applied.
Weighted Avg SMA = SMA(Weighted Avg, m)
- m: SMA period (e.g., 3).
This smoothed line serves as the primary signal generator for trade entries and exits.
🔶 6. Trading Condition Thresholds
The strategy defines specific threshold values to determine optimal entry and exit points based on crossovers and crossunders of the SMA.
Long Condition = Crossover(Weighted Avg SMA, Long Entry Threshold)
Short Condition = Crossunder(Weighted Avg SMA, Short Entry Threshold)
Long Exit = Crossunder(Weighted Avg SMA, Long Exit Threshold)
Short Exit = Crossover(Weighted Avg SMA, Short Exit Threshold)
Long Entry Threshold (T_LE): Level at which a long position is triggered.
Short Entry Threshold (T_SE): Level at which a short position is triggered.
Long Exit Threshold (T_LX): Level at which a long position is exited.
Short Exit Threshold (T_SX): Level at which a short position is exited.
These conditions ensure that trades are only executed when clear trends are identified, enhancing the strategy's reliability.
Previous local performance
🔶 7. ATR-Based Take Profit Mechanism
When enabled, the strategy employs a 4-step Take Profit system to systematically secure profits as the trade moves in the desired direction.
TP Price_1 Long = Entry Price + (TP1ATR * ATR Value)
TP Price_2 Long = Entry Price + (TP2ATR * ATR Value)
TP Price_3 Long = Entry Price + (TP3ATR * ATR Value)
TP Price_1 Short = Entry Price - (TP1ATR * ATR Value)
TP Price_2 Short = Entry Price - (TP2ATR * ATR Value)
TP Price_3 Short = Entry Price - (TP3ATR * ATR Value)
- ATR Value: Calculated using ATR over a specified period (e.g., 14).
- TPxATR: User-defined multipliers for each take profit level.
- TPx_percent: Percentage of the position to exit at each TP level.
This multi-tiered exit strategy allows for partial position closures, optimizing profit capture while maintaining exposure to potential further gains.
█ Trade Direction
The Fibonacci ATR Fusion Strategy is designed to operate in both long and short market conditions, providing flexibility to traders in varying market environments.
Long Trades: Initiated when the SMA of the weighted average crosses above the Long Entry Threshold (T_LE), indicating strong upward momentum.
Short Trades: Initiated when the SMA of the weighted average crosses below the Short Entry Threshold (T_SE), signaling robust downward momentum.
Additionally, the strategy can be configured to trade exclusively in one direction—Long, Short, or Both—based on the trader’s preference and market analysis.
█ Usage
Implementing the Fibonacci ATR Fusion Strategy involves several steps to ensure it aligns with your trading objectives and market conditions.
1. Configure Strategy Parameters:
- Trading Direction: Choose between Long, Short, or Both based on your market outlook.
- Trading Condition Thresholds: Set the Long Entry, Short Entry, Long Exit, and Short Exit thresholds to define when to enter and exit trades.
2. Set Take Profit Levels (if enabled):
- ATR Multipliers: Define how many ATRs away from the entry price each take profit level is set.
- Take Profit Percentages: Allocate what percentage of the position to close at each TP level.
3. Apply to Desired Chart:
- Add the strategy to the chart of the asset you wish to trade.
- Observe the plotted Fibonacci ATR and SMA Fibonacci ATR indicators for visual confirmation.
4. Monitor and Adjust:
- Regularly review the strategy’s performance through backtesting.
- Adjust the input parameters based on historical performance and changing market dynamics.
5. Risk Management:
- Ensure that the sum of take profit percentages does not exceed 100% to avoid over-closing positions.
- Utilize the ATR-based TP levels to adapt to varying market volatilities, maintaining a balanced risk-reward ratio.
█ Default Settings
Understanding the default settings is crucial for optimizing the Fibonacci ATR Fusion Strategy's performance. Here's a precise and simple overview of the key parameters and their effects:
🔶 Key Parameters and Their Effects
1. Trading Direction (`tradingDirection`)
- Default: Both
- Effect: Determines whether the strategy takes both long and short positions or restricts to one direction. Selecting Both allows maximum flexibility, while Long or Short can be used for directional bias.
2. Trading Condition Thresholds
Long Entry (long_entry_threshold = 58.0): Higher values reduce false positives but may miss trades.
Short Entry (short_entry_threshold = 42.0): Lower values capture early short trends but may increase false signals.
Long Exit (long_exit_threshold = 42.0): Exits long positions early, securing profits but potentially cutting trends short.
Short Exit (short_exit_threshold = 58.0): Delays short exits to capture favorable movements, avoiding premature exits.
3. Take Profit Configuration (`useTakeProfit` = false)
- Effect: When enabled, the strategy employs a 4-step TP mechanism to secure profits at multiple levels. By default, it is disabled to allow users to opt-in based on their trading style.
4. ATR-Based Take Profit Multipliers
TP1 (tp1ATR = 3.0): Sets the first TP at 3 ATRs for initial profit capture.
TP2 (tp2ATR = 8.0): Targets larger trends, though less likely to be reached.
TP3 (tp3ATR = 14.0): Optimizes for extreme price moves, seldom triggered.
5. Take Profit Percentages
TP Level 1 (tp1_percent = 12%): Secures 12% at the first TP.
TP Level 2 (tp2_percent = 12%): Exits another 12% at the second TP.
TP Level 3 (tp3_percent = 12%): Closes an additional 12% at the third TP.
6. Weighted Average Parameters
Ratio Periods: Fibonacci-based intervals (8, 13, 21, 34, 55) balance responsiveness.
Weights: Emphasizes recent data for timely responses to market trends.
SMA Period (weighted_avg_sma_period = 3): Smoothens data with minimal lag, balancing noise reduction and responsiveness.
7. ATR Period (`atrPeriod` = 14)
Effect: Sets the ATR calculation length, impacting TP sensitivity to volatility.
🔶 Impact on Performance
- Sensitivity and Responsiveness:
- Shorter Ratio Periods and Higher Weights: Make the weighted average more responsive to recent price changes, allowing quicker trade entries and exits but increasing the likelihood of false signals.
- Longer Ratio Periods and Lower Weights: Provide smoother signals with fewer false positives but may delay trade entries, potentially missing out on significant price moves.
- Profit Taking:
- ATR Multipliers: Higher multipliers set take profit levels further away, targeting larger price movements but reducing the probability of reaching these levels.
- Fixed Percentages: Allocating equal percentages at each TP level ensures consistent profit realization and risk management, preventing overexposure.
- Trade Direction Control:
- Selecting Specific Directions: Restricting trades to Long or Short can align the strategy with market trends or personal biases, potentially enhancing performance in trending markets.
- Risk Management:
- Take Profit Percentages: Dividing the position into smaller percentages at multiple TP levels helps lock in profits progressively, reducing risk and allowing the remaining position to ride further trends.
- Market Adaptability:
- Weighted Averages and ATR: By combining multiple timeframes and adjusting to volatility, the strategy adapts to different market conditions, maintaining effectiveness across various asset classes and timeframes.
---
If you want to know more about ATR, can also check "SuperATR 7-Step Profit".
Enjoy trading.

The Flash-Strategy with Minervini Stage Analysis QualifierThe Flash-Strategy (Momentum-RSI, EMA-crossover, ATR) with Minervini Stage Analysis Qualifier
Introduction
Welcome to a comprehensive guide on a cutting-edge trading strategy I've developed, designed for the modern trader seeking an edge in today's dynamic markets. This strategy, which I've honed through my years of experience in the trading arena, stands out for its unique blend of technical analysis and market intuition, tailored specifically for use on the TradingView platform.
As a trader with a deep passion for the financial markets, my journey began several years ago, driven by a relentless pursuit of a trading methodology that is both effective and adaptable. My background in trading spans various market conditions and asset classes, providing me with a rich tapestry of experiences from which to draw. This strategy is the culmination of that journey, embodying the lessons learned and insights gained along the way.
The cornerstone of this strategy lies in its ability to generate precise long signals in a Stage 2 uptrend and equally accurate short signals in a Stage 4 downtrend. This approach is rooted in the principles of trend following and momentum trading, harnessing the power of key indicators such as the Momentum-RSI, EMA Crossover, and Average True Range (ATR). What sets this strategy apart is its meticulous design, which allows it to adapt to the ever-changing market conditions, providing traders with a robust tool for navigating both bullish and bearish scenarios.
This strategy was born out of a desire to create a trading system that is not only highly effective in identifying potential trade setups but also straightforward enough to be implemented by traders of varying skill levels. It's a reflection of my belief that successful trading hinges on clarity, precision, and disciplined execution. Whether you are a seasoned trader or just beginning your journey, this guide aims to provide you with a comprehensive understanding of how to harness the full potential of this strategy in your trading endeavors.
In the following sections, we will delve deeper into the mechanics of the strategy, its implementation, and how to make the most out of its features. Join me as we explore the nuances of a strategy that is designed to elevate your trading to the next level.
Stage-Specific Signal Generation
A distinctive feature of this trading strategy is its focus on generating long signals exclusively during Stage 2 uptrends and short signals during Stage 4 downtrends. This approach is based on the widely recognized market cycle theory, which divides the market into four stages: Stage 1 (accumulation), Stage 2 (uptrend), Stage 3 (distribution), and Stage 4 (downtrend). By aligning the signal generation with these specific stages, the strategy aims to capitalize on the most dynamic and clear-cut market movements, thereby enhancing the potential for profitable trades.
1. Long Signals in Stage 2 Uptrends
• Characteristics of Stage 2: Stage 2 is characterized by a strong uptrend, where prices are consistently rising. This stage typically follows a period of accumulation (Stage 1) and is marked by increased investor interest and bullish sentiment in the market.
• Criteria for Long Signal Generation: Long signals are generated during this stage when the technical indicators align with the characteristics of a Stage 2 uptrend.
• Rationale for Stage-Specific Signals: By focusing on Stage 2 for long trades, the strategy seeks to enter positions during the phase of strong upward momentum, thus riding the wave of rising prices and investor optimism. This stage-specific approach minimizes exposure to less predictable market phases, like the consolidation in Stage 1 or the indecision in Stage 3.
2. Short Signals in Stage 4 Downtrends
• Characteristics of Stage 4: Stage 4 is identified by a pronounced downtrend, with declining prices indicating prevailing bearish sentiment. This stage typically follows the distribution phase (Stage 3) and is characterized by increasing selling pressure.
• Criteria for Short Signal Generation: Short signals are generated in this stage when the indicators reflect a strong bearish trend.
• Rationale for Stage-Specific Signals: Targeting Stage 4 for shorting capitalizes on the market's downward momentum. This tactic aligns with the natural market cycle, allowing traders to exploit the downward price movements effectively. By doing so, the strategy avoids the potential pitfalls of shorting during the early or late stages of the market cycle, where trends are less defined and more susceptible to reversals.
In conclusion, the strategy’s emphasis on stage-specific signal generation is a testament to its sophisticated understanding of market dynamics. By tailoring the long and short signals to Stages 2 and 4, respectively, it leverages the most compelling phases of the market cycle, offering traders a clear and structured approach to aligning their trades with dominant market trends.
Strategy Overview
At the heart of this trading strategy is a philosophy centered around capturing market momentum and trend efficiency. The core objective is to identify and capitalize on clear uptrends and downtrends, thereby allowing traders to position themselves in sync with the market's prevailing direction. This approach is grounded in the belief that aligning trades with these dominant market forces can lead to more consistent and profitable outcomes.
The strategy is built on three foundational components, each playing a critical role in the decision-making process:
1. Momentum-RSI (Relative Strength Index): The Momentum-RSI is a pivotal element of this strategy. It's an enhanced version of the traditional RSI, fine-tuned to better capture the strength and velocity of market trends. By measuring the speed and change of price movements, the Momentum-RSI provides invaluable insights into whether a market is potentially overbought or oversold, suggesting possible entry and exit points. This indicator is especially effective in filtering out noise and focusing on substantial market moves.
2. EMA (Exponential Moving Average) Crossover: The EMA Crossover is a crucial component for trend identification. This strategy employs two EMAs with different timeframes to determine the market trend. When the shorter-term EMA crosses above the longer-term EMA, it signals an emerging uptrend, suggesting a potential long entry. Conversely, a crossover below indicates a possible downtrend, hinting at a short entry opportunity. This simple yet powerful tool is key in confirming trend directions and timing market entries.
3. ATR (Average True Range): The ATR is instrumental in assessing market volatility. This indicator helps in understanding the average range of price movements over a given period, thus providing a sense of how much a market might move on a typical day. In this strategy, the ATR is used to adjust stop-loss levels and to gauge the potential risk and reward of trades. It allows for more informed decisions by aligning trade management techniques with the current volatility conditions.
The synergy of these three components – the Momentum-RSI, EMA Crossover, and ATR – creates a robust framework for this trading strategy. By combining momentum analysis, trend identification, and volatility assessment, the strategy offers a comprehensive approach to navigating the markets. Whether it's capturing a strong trend in its early stages or identifying a potential reversal, this strategy aims to provide traders with the tools and insights needed to make well-informed, strategically sound trading decisions.
Detailed Component Analysis
The efficacy of this trading strategy hinges on the synergistic functioning of its three key components: the Momentum-RSI, EMA Crossover, and Average True Range (ATR). Each component brings a unique perspective to the strategy, contributing to a well-rounded approach to market analysis.
1. Momentum-RSI (Relative Strength Index)
• Definition and Function: The Momentum-RSI is a modified version of the classic Relative Strength Index. While the traditional RSI measures the velocity and magnitude of directional price movements, the Momentum-RSI amplifies aspects that reflect trend strength and momentum.
• Significance in Identifying Trend Strength: This indicator excels in identifying the strength behind a market's move. A high Momentum-RSI value typically indicates strong bullish momentum, suggesting the potential continuation of an uptrend. Conversely, a low Momentum-RSI value signals strong bearish momentum, possibly indicative of an ongoing downtrend.
• Application in Strategy: In this strategy, the Momentum-RSI is used to gauge the underlying strength of market trends. It helps in filtering out minor fluctuations and focusing on significant movements, providing a clearer picture of the market's true momentum.
2. EMA (Exponential Moving Average) Crossover
• Definition and Function: The EMA Crossover component utilizes two exponential moving averages of different timeframes. Unlike simple moving averages, EMAs give more weight to recent prices, making them more responsive to new information.
• Contribution to Market Direction: The interaction between the short-term and long-term EMAs is key to determining market direction. A crossover of the shorter EMA above the longer EMA is an indicator of an emerging uptrend, while a crossover below signals a developing downtrend.
• Application in Strategy: The EMA Crossover serves as a trend confirmation tool. It provides a clear, visual representation of the market's direction, aiding in the decision-making process for entering long or short positions. This component ensures that trades are aligned with the prevailing market trend, a crucial factor for the success of the strategy.
3. ATR (Average True Range)
• Definition and Function: The ATR is an indicator that measures market volatility by calculating the average range between the high and low prices over a specified period.
• Role in Assessing Market Volatility: The ATR provides insights into the typical market movement within a given timeframe, offering a measure of the market's volatility. Higher ATR values indicate increased volatility, while lower values suggest a calmer market environment.
• Application in Strategy: Within this strategy, the ATR is instrumental in tailoring risk management techniques, particularly in setting stop-loss levels. By accounting for the market's volatility, the ATR ensures that stop-loss orders are placed at levels that are neither too tight (risking premature exits) nor too loose (exposing to excessive risk).
In summary, the combination of Momentum-RSI, EMA Crossover, and ATR in this trading strategy provides a comprehensive toolkit for market analysis. The Momentum-RSI identifies the strength of market trends, the EMA Crossover confirms the market direction, and the ATR guides in risk management by assessing volatility. Together, these components form the backbone of a strategy designed to navigate the complexities of the financial markets effectively.
1. Signal Generation Process
• Combining Indicators: The strategy operates by synthesizing signals from the Momentum-RSI, EMA Crossover, and ATR indicators. Each indicator serves a specific purpose: the Momentum-RSI gauges trend momentum, the EMA Crossover identifies the trend direction, and the ATR assesses the market’s volatility.
• Criteria for Signal Validation: For a signal to be considered valid, it must meet specific criteria set by each of the three indicators. This multi-layered approach ensures that signals are not only based on one aspect of market behavior but are a result of a comprehensive analysis.
2. Conditions for Long Positions
• Uptrend Confirmation: A long position signal is generated when the shorter-term EMA crosses above the longer-term EMA, indicating an uptrend.
• Momentum-RSI Alignment: Alongside the EMA crossover, the Momentum-RSI should indicate strong bullish momentum. This is typically represented by the Momentum-RSI being at a high level, confirming the strength of the uptrend.
• ATR Consideration: The ATR is used to fine-tune the entry point and set an appropriate stop-loss level. In a low volatility scenario, as indicated by the ATR, the stop-loss can be set tighter, closer to the entry point.
3. Conditions for Short Positions
• Downtrend Confirmation: Conversely, a short position signal is indicated when the shorter-term EMA crosses below the longer-term EMA, signaling a downtrend.
• Momentum-RSI Confirmation: The Momentum-RSI should reflect strong bearish momentum, usually seen when the Momentum-RSI is at a low level. This confirms the bearish strength of the market.
• ATR Application: The ATR again plays a role in determining the stop-loss level for the short position. Higher volatility, as indicated by a higher ATR, would warrant a wider stop-loss to accommodate larger market swings.
By adhering to these mechanics, the strategy aims to ensure that each trade is entered with a high probability of success, aligning with the market’s current momentum and trend. The integration of these indicators allows for a holistic market analysis, providing traders with clear and actionable signals for both entering and exiting trades.
Customizable Parameters in the Strategy
Flexibility and adaptability are key features of this trading strategy, achieved through a range of customizable parameters. These parameters allow traders to tailor the strategy to their individual trading style, risk tolerance, and specific market conditions. By adjusting these parameters, users can fine-tune the strategy to optimize its performance and align it with their unique trading objectives. Below are the primary parameters that can be customized within the strategy:
1. Momentum-RSI Settings
• Period: The lookback period for the Momentum-RSI can be adjusted. A shorter period makes the indicator more sensitive to recent price changes, while a longer period smoothens the RSI line, offering a broader view of the momentum.
• Overbought/Oversold Thresholds: Users can set their own overbought and oversold levels, which can help in identifying extreme market conditions more precisely according to their trading approach.
2. EMA Crossover Settings
• Timeframes for EMAs: The strategy uses two EMAs with different timeframes. Traders can modify these timeframes, choosing shorter periods for a more responsive approach or longer periods for a more conservative one.
• Source Data: The choice of price data (close, open, high, low) used in calculating the EMAs can be varied depending on the trader’s preference.
3. ATR Settings
• Lookback Period: Adjusting the lookback period for the ATR impacts how the indicator measures volatility. A longer period may provide a more stable but less responsive measure, while a shorter period offers quicker but potentially more erratic readings.
• Multiplier for Stop-Loss Calculation: This parameter allows traders to set how aggressively or conservatively they want their stop-loss to be in relation to the ATR value.
Here are the standard settings:

BOCS Channel Scalper Strategy - Automated Mean Reversion System# BOCS Channel Scalper Strategy - Automated Mean Reversion System
## WHAT THIS STRATEGY DOES:
This is an automated mean reversion trading strategy that identifies consolidation channels through volatility analysis and executes scalp trades when price enters entry zones near channel boundaries. Unlike breakout strategies, this system assumes price will revert to the channel mean, taking profits as price bounces back from extremes. Position sizing is fully customizable with three methods: fixed contracts, percentage of equity, or fixed dollar amount. Stop losses are placed just outside channel boundaries with take profits calculated either as fixed points or as a percentage of channel range.
## KEY DIFFERENCE FROM ORIGINAL BOCS:
**This strategy is designed for traders seeking higher trade frequency.** The original BOCS indicator trades breakouts OUTSIDE channels, waiting for price to escape consolidation before entering. This scalper version trades mean reversion INSIDE channels, entering when price reaches channel extremes and betting on a bounce back to center. The result is significantly more trading opportunities:
- **Original BOCS**: 1-3 signals per channel (only on breakout)
- **Scalper Version**: 5-15+ signals per channel (every touch of entry zones)
- **Trade Style**: Mean reversion vs trend following
- **Hold Time**: Seconds to minutes vs minutes to hours
- **Best Markets**: Ranging/choppy conditions vs trending breakouts
This makes the scalper ideal for active day traders who want continuous opportunities within consolidation zones rather than waiting for breakout confirmation. However, increased trade frequency also means higher commission costs and requires tighter risk management.
## TECHNICAL METHODOLOGY:
### Price Normalization Process:
The strategy normalizes price data to create consistent volatility measurements across different instruments and price levels. It calculates the highest high and lowest low over a user-defined lookback period (default 100 bars). Current close price is normalized using: (close - lowest_low) / (highest_high - lowest_low), producing values between 0 and 1 for standardized volatility analysis.
### Volatility Detection:
A 14-period standard deviation is applied to the normalized price series to measure price deviation from the mean. Higher standard deviation values indicate volatility expansion; lower values indicate consolidation. The strategy uses ta.highestbars() and ta.lowestbars() to identify when volatility peaks and troughs occur over the detection period (default 14 bars).
### Channel Formation Logic:
When volatility crosses from a high level to a low level (ta.crossover(upper, lower)), a consolidation phase begins. The strategy tracks the highest and lowest prices during this period, which become the channel boundaries. Minimum duration of 10+ bars is required to filter out brief volatility spikes. Channels are rendered as box objects with defined upper and lower boundaries, with colored zones indicating entry areas.
### Entry Signal Generation:
The strategy uses immediate touch-based entry logic. Entry zones are defined as a percentage from channel edges (default 20%):
- **Long Entry Zone**: Bottom 20% of channel (bottomBound + channelRange × 0.2)
- **Short Entry Zone**: Top 20% of channel (topBound - channelRange × 0.2)
Long signals trigger when candle low touches or enters the long entry zone. Short signals trigger when candle high touches or enters the short entry zone. This captures mean reversion opportunities as price reaches channel extremes.
### Cooldown Filter:
An optional cooldown period (measured in bars) prevents signal spam by enforcing minimum spacing between consecutive signals. If cooldown is set to 3 bars, no new long signal will fire until 3 bars after the previous long signal. Long and short cooldowns are tracked independently, allowing both directions to signal within the same period.
### ATR Volatility Filter:
The strategy includes a multi-timeframe ATR filter to avoid trading during low-volatility conditions. Using request.security(), it fetches ATR values from a specified timeframe (e.g., 1-minute ATR while trading on 5-minute charts). The filter compares current ATR to a user-defined minimum threshold:
- If ATR ≥ threshold: Trading enabled
- If ATR < threshold: No signals fire
This prevents entries during dead zones where mean reversion is unreliable due to insufficient price movement.
### Take Profit Calculation:
Two TP methods are available:
**Fixed Points Mode**:
- Long TP = Entry + (TP_Ticks × syminfo.mintick)
- Short TP = Entry - (TP_Ticks × syminfo.mintick)
**Channel Percentage Mode**:
- Long TP = Entry + (ChannelRange × TP_Percent)
- Short TP = Entry - (ChannelRange × TP_Percent)
Default 50% targets the channel midline, a natural mean reversion target. Larger percentages aim for opposite channel edge.
### Stop Loss Placement:
Stop losses are placed just outside the channel boundary by a user-defined tick offset:
- Long SL = ChannelBottom - (SL_Offset_Ticks × syminfo.mintick)
- Short SL = ChannelTop + (SL_Offset_Ticks × syminfo.mintick)
This logic assumes channel breaks invalidate the mean reversion thesis. If price breaks through, the range is no longer valid and position exits.
### Trade Execution Logic:
When entry conditions are met (price in zone, cooldown satisfied, ATR filter passed, no existing position):
1. Calculate entry price at zone boundary
2. Calculate TP and SL based on selected method
3. Execute strategy.entry() with calculated position size
4. Place strategy.exit() with TP limit and SL stop orders
5. Update info table with active trade details
The strategy enforces one position at a time by checking strategy.position_size == 0 before entry.
### Channel Breakout Management:
Channels are removed when price closes more than 10 ticks outside boundaries. This tolerance prevents premature channel deletion from minor breaks or wicks, allowing the mean reversion setup to persist through small boundary violations.
### Position Sizing System:
Three methods calculate position size:
**Fixed Contracts**:
- Uses exact contract quantity specified in settings
- Best for futures traders (e.g., "trade 2 NQ contracts")
**Percentage of Equity**:
- position_size = (strategy.equity × equity_pct / 100) / close
- Dynamically scales with account growth
**Cash Amount**:
- position_size = cash_amount / close
- Maintains consistent dollar exposure regardless of price
## INPUT PARAMETERS:
### Position Sizing:
- **Position Size Type**: Choose Fixed Contracts, % of Equity, or Cash Amount
- **Number of Contracts**: Fixed quantity per trade (1-1000)
- **% of Equity**: Percentage of account to allocate (1-100%)
- **Cash Amount**: Dollar value per position ($100+)
### Channel Settings:
- **Nested Channels**: Allow multiple overlapping channels vs single channel
- **Normalization Length**: Lookback for high/low calculation (1-500, default 100)
- **Box Detection Length**: Period for volatility detection (1-100, default 14)
### Scalping Settings:
- **Enable Long Scalps**: Toggle long entries on/off
- **Enable Short Scalps**: Toggle short entries on/off
- **Entry Zone % from Edge**: Size of entry zone (5-50%, default 20%)
- **SL Offset (Ticks)**: Distance beyond channel for stop (1+, default 5)
- **Cooldown Period (Bars)**: Minimum spacing between signals (0 = no cooldown)
### ATR Filter:
- **Enable ATR Filter**: Toggle volatility filter on/off
- **ATR Timeframe**: Source timeframe for ATR (1, 5, 15, 60 min, etc.)
- **ATR Length**: Smoothing period (1-100, default 14)
- **Min ATR Value**: Threshold for trade enablement (0.1+, default 10.0)
### Take Profit Settings:
- **TP Method**: Choose Fixed Points or % of Channel
- **TP Fixed (Ticks)**: Static distance in ticks (1+, default 30)
- **TP % of Channel**: Dynamic target as channel percentage (10-100%, default 50%)
### Appearance:
- **Show Entry Zones**: Toggle zone labels on channels
- **Show Info Table**: Display real-time strategy status
- **Table Position**: Corner placement (Top Left/Right, Bottom Left/Right)
- **Color Settings**: Customize long/short/TP/SL colors
## VISUAL INDICATORS:
- **Channel boxes** with semi-transparent fill showing consolidation zones
- **Colored entry zones** labeled "LONG ZONE ▲" and "SHORT ZONE ▼"
- **Entry signal arrows** below/above bars marking long/short entries
- **Active TP/SL lines** with emoji labels (⊕ Entry, 🎯 TP, 🛑 SL)
- **Info table** showing position status, channel state, last signal, entry/TP/SL prices, and ATR status
## HOW TO USE:
### For 1-3 Minute Scalping (NQ/ES):
- ATR Timeframe: "1" (1-minute)
- ATR Min Value: 10.0 (for NQ), adjust per instrument
- Entry Zone %: 20-25%
- TP Method: Fixed Points, 20-40 ticks
- SL Offset: 5-10 ticks
- Cooldown: 2-3 bars
- Position Size: 1-2 contracts
### For 5-15 Minute Day Trading:
- ATR Timeframe: "5" or match chart
- ATR Min Value: Adjust to instrument (test 8-15 for NQ)
- Entry Zone %: 20-30%
- TP Method: % of Channel, 40-60%
- SL Offset: 5-10 ticks
- Cooldown: 3-5 bars
- Position Size: Fixed contracts or 5-10% equity
### For 30-60 Minute Swing Scalping:
- ATR Timeframe: "15" or "30"
- ATR Min Value: Lower threshold for broader market
- Entry Zone %: 25-35%
- TP Method: % of Channel, 50-70%
- SL Offset: 10-15 ticks
- Cooldown: 5+ bars or disable
- Position Size: % of equity recommended
## BACKTEST CONSIDERATIONS:
- Strategy performs best in ranging, mean-reverting markets
- Strong trending markets produce more stop losses as price breaks channels
- ATR filter significantly reduces trade count but improves quality during low volatility
- Cooldown period trades signal quantity for signal quality
- Commission and slippage materially impact sub-5-minute timeframe performance
- Shorter timeframes require tighter entry zones (15-20%) to catch quick reversions
- % of Channel TP adapts better to varying channel sizes than fixed points
- Fixed contract sizing recommended for consistent risk per trade in futures
**Backtesting Parameters Used**: This strategy was developed and tested using realistic commission and slippage values to provide accurate performance expectations. Recommended settings: Commission of $1.40 per side (typical for NQ futures through discount brokers), slippage of 2 ticks to account for execution delays on fast-moving scalp entries. These values reflect real-world trading costs that active scalpers will encounter. Backtest results without proper cost simulation will significantly overstate profitability.
## COMPATIBLE MARKETS:
Works on any instrument with price data including stock indices (NQ, ES, YM, RTY), individual stocks, forex pairs (EUR/USD, GBP/USD), cryptocurrency (BTC, ETH), and commodities. Volume-based features require data feed with volume information but are optional for core functionality.
## KNOWN LIMITATIONS:
- Immediate touch entry can fire multiple times in choppy zones without adequate cooldown
- Channel deletion at 10-tick breaks may be too aggressive or lenient depending on instrument tick size
- ATR filter from lower timeframes requires higher-tier TradingView subscription (request.security limitation)
- Mean reversion logic fails in strong breakout scenarios leading to stop loss hits
- Position sizing via % of equity or cash amount calculates based on close price, may differ from actual fill price
- No partial closing capability - full position exits at TP or SL only
- Strategy does not account for gap openings or overnight holds
## RISK DISCLOSURE:
Trading involves substantial risk of loss. Past performance does not guarantee future results. This strategy is for educational purposes and backtesting only. Mean reversion strategies can experience extended drawdowns during trending markets. Stop losses may not fill at intended levels during extreme volatility or gaps. Thoroughly test on historical data and paper trade before risking real capital. Use appropriate position sizing and never risk more than you can afford to lose. Consider consulting a licensed financial advisor before making trading decisions. Automated trading systems can malfunction - monitor all live positions actively.
## ACKNOWLEDGMENT & CREDITS:
This strategy is built upon the channel detection methodology created by **AlgoAlpha** in the "Smart Money Breakout Channels" indicator. Full credit and appreciation to AlgoAlpha for pioneering the normalized volatility approach to identifying consolidation patterns. The core channel formation logic using normalized price standard deviation is AlgoAlpha's original contribution to the TradingView community.
Enhancements to the original concept include: mean reversion entry logic (vs breakout), immediate touch-based signals, multi-timeframe ATR volatility filtering, flexible position sizing (fixed/percentage/cash), cooldown period filtering, dual TP methods (fixed points vs channel percentage), automated strategy execution with exit management, and real-time position monitoring table.

Deadband Hysteresis Supertrend [BackQuant]Deadband Hysteresis Supertrend
A two-stage trend tool that first filters price with a deadband baseline, then runs a Supertrend around that baseline with optional flip hysteresis and ATR-based adverse exits.
What this is
A hybrid of two ideas:
Deadband Hysteresis Baseline that only advances when price pulls far enough from the baseline to matter. This suppresses micro noise and gives you a stable centerline.
Supertrend bands wrapped around that baseline instead of raw price. Flips are further gated by an extra margin so side changes are more deliberate.
The goal is fewer whipsaws in chop and clearer regime identification during trends.
How it works (high level)
Deadband step — compute a per-bar “deadband” size from one of four modes: ATR, Percent of price, Ticks, or Points. If price deviates from the baseline by more than this amount, move the baseline forward by a fraction of the excess. If not, hold the line.
Centered Supertrend — build upper and lower bands around the baseline using ATR and a user factor. Track the usual trailing logic that tightens a band while price moves in its favor.
Flip hysteresis — require price to exceed the active band by an extra flip offset × ATR before switching sides. This adds stickiness at the boundary.
Adverse exit — once a side is taken, trigger an exit if price moves against the entry by K × ATR .
If you would like to check out the filter by itself:
What it plots
DBHF baseline (optional) as a smooth centerline.
DBHF Supertrend as the active trailing band.
Candle coloring by trend side for quick read.
Signal markers 𝕃 and 𝕊 at flips plus ✖ on adverse exits.
Inputs that matter
Price Source — series being filtered. Close is typical. HL2 or HLC3 can be steadier.
Deadband mode — ATR, Percent, Ticks, or Points. This defines the “it’s big enough to matter” zone.
ATR Length / Mult (DBHF) — only used when mode = ATR. Larger values widen the do-nothing zone.
Percent / Ticks / Points — alternatives to ATR; pick what fits your market’s convention.
Enter Mult — scales the deadband you must clear before the baseline moves. Increase to filter more noise.
Response — fraction of the excess applied to baseline movement. Higher responds faster; lower is smoother.
Supertrend ATR Period & Factor — traditional band size controls; higher factor widens and flips less often.
Flip Offset ATR — extra ATR buffer required to flip. Useful in choppy regimes.
Adverse Stop K·ATR — per-trade danger brake that forces an exit if price moves K×ATR against entry.
UI — toggle baseline, supertrend, signals, and bar painting; choose long and short colors.
How to read it
Green regime — candles painted long and the Supertrend running below price. Pullbacks toward the baseline that fail to breach the opposite band often resume higher.
Red regime — candles painted short and the Supertrend running above price. Rallies that cannot reclaim the band may roll over.
Frequent side swaps — reduce sensitivity by increasing Enter Mult, using ATR mode, raising the Supertrend factor, or adding Flip Offset ATR.
Use cases
Bias filter — allow entries only in the direction of the current side. Use your preferred triggers inside that bias.
Trailing logic — treat the active band as a dynamic stop. If the side flips or an adverse K·ATR exit prints, reduce or close exposure.
Regime map — on higher timeframes, the combination baseline + band produces a clean up vs down template for allocation decisions.
Tuning guidance
Fast markets — ATR deadband, modest Enter Mult (0.8–1.2), response 0.2–0.35, Supertrend factor 1.7–2.2, small Flip Offset (0.2–0.5 ATR).
Choppy ranges — widen deadband or raise Enter Mult, lower response, and add more Flip Offset so flips require stronger evidence.
Slow trends — longer ATR periods and higher Supertrend factor to keep you on side longer; use a conservative adverse K.
Included alerts
DBHF ST Long — side flips to long.
DBHF ST Short — side flips to short.
Adverse Exit Long / Short — K·ATR stop triggers against the current side.
Strengths
Deadbanded baseline reduces micro whipsaws before Supertrend logic even begins.
Flip hysteresis adds a second layer of confirmation at the boundary.
Optional adverse ATR stop provides a uniform risk cut across assets and regimes.
Clear visuals and minimal parameters to adjust for symbol behavior.
Putting it together
Think of this tool as two decisions layered into one view. The deadband baseline answers “does this move even count,” then the Supertrend wrapped around that baseline answers “if it counts, which side should I be on and where do I flip.” When both parts agree you tend to stay on the correct side of a trend for longer, and when they disagree you get an early warning that conditions are changing.
When the baseline bends and price cannot reclaim the opposite band , momentum is usually continuing. Pullbacks into the baseline that stall before the far band often resolve in trend.
When the baseline flattens and the bands compress , expect indecision. Use the Flip Offset ATR to avoid reacting to the first feint. Wait for a clean band breach with follow through.
When an adverse K·ATR exit prints while the side has not flipped , treat it as a risk event rather than a full regime change. Many users cut size, re-enter only if the side reasserts, and let the next flip confirm a new trend.
Final thoughts
Deadband Hysteresis Supertrend is best read as a regime lens. The baseline defines your tolerance for noise, the bands define your trailing structure, and the flip offset plus adverse ATR stop define how forgiving or strict you want to be at the boundary. On strong trends it helps you hold through shallow shakeouts. In choppy conditions it encourages patience until price does something meaningful. Start with settings that reflect the cadence of your market, observe how often flips occur, then nudge the deadband and flip offset until the tool spends most of its time describing the move you care about rather than the noise in between.

WRAMA Channel (Weighted RSI ATR MA)OVERVIEW
The WRAMA Channel (Weighted RSI ATR MA) is an advanced technical analysis tool designed to react more quickly to price movements compared to indicators using conventional moving averages. It combines the Relative Strength Index (RSI), Average True Range (ATR), and a weighted moving average, resulting in the WRAMA. This indicator forms a dynamic price channel based on a weighted average that incorporates both trend strength (via RSI) and market volatility (via ATR). It helps traders identify trends, potential reversals, and breakout signals, while offering broad customization options.
Key Features
WRAMA Price Channel:
Generates a dynamic channel around the weighted moving average (WRAMA), adapting to market volatility and momentum, similar to Bollinger Bands. Users are encouraged to adjust channel width and length according to their strategy.
The upper and lower channel bands are calculated based on a percentage deviation from the baseline line.
The channel fill color changes depending on the price's position relative to the baseline (green above, red below), with an optional gradient for better visualization.
Weighted Moving Average (WRAMA):
WRAMA is a custom weighted moving average (MA1), where closing prices are weighted based on RSI and ATR, allowing it to dynamically adapt to market conditions.
Baseline: The WRAMA line calculated over a user-defined period.
WRAMA Calculation:
RSI Weight: Based on RSI value. When RSI is in extreme zones (below the lower threshold or above the upper threshold), an extreme weight is applied. Otherwise, the weight is based on the squared RSI value divided by 100, raised to a power defined by the rsi_weight_factor.
ATR Weight: Based on the ATR-to-average-ATR ratio. If ATR exceeds a threshold (atr_threshold × avg_atr), an extreme weight is applied. Otherwise, the weight is based on the squared ratio of ATR to average ATR, raised to the power of the atr_weight_factor.
Combined Weight: RSI and ATR weights are combined using a rsi_atr_balance parameter. Final weight = RSI weight × balance + ATR weight × (1 - balance).
WRAMA Calculation: The closing price is multiplied by the combined weight. The result is averaged over the ma_length period and divided by the average of the weights, forming the WRAMA line. For current WRAMA (ma_length = 1), the calculation simplifies to a single weighted price.
Additional Moving Averages:
For additional confirmations, the indicator supports up to five moving averages (MA1–MA5) with various types (SMA, EMA, WMA, HMA, ALMA) and customizable periods.
All additional MAs are calculated based on WRAMA or its baseline, ensuring consistency and enabling deeper analysis within a unified methodology. MA trend directions can be tracked in a built-in signal table.
Trading Signals:
Breakout Signals: Breakouts above/below the channel are optionally marked with triangle shapes (green for bullish, red for bearish).
MA Signals: Price position relative to MAs or their slope generates bullish/bearish signals. These are optionally visualized with default triangles (green up, red down).
A signal table in the top-right corner summarizes the status of each moving average – bullish, bearish, or neutral.
Customization Options
Channel Settings:
MA Period: Length of the WRAMA baseline (default: 100).
Channel Deviation : Percentage offset from the baseline for upper/lower bands (default: 1.5%).
RSI Settings:
RSI Period: Length of the RSI calculation (default: 14).
RSI Upper/Lower Threshold: Overbought/oversold levels (default: 70/30).
RSI Weight Factor: Influence of RSI on weighting (default: 2.0).
ATR Settings:
ATR Period: ATR calculation length (default: 14).
ATR Threshold: Volatility threshold as a multiple of average ATR (default: 1.5).
ATR Weight Factor: Influence of ATR on weighting (default: 2.0).
RSI & ATR Combined:
Extreme Weight: Weight applied in extreme RSI/ATR conditions (default: 3.0).
RSI/ATR Balance: Balance between RSI and ATR influence (default: 0.5).
Signal Settings:
Show Breakout Signals: Enable/disable breakout triangles.
Show MA Signals: Enable/disable MA-based signals.
MA Signal Source: Choose between current WRAMA or baseline.
MA Signal Analysis: Based on price position or slope.
Neutral Threshold : Minimum distance from MA for signal neutrality (default: 0.5%).
Minimum MA Slope : Minimum slope for trend direction signals (default: 0.01%).
Moving Averages (MA1–MA5):
Options to enable/disable, select type (SMA, EMA, WMA, HMA, ALMA), set period length, and choose color.
Style Settings:
Gradient Fill: Enable/disable gradient coloring within the channel.
Show Baseline: Enable/disable WRAMA baseline visibility.
Colors: Customize line, fill, and signal colors.
Use Cases
Trend Identification: The WRAMA channel highlights trend direction and potential reversal zones when price contacts the channel edges.
Breakout Signals: Channel breakouts may indicate trend shifts or momentum surges.
MA Analysis: The signal table provides a clear summary of market direction (bullish, bearish, or neutral) based on selected moving averages.
Trading Strategies: Suitable for trend-following, mean-reversion, and scalping strategies, depending on user preferences and settings.
Notes
The indicator offers a high degree of flexibility, making it adaptable to various trading styles, instruments, and timeframes.
It is recommended to adjust channel length and width to fit your trading strategy.
Backtesting settings on historical data is advised to optimize parameters for a specific strategy and market.

ALEX - ATR Extensions + ADR + TableALEX - ATR Extensions + ADR + Table
Overview
The ALEX ATR Extensions indicator is a comprehensive volatility and momentum analysis tool that combines Average True Range (ATR), Average Daily Range (ADR), and moving average distance calculations in a single, customizable display. This indicator helps traders assess current price action relative to historical volatility and key moving averages, providing crucial context for risk management and trade planning.
Key Features
Multi-Metric Analysis
- ATR Percentage: Current ATR as a percentage of price for volatility assessment
- ADR Percentage: Average Daily Range as a percentage for typical daily movement
- Low of Day Distance: Distance from current price to daily low
- Moving Average Distance: ATR-normalized distance from 21 and 50 period moving averages
Flexible Moving Average Options
- Configurable MA Types: Choose between EMA or SMA for both 21 and 50 period averages
- Customizable Periods: Adjust moving average lengths to suit your trading style
- Daily Timeframe Data: Uses daily moving averages regardless of chart timeframe
ATR Extension Levels
- Dynamic Price Targets: Calculate extension levels based on ATR multiples from moving averages
- Visual Reference Lines: Optional overlay lines showing ATR extension targets
- Customizable Multipliers: Adjust ATR multipliers for different risk/reward scenarios
Smart Visual Alerts
- Color-Coded Distance Metrics: Automatic color changes based on distance thresholds
- Symbol Plotting: Customizable chart symbols when distance thresholds are exceeded
- Threshold-Based Alerts: Visual cues when price reaches significant ATR distances
Comprehensive Data Table
- Real-Time Metrics: Live updating table with all key measurements
- Customizable Display: Toggle individual metrics on/off based on preference
- Professional Styling: Adjustable colors, fonts, and transparency
How to Use
Volatility Assessment
- High ATR%: Indicates elevated volatility, larger position sizing considerations
- Low ATR%: Suggests compressed volatility, potential for expansion
- ADR% Comparison: Compare current day's range to historical average
Moving Average Analysis
- ATR Distance 21/50: Normalized distance showing how extended price is from key levels
- Positive Values: Price above moving average (bullish positioning)
- Negative Values: Price below moving average (bearish positioning)
- Color Changes: Automatic alerts when reaching threshold levels
Extension Target Planning
- ATR Extension Lines: Visual price targets based on volatility-adjusted projections
- Risk/Reward Planning: Use extension levels for profit target placement
- Breakout Confirmation: Extension levels can confirm breakout validity
Symbol Alert System
- Chart Symbols: Automatic plotting when distance thresholds are breached
- Customizable Triggers: Set your own threshold levels for alerts
- Visual Scanning: Quick identification of extended conditions across multiple charts
Settings
Display Controls
- Show ADR%: Toggle average daily range percentage display
- Show ATR%: Toggle average true range percentage display
- Show LoD Distance: Toggle low of day distance calculation
- Show LoD Price: Toggle actual low of day price display
- Show ATR Distance from 21/50 DMA: Toggle moving average distance metrics
- Show 21/50 DMA Price: Toggle actual moving average price display
- Show ATR Extension Levels: Toggle extension target display in table
Moving Average Configuration
- 21/50 DMA Type: Choose between EMA or SMA calculation methods
- 21/50 DMA Period: Customize moving average lengths
- ADR/ATR Length: Adjust calculation periods for range measurements
Color Thresholds
- Threshold Levels: Set distance levels for color changes (default 2.0 and 5.0)
- Custom Colors: Choose colors for different threshold breaches
- Separate 21/50 Settings: Independent color schemes for each moving average
Symbol Settings
- Show Char Symbol: Toggle symbol plotting for each moving average
- Custom Symbols: Choose any character for chart plotting
- Symbol Colors: Customize colors for visual distinction
- Threshold Levels: Set trigger points for symbol appearance
ATR Extension Lines
- Show Extension Lines: Toggle visual extension level lines
- ATR Multipliers: Customize extension distance (default 2.0x)
- Line Colors: Choose colors for extension level visualization
Table Customization
- Background Color: Adjust table transparency and color
- Text Color: Customize default text appearance
- Font Size: Choose from tiny to huge font options
Advanced Applications
Trend Strength Analysis
- Large ATR distances suggest strong trending moves
- Small ATR distances indicate potential consolidation or reversal zones
- Compare current readings to recent historical ranges
Risk Management
- Use ATR% for position sizing calculations
- Extension levels provide natural profit target zones
- Distance metrics help identify overextended conditions
Multi-Timeframe Context
- Apply to different timeframes for comprehensive analysis
- Daily data provides consistency across all chart intervals
- Combine with weekly/monthly analysis for broader context
Market Regime Identification
- High volatility periods: Increased ATR% readings
- Low volatility periods: Compressed ATR% readings
- Trending markets: Sustained high distance readings
- Consolidating markets: Low distance readings with frequent color changes
Best Practices
Volatility-Adjusted Trading
- Increase position sizes during low volatility periods
- Reduce position sizes during high volatility periods
- Use ATR% for stop-loss placement relative to normal market movement
Extension Level Usage
- Primary targets: 1.5-2.0x ATR extensions
- Secondary targets: 2.5-3.0x ATR extensions
- Avoid chasing prices beyond 3x ATR extensions
Threshold Optimization
- Backtest different threshold levels for your trading style
- Consider market conditions when setting alert levels
- Adjust thresholds based on instrument volatility characteristics
Integration Strategies
- Combine with momentum indicators for confirmation
- Use alongside support/resistance levels
- Incorporate into systematic trading approaches
Technical Specifications
- Compatible with Pine Script v6
- Uses daily timeframe data for consistency
- Optimized for real-time performance
- Works on all chart types and timeframes
- Supports all tradeable instruments
Ideal For
- Swing traders using daily charts
- Position traders seeking volatility context
- Day traders needing intraday reference levels
- Risk managers requiring volatility metrics
- Systematic traders building rule-based strategies
Disclaimer
This indicator is for educational and informational purposes only. It should not be used as the sole basis for trading decisions. Always combine with other forms of analysis, proper risk management techniques, and consider your individual trading plan and risk tolerance. Past performance does not guarantee future results.
Compatible with Pine Script v6 | Optimized for daily timeframe analysis | Works across all markets and instruments

AE - ATR Exhaustion ChannelAE - ATR Exhaustion Channel
📈 Overview
Identify Exhaustion Zones & Trend Breakouts with ATR Precision!
The AE - ATR Exhaustion Channel is a powerful volatility-based trading tool that combines an averaged SMA with ATR bands to dynamically highlight potential trend exhaustion zones. It provides real-time breakout detection by marking when price moves beyond key volatility bands, helping traders spot overextensions and reversals with ease.
🔑 Key Features
✔️ ATR-SMA Hybrid Channel: Uses an averaged SMA as the core trend filter while incorporating adaptive ATR-based bands for precise volatility tracking.
✔️ Dynamic Exhaustion Markers: Marks red crosses when price exceeds the upper band and green crosses when price drops below the lower band.
✔️ Customizable ATR Sensitivity: Adjust the ATR multiplier and length settings to fine-tune band sensitivity based on market conditions.
✔️ Clear Channel Visualization: A gray SMA midpoint and a blue-filled ATR band zone make it easy to track market structure.
📚 How It Works
1️⃣ Averaged SMA Calculation: The script calculates an averaged SMA over a user-defined range (min/max period). This smooths out short-term fluctuations while preserving trend direction.
2️⃣ ATR Band Construction: The ATR value (adjusted by a multiplier) is added to/subtracted from the SMA to form dynamic upper and lower volatility bands.
3️⃣ Exhaustion Detection:
If high > upper ATR band, a red cross is plotted (potential overextension).
If low < lower ATR band, a green cross is plotted (potential reversal zone).
4️⃣ Filled ATR Channel: The area between the upper and lower bands is shaded blue, providing a visual trading range.
🎨 Customization & Settings
⚙️ ATR Length – Adjusts the ATR calculation period (default: 14).
⚙️ ATR Multiplier – Scales the ATR bands for tighter or wider volatility tracking (default: 0.8, adjustable in 0.1 steps).
⚙️ SMA Range (Min/Max Length) – Defines the period range for calculating the averaged SMA (default: 5-20).
⚙️ Rolling Lookback Length – Controls how far back the high/low comparison is calculated (default: 50 bars).
🚀 Practical Usage
📌 Spotting Exhaustion Zones – Look for red/green markers appearing outside the ATR bands, signaling potential trend exhaustion and possible reversal opportunities.
📌 Breakout Confirmation – Price consistently breaching the upper band with momentum could indicate continuation, while repeated touches without strong closes may hint at reversal zones.
📌 Trend Reversal Signals – Watch for green markers below the lower band in uptrends (buy signals) and red markers above the upper band in downtrends (sell signals).
🔔 Alerts & Notifications
📢 Set Alerts for Exhaustion Signals!
Traders can configure alerts to trigger when price breaches the ATR bands, allowing for instant notifications when volatility-based exhaustion is detected.
📊 Example Scenarios
✔ Trend Exhaustion in Overextended Moves – A series of red crosses near resistance may indicate a short opportunity.
✔ Trend Exhaustion in Overextended Moves – A series of red crosses near resistance may indicate an opportunity to open a short trade.
✔ Volatility Compression Breakouts – If price consolidates within the ATR bands and suddenly breaks out, it could signify a momentum shift.
✔ Reversal Catching in Trending Markets – Spot potential trend reversals by looking for green markers below the ATR bands in bullish markets.
🌟 Why Choose AE - ATR Exhaustion Channel?
Trade with Confidence. Spot Volatility. Catch Breakouts.
The AE - ATR Exhaustion Channel is an essential tool for traders looking to identify trend exhaustion, detect breakouts, and manage volatility effectively. Whether you're trading stocks, crypto, or forex, this ATR-SMA hybrid system provides clear visual cues to help you stay ahead of market moves.
✅ Customizable to Fit Any Market
✅ Combines Volatility & Trend Analysis
✅ Easy-to-Use with Instant Breakout Detection
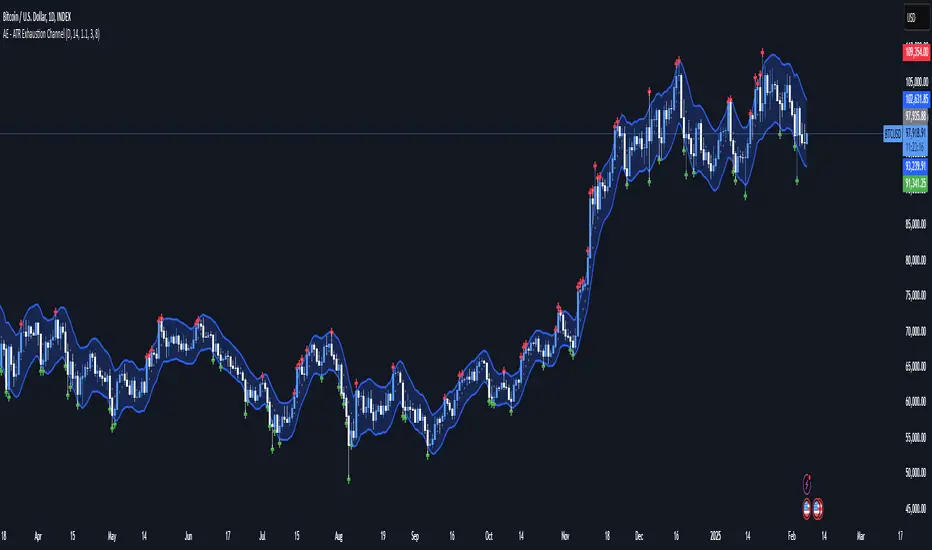
MACD Cloud with Moving Average and ATR BandsThe algorithm implements a technical analysis indicator that combines the MACD Cloud, Moving Averages (MA), and volatility bands (ATR) to provide signals on market trends and potential reversal points. It is divided into several sections:
🎨 Color Bars:
Activated based on user input.
Controls bar color display according to price relative to ATR levels and moving average (MA).
Logic:
⚫ Black: Potential bearish reversal (price above the upper ATR band).
🔵 Blue: Potential bullish reversal (price below the lower ATR band).
o
🟢 Green: Bullish trend (price between the MA and upper ATR band).
o
🔴 Red: Bearish trend (price between the lower ATR band and MA).
o
📊 MACD Bars:
Description:
The MACD Bars section is activated by default and can be modified based on user input.
🔴 Red: Indicates a bearish trend, shown when the MACD line is below the Signal line (Signal line is a moving average of MACD).
🔵 Blue: Indicates a bullish trend, shown when the MACD line is above the Signal line.
Matching colors between MACD Bars and MACD Cloud visually confirms trend direction.
MACD Cloud Logic: The MACD Cloud is based on Moving Average Convergence Divergence (MACD), a momentum indicator showing the relationship between two moving averages of price.
MACD and Signal Lines: The cloud visualizes the MACD line relative to the Signal line. If the MACD line is above the Signal line, it indicates a potential bullish trend, while below it suggests a potential bearish trend.
☁️ MA Cloud:
The MA Cloud uses three moving averages to analyze price direction:
Moving Average Relationship: Three MAs of different periods are plotted. The cloud turns green when the shorter MA is above the longer MA, indicating an uptrend, and red when below, suggesting a downtrend.
Trend Visualization: This graphical representation shows the trend direction.
📉 ATR Bands:
The ATR bands calculate overbought and oversold limits using a weighted moving average (WMA) and ATR.
Center (matr): Shows general trend; prices above suggest an uptrend, while below indicate a downtrend.
Up ATR 1: Marks the first overbought level, suggesting a potential bearish reversal if the price moves above this band.
Down ATR 1: Marks the first oversold level, suggesting a possible bullish reversal if the price moves below this band.
Up ATR 2: Extends the overbought range to an extreme, reinforcing the possibility of a bearish reversal at this level.
Down ATR 2: Extends the oversold range to an extreme, indicating a stronger bullish reversal possibility if price reaches here.
Español:
El algoritmo implementa un indicador de análisis técnico que combina la nube MACD, promedios móviles (MA) y bandas de volatilidad (ATR) para proporcionar señales sobre tendencias del mercado y posibles puntos de reversión. Se divide en varias secciones:
🎨 Barras de Color:
- Activado según la entrada del usuario.
- Controla la visualización del color de las barras según el precio en relación con los niveles de ATR y el promedio móvil (MA).
- **Lógica:**
- ⚫ **Negro**: Reversión bajista potencial (precio por encima de la banda superior ATR).
- 🔵 **Azul**: Reversión alcista potencial (precio por debajo de la banda inferior ATR).
- 🟢 **Verde**: Tendencia alcista (precio entre el MA y la banda superior ATR).
- 🔴 **Rojo**: Tendencia bajista (precio entre la banda inferior ATR y el MA).
### 📊 Barras MACD:
- **Descripción**:
- La sección de barras MACD se activa por defecto y puede modificarse según la entrada del usuario.
- 🔴 **Rojo**: Indica una tendencia bajista, cuando la línea MACD está por debajo de la línea de señal (la línea de señal es una media móvil de la MACD).
- 🔵 **Azul**: Indica una tendencia alcista, cuando la línea MACD está por encima de la línea de señal.
- La coincidencia de colores entre las barras MACD y la nube MACD confirma visualmente la dirección de la tendencia.
### 🌥️ Nube MACD:
- **Lógica de la Nube MACD**: Basada en el indicador de convergencia-divergencia de medias móviles (MACD), que muestra la relación entre dos medias móviles del precio.
- **Líneas MACD y de Señal**: La nube visualiza la relación entre la línea MACD y la línea de señal. Si la línea MACD está por encima de la de señal, indica una tendencia alcista potencial; si está por debajo, sugiere una tendencia bajista.
### ☁️ Nube MA:
- **Relación entre Medias Móviles**: Se trazan tres medias móviles de diferentes períodos. La nube se vuelve verde cuando la media más corta está por encima de la más larga, indicando una tendencia alcista, y roja cuando está por debajo, sugiriendo una tendencia bajista.
- **Visualización de Tendencias**: Proporciona una representación gráfica de la dirección de la tendencia.
### 📉 Bandas ATR:
- Las bandas ATR calculan límites de sobrecompra y sobreventa usando una media ponderada y el ATR.
- **Centro (matr)**: Muestra la tendencia general; precios por encima indican tendencia alcista y debajo, bajista.
- **Up ATR 1**: Marca el primer nivel de sobrecompra, sugiriendo una reversión bajista potencial si el precio sube por encima de esta banda.
- **Down ATR 1**: Marca el primer nivel de sobreventa, sugiriendo una reversión alcista potencial si el precio baja por debajo de esta banda.
- **Up ATR 2**: Amplía el rango de sobrecompra a un nivel extremo, reforzando la posibilidad de reversión bajista.
- **Down ATR 2**: Extiende el rango de sobreventa a un nivel extremo, sugiriendo una reversión alcista más fuerte si el precio alcanza esta banda.
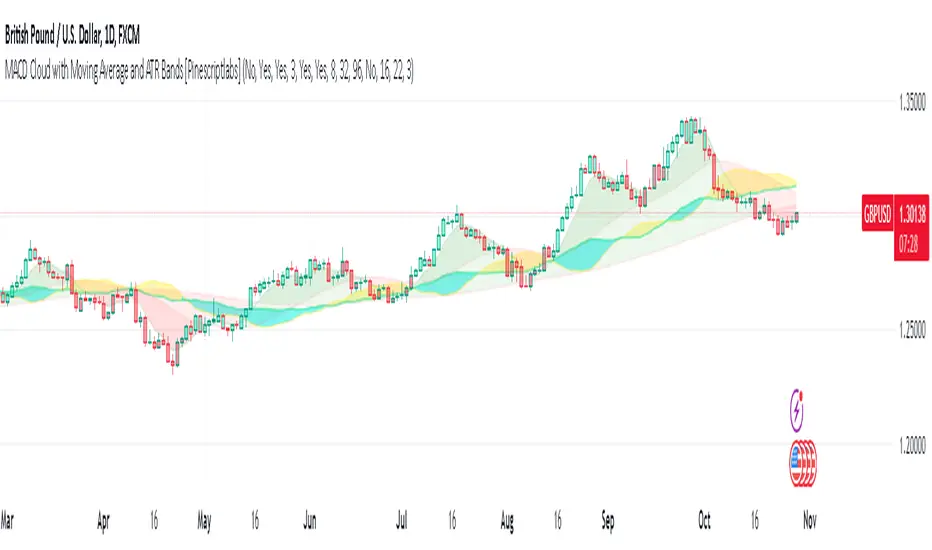
Lsma ATR | viResearchLsma ATR | viResearch
Conceptual Foundation and Innovation
The "Lsma ATR" indicator from viResearch combines the power of the Least Squares Moving Average (LSMA) with the Average True Range (ATR) to offer traders a dynamic approach to trend analysis and volatility management. The LSMA is highly regarded for its ability to fit a linear regression line to price data, providing a smooth and precise trend line with minimal lag. When paired with the ATR, which measures market volatility, this indicator not only tracks trend direction but also adapts to changes in volatility. The integration of both elements allows traders to identify potential trend reversals and assess the strength of trends in the context of market volatility. This combination makes the "Lsma ATR" a versatile tool for following trends while managing risk, as it responds quickly to changes in price direction while accounting for shifts in market volatility.
Technical Composition and Calculation
The "Lsma ATR" script consists of two primary components: the Least Squares Moving Average (LSMA) and the Average True Range (ATR). The LSMA is calculated over a user-defined length, providing a smoothed representation of the market trend based on linear regression. The ATR, also user-defined, is used to measure market volatility by calculating the average range between high and low prices over a specified period. By adding and subtracting the ATR from the LSMA, the indicator creates upper and lower boundaries that help define the market's current volatility-adjusted range. The script monitors for price crossovers with these boundaries to generate trend signals. When the price crosses above the upper boundary, it signals a potential upward trend. Conversely, when the price crosses below the lower boundary, it signals a possible downward trend. These boundaries dynamically adjust based on volatility, providing more accurate signals as market conditions change.
Features and User Inputs
The "Lsma ATR" script offers several customizable inputs, allowing traders to fine-tune the indicator to their trading preferences. The LSMA Length controls the lookback period for the LSMA, determining how smooth or responsive the trend line is. The ATR Length defines the period used for calculating the average volatility, affecting the width of the volatility-adjusted range. Additionally, the indicator includes alert conditions that notify traders when a trend shift occurs, either to the upside or downside.
Practical Applications
The "Lsma ATR" indicator is designed for traders who want to follow market trends while accounting for changes in volatility. The LSMA provides a clear, smoothed trend line that helps identify the direction of the market, while the ATR adjusts the boundaries based on the current volatility level. This combination makes the indicator particularly effective for detecting trend reversals, as the LSMA tracks the overall trend direction and price crossovers with the ATR boundaries provide early signals of potential trend changes. It also helps manage risk by understanding market volatility, allowing traders to adjust their strategies based on the strength of price movements. The indicator improves trend-following strategies by combining LSMA’s trend detection with ATR’s volatility adjustment, offering a nuanced approach in various market conditions.
Advantages and Strategic Value
The "Lsma ATR" script offers significant value by integrating the precision of the LSMA with the adaptability of the ATR. This dual approach allows traders to reduce noise in price data while responding to changes in volatility, leading to more accurate trend signals. The volatility-adjusted boundaries provide a dynamic range that helps traders avoid false signals and stay aligned with stronger trends. This makes the "Lsma ATR" an ideal tool for traders seeking to enhance their trend-following strategies while accounting for market volatility.
Alerts and Visual Cues
The script includes alert conditions that notify traders when the price crosses the ATR boundaries, signaling a potential trend change. The "Lsma ATR Long" alert is triggered when the price crosses above the upper boundary, indicating a potential upward trend, while the "Lsma ATR Short" alert signals a possible downward trend when the price crosses below the lower boundary. Visual cues, such as changes in the color of the LSMA line and shaded areas between the ATR boundaries, help traders quickly identify these trend shifts.
Summary and Usage Tips
The "Lsma ATR | viResearch" indicator combines the smoothing benefits of the LSMA with the volatility sensitivity of the ATR, providing traders with a robust tool for trend detection and volatility management. By incorporating this script into your trading strategy, you can improve your ability to detect trend reversals, confirm trend direction, and manage risk by adjusting to market volatility. The "Lsma ATR" offers a reliable and customizable solution for traders looking to enhance their technical analysis in both trending and volatile market environments.
Note: Backtests are based on past results and are not indicative of future performance.
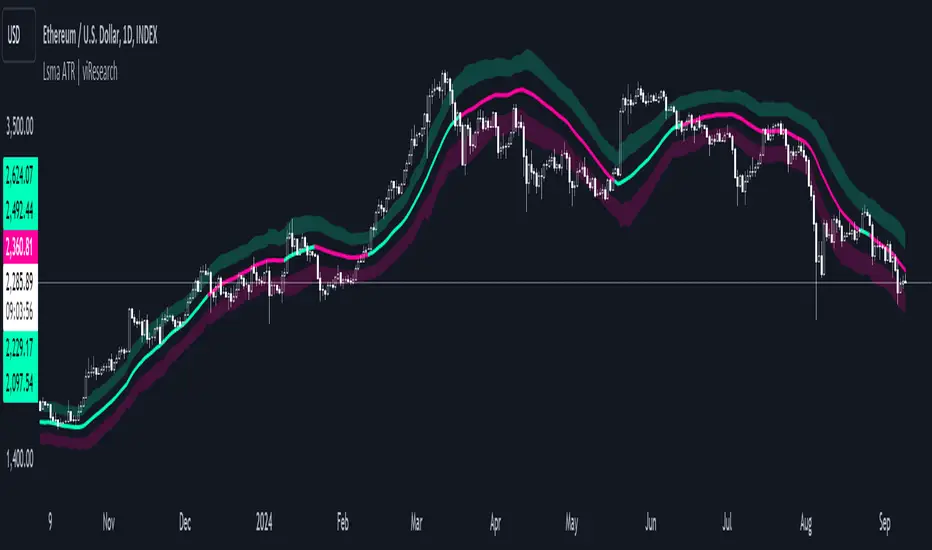
Omega ATR Indicator📖 Introduction
The Ω ATR Indicator was created to provide a more complete and professional framework for volatility analysis than the classic Average True Range (ATR).
While the traditional ATR is a useful tool, it has limitations: it delivers a simple rolling average of volatility, but it does not adapt to market regimes, it does not highlight extreme events, and it often leaves the trader with incomplete information about risk.
The Ω ATR takes the same foundation and elevates it into a multi-dimensional volatility dashboard, adding statistical layers, adaptive calculations, and clear visual references that allow traders to interpret volatility in a way that is immediately actionable.
🔎 What makes it different from a standard ATR?
This indicator introduces several features beyond the classic formula:
True Range Core – plots the raw True Range (TR) for each bar, providing a direct, bar-by-bar view of volatility impulses.
Standard & Adjusted ATR – includes both the conventional ATR (smoothed average) and an Adjusted ATR that automatically corrects for extreme conditions by incorporating percentile rescaling.
Percentile Volatility Levels – dynamically calculated extreme thresholds (99.8%, 75%, 50%, 25%), plotted as dotted levels across the chart. These act as reference lines for “normal” vs. “abnormal” volatility, useful for spotting unusual price expansions or contractions.
Linear Regression Volatility Trend – overlays a regression line of volatility, showing whether the market is moving toward expansion (rising vol), contraction (falling vol), or stability.
Monetary Value Translation – the indicator converts volatility into points, ticks, and dollar values (based on the instrument’s point value). This allows futures traders and high-value instruments users to immediately see how much volatility is “worth” in cash terms.
Interactive Table Display – a real-time statistics table is displayed directly on the chart, showing:
SMA of ATR in $ and points
Percentile-based volatility range (VAR) in $ and points
Tick equivalences, for quick position sizing
⚡ How traders can use it
The Ω ATR Indicator is designed to be versatile, fitting both discretionary traders and systematic strategy developers.
Risk Management: ATR-based stop losses and position sizing are significantly improved by using the adjusted ATR and percentile thresholds. Traders can size their positions according to volatility regimes, not just raw averages.
Breakout & Exhaustion Detection: When TR or ATR values spike above the 99.8% or 95% percentile levels, this often corresponds to breakout conditions or volatility exhaustion — useful for breakout strategies, mean-reversion setups, and volatility fades.
Market Regime Identification: The regression line helps distinguish if volatility is rising (trending environment, larger swings expected) or compressing (range-bound environment, lower risk opportunities).
Multi-Asset Flexibility: Works equally well on equities, futures, crypto, and FX. Its point/tick/dollar conversion makes it especially powerful for futures traders who need to quantify risk precisely.
Scalping to Swing Trading: On lower timeframes, it acts as a micro-volatility detector; on higher timeframes, it functions as a strategic risk gauge for position management.
⚙️ Settings and Customization
Length: The ATR lookback period (default = 34).
Shorter lengths (14–21) for intraday traders who want fast response.
Longer lengths (34–55) for swing/position traders who want smoother readings.
AVG / ADJ AVG: Toggle to display the standard ATR or the adjusted ATR.
Volatility Levels: Enable/disable up to 4 percentile-based levels (1st = 25%, 2nd = 50%, 3rd = 75%, 4th = 99.8%). Recommended: keep 3 levels active for clarity.
Color Controls: All plots and levels are fully customizable to match your chart style.
Table Display: Positioned on the chart (default: middle-right) with key values updated in real time.
🧭 Best Practices for Use
Combine with Trend Tools: Volatility readings are most powerful when combined with trend filters or volume analysis. For example, a breakout with both high volatility and trend confirmation is stronger than either alone.
ATR Stops: Use the Adjusted ATR rather than the standard one when trailing stops in highly volatile instruments like crypto or Nasdaq futures, as it adapts to outlier spikes.
Dollar Risk Translation: Use the dollar-value outputs to predefine maximum acceptable risk per trade (e.g., “I only risk $250 per position”). This bridges volatility to portfolio risk management.
Event Monitoring: Around economic events or earnings, expect volatility spikes above higher percentile levels. The indicator makes these moves instantly visible.
📌 Summary
The Ω ATR Indicator is not just “another ATR.” It is a comprehensive volatility framework that transforms volatility from a simple statistic into an actionable trading signal.
By combining:
the classic ATR,
an adjusted ATR,
percentile extremes,
regression-based volatility trends,
and real-time dollar conversions,
…this tool allows traders to precisely understand, visualize, and act on volatility in ways that a standard ATR simply cannot provide.
Whether you are scalping intraday moves, swing trading equities, or managing futures positions, the Ω ATR equips you with a professional-grade volatility dashboard that clarifies risk, highlights opportunity, and adapts across all markets and timeframes.
👉 Designed and developed by OmegaTools for traders who demand precision, clarity, and adaptability in their volatility analysis.
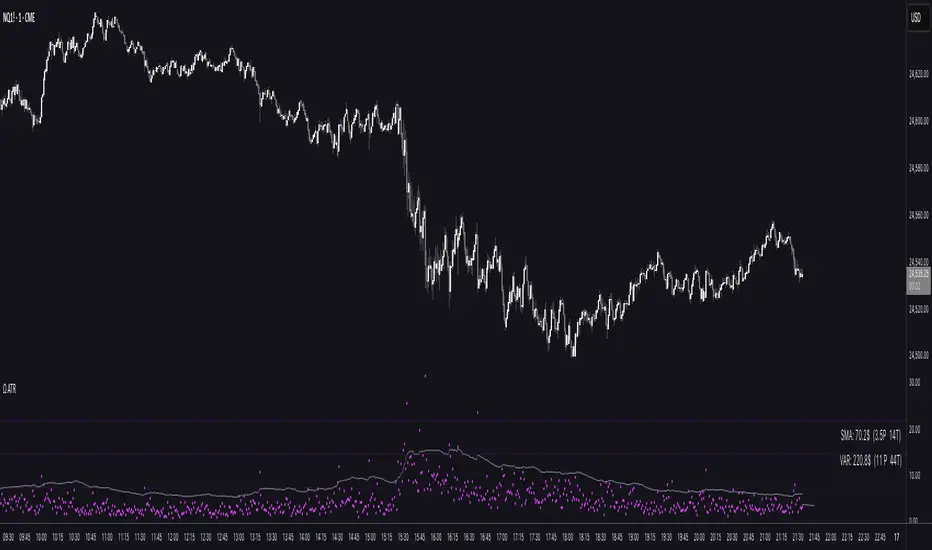
Kalman Adjusted Average True Range [BackQuant]Kalman Adjusted Average True Range
A volatility-aware trend baseline that fuses a Kalman price estimate with ATR “rails” to create a smooth, adaptive guide for entries, exits, and trailing risk.
Built on my original Kalman
This indicator is based on my original Kalman Price Filter:
That core smoother is used here to estimate the “true” price path, then blended with ATR to control step size and react proportionally to market noise.
What it plots
Kalman ATR Line the main baseline that turns up/down with the filtered trend.
Optional Moving Average of the Kalman ATR a secondary line for confluence (SMA/Hull/EMA/WMA/DEMA/RMA/LINREG/ALMA).
Candle Coloring (optional) paint bars by the baseline’s current direction.
Why combine Kalman + ATR?
Kalman reduces measurement noise and produces a stable path without the lag of heavy MAs.
ATR rails scale the baseline’s step to current volatility, so it’s calm in chop and more responsive in expansion.
The result is a single, intelligible line you can trade around: slope-up = constructive; slope-down = caution.
How it works (plain English)
Each bar, the Kalman filter updates an internal state (tunable via Process Noise , Measurement Noise , and Filter Order ) to estimate the underlying price.
An ATR band (Period × Factor) defines the allowed per-bar adjustment. The baseline cannot “jump” beyond those rails in one step.
A direction flip is detected when the baseline’s slope changes sign (upturn/downturn), and alerts are provided for both.
Typical uses
Trend confirmation Trade in the baseline’s direction; avoid fading a firmly rising/falling line.
Pullback timing Look for entries when price mean-reverts toward a rising baseline (or exits on tags of a falling one).
Trailing risk Use the baseline as a dynamic guide; many traders set stops a small buffer beyond it (e.g., a fraction of ATR).
Confluence Enable the MA overlay of the Kalman ATR; alignment (baseline above its MA and rising) supports continuation.
Inputs & what they do
Calculation
Kalman Price Source which price the filter tracks (Close by default).
Process Noise how quickly the filter can adapt. Higher = more responsive (but choppier).
Measurement Noise how much you distrust raw price. Higher = smoother (but slower to turn).
Filter Order (N) depth of the internal state array. Higher = slightly steadier behavior.
Kalman ATR
Period ATR lookback. Shorter = snappier; longer = steadier.
Factor scales the allowed step per bar. Larger factors permit faster drift; smaller factors clamp movement.
Confluence (optional)
MA Type & Period compute an MA on the Kalman ATR line , not on price.
Sigma (ALMA) if ALMA is selected, this input controls the curve’s shape. (Ignored for other MA types.)
Visuals
Plot Kalman ATR toggle the main line.
Paint Candles color bars by up/down slope.
Colors choose long/short hues.
Signals & alerts
Trend Up baseline turns upward (slope crosses above 0).
Alert: “Kalman ATR Trend Up”
Trend Down baseline turns downward (slope crosses below 0).
Alert: “Kalman ATR Trend Down”
These are state flips , not “price crossovers,” so you avoid many one-bar head-fakes.
How to start (fast presets)
Swing (daily/4H) ATR Period 7–14, Factor 0.5–0.8, Process Noise 0.02–0.05, Measurement Noise 2–4, N = 3–5.
Intraday (5–15m) ATR Period 5–7, Factor 0.6–1.0, Process Noise 0.05–0.10, Measurement Noise 2–3, N = 3–5.
Slow assets / FX raise Measurement Noise or ATR Period for calmer lines; drop Factor if the baseline feels too jumpy.
Reading the line
Rising & curving upward momentum building; consider long bias until a clear downturn.
Flat & choppy regime uncertainty; many traders stand aside or tighten risk.
Falling & accelerating distribution lower; short bias until a clean upturn.
Practical playbook
Continuation entries After a Trend Up alert, wait for a minor pullback toward the baseline; enter on evidence the line keeps rising.
Exit/reduce If long and the baseline flattens then turns down, trim or exit; reverse logic for shorts.
Filters Add a higher-timeframe check (e.g., only take longs when the daily Kalman ATR is rising).
Stops Place stops just beyond the baseline (e.g., baseline − x% ATR for longs) to avoid “tag & reverse” noise.
Notes
This is a guide to state and momentum, not a guarantee. Combine with your process (structure, volume, time-of-day) for decisions.
Settings are asset/timeframe dependent; start with the presets and nudge Process/Measurement Noise until the baseline “feels right” for your market.
Summary
Kalman ATR takes the noise-reduction of a Kalman price estimate and couples it with volatility-scaled movement to produce a clean, adaptive baseline. If you liked the original Kalman Price Filter (), this is its trend-trading cousin purpose-built for cleaner state flips, intuitive trailing, and confluence with your existing

ADR/ATR Session No Probability Table by LKHere you go—clear, English docs you can drop into your script’s description or share with teammates.
ADR/ATR Session by LK — Overview
This indicator summarizes Average Daily Range (ADR) and Average True Range (ATR) for two horizons:
• Session H4 (e.g., 06:00–13:00 on a 4‑hour chart)
• Daily (D)
It shows:
• Current ADR/ATR values (using your chosen smoothing method)
• How much of ADR/ATR today/this bar has already been consumed (% of ADR/ATR)
• ADR/ATR as a percent of price
• Optional probability blocks: likelihood that %ADR will exceed user‑defined thresholds over a lookback window
• Optional on‑chart lines for the current H4 and Daily candles: Open, ADR High, ADR Low
⸻
What the metrics mean
• ADR (H4 / D): Moving average of the bar range (high - low).
• ATR (H4 / D): Moving average of True Range (max(hi-lo, |hi-close |, |lo-close |)).
• % of ADR (curr H4): (H4 range of the current H4 bar) / ADR(H4) × 100. Updates live even if the current time is outside the session.
• % of ADR (Daily): (today’s intra‑day range) / ADR(D) × 100.
• % of ATR (curr H4 / Daily): TR / ATR × 100 for that horizon.
• ADR % of Price / ATR % of Price: ADR or ATR divided by current price × 100 (a quick “volatility vs. price” gauge).
Session logic (H4): ADR/ATR(H4) only update on bars that fall inside the configured session window; outside the window the values hold steady (no recalculation “bleed”).
Daily range tracking: The indicator tracks today’s high/low in real‑time and resets at the day change.
⸻
Inputs (quick reference)
Core
• Length (ADR/ATR): smoothing length for ADR/ATR (default 21).
• Wait for Higher TF Bar Close: if true, updates ADR/ATR only after the higher‑TF bar closes when using request.security.
Timeframes
• Session Timeframe (H4): default 240.
• Daily Timeframe: default D.
Session time
• Session Timezone: “Chart” (default) or a fixed timezone.
• Session Start Hour, End Hour (minutes are fixed to 0 in this version).
Smoothing methods
• H4 ADR Method / H4 ATR Method: SMA/EMA/RMA/WMA.
• Daily ADR Method / Daily ATR Method: SMA/EMA/RMA/WMA.
Table appearance
• Table BG, Table Text, Table Font Size.
Lines (optional)
• Show current H4 segments, Show current Daily segments
• Line colors for Open / ADR High / ADR Low
• Line width
Probability
• H4 Probability Lookback (bars): number of H4 bars to examine (e.g., 300).
• Daily Probability Lookback (days): number of D bars (e.g., 180).
• ADR thresholds (%): CSV list of thresholds (e.g., 25,50,55,60,65,70,75,80,85,90,95,100,125,150).
The table will show the % of lookback bars where %ADR ≥ threshold.
Tip: If you want probabilities only for session H4 bars (not every H4 bar), ask and I can add a toggle to filter by inSess.
⸻
How to read the table
H4 block
• ADR (method) / ATR (method): the session‑aware averages.
• % of ADR (curr H4): live progress of this H4 bar toward the session ADR.
• ADR % of Price: ADR(H4) relative to price.
• % of ATR (curr H4) and ATR % of Price: same idea for ATR.
H4 Probability (lookback N bars)
• Rows like “≥ 80% ADR” show the fraction (in %) of the last N H4 bars that reached at least 80% of ADR(H4).
Daily block
• Mirrors the H4 block, but for Daily.
Daily Probability (lookback M days)
• Rows like “≥ 100% ADR” show the fraction of the last M daily bars whose daily range reached at least 100% of ADR(D).
⸻
Practical usage
• Use % of ADR (curr H4 / Daily) to judge exhaustion or room left in the day/session.
E.g., if Daily %ADR is already 95%, be cautious with momentum continuation trades.
• The probability tables give a quick historical context:
If “≥ 125% ADR” is ~18%, the market rarely stretches that far; your trade sizing/targets can reflect that.
• ADR/ATR % of Price helps normalize volatility between instruments.
⸻
Troubleshooting
• If probability rows are blank: ensure lookback windows are large enough (and that the chart has enough history).
• If ADR/ATR show … (NA): usually you don’t have enough bars for the chosen length/TF yet.
• If line segments are missing: verify you’re on a chart with visible current H4/D bars and the toggles are enabled.
⸻
Notes & customization ideas
• Add a toggle to count only session bars in H4 probability.
• Add separate thresholds for H4 vs Daily.
• Let users pick minutes for session start/end if needed.
• Add alerts when %ADR crosses specified thresholds.
If you want me to bundle any of the “ideas” above into the code, say the word and I’ll ship a clean patch.

Liquidity Analysis with Volume, ATR, and Chaikin Oscillator
Script Name: Liquidity Analysis with Volume, ATR, and Chaikin Oscillator
Description: This script analyzes market liquidity using three key indicators: Volume, ATR (Average True Range), and the Chaikin Oscillator. Based on the combination of these indicators, the script identifies three market conditions and visually highlights them with background colors:
High Liquidity Uptrend (Green Background):
Occurs when volume is high, ATR is above the threshold, and the Chaikin Oscillator is positive. This indicates strong liquidity with an upward trend in the market.
Alert: "High Liquidity Uptrend detected."
High Liquidity Downtrend (Red Background):
Occurs when volume is high, ATR is above the threshold, and the Chaikin Oscillator is negative. This signals strong liquidity but with a downward market trend.
Alert: "High Liquidity Downtrend detected."
Low Liquidity Stagnant Market (Yellow Background):
Occurs when volume is low, and ATR is below the threshold. This suggests a market with low liquidity and minimal price movement, indicating a range or stagnant phase.
Alert: "Low Liquidity Stagnant market detected."
Input Settings Panel:
Volume Threshold: This value sets the minimum volume required to determine high liquidity. If the volume is above this value, it is considered "high volume."
ATR Length: Defines the number of periods used to calculate ATR. The higher the value, the more smoothed the ATR calculation.
ATR Threshold: This sets the minimum ATR value required to signal a market with significant volatility. If ATR is above this value, the market is considered to have high volatility.
These settings allow you to fine-tune the script based on the characteristics of the asset being analyzed.
スクリプト名: 出来高、ATR、チャイキンオシレーターを用いた流動性分析
説明: このスクリプトは、出来高、ATR(平均真値幅)、およびチャイキンオシレーターという3つの主要な指標を用いて市場の流動性を分析します。これらの指標の組み合わせに基づいて、3つの市場状況を特定し、背景色で視覚的にハイライトします。
流動性が高い上昇相場(背景色:緑):
出来高が高く、ATRがしきい値を超え、チャイキンオシレーターがプラスの場合に発生します。これは、強い流動性と市場の上昇トレンドを示します。
アラート: 「高流動性の上昇トレンドが検出されました。」
流動性が高い下降相場(背景色:赤):
出来高が高く、ATRがしきい値を超え、チャイキンオシレーターがマイナスの場合に発生します。これは、強い流動性を伴う下降トレンドを示します。
アラート: 「高流動性の下降トレンドが検出されました。」
流動性が低い停滞相場(背景色:黄色):
出来高が低く、ATRがしきい値以下の場合に発生します。これは流動性が低く、価格変動が少ない、レンジまたは停滞フェーズを示しています。
アラート: 「低流動性の停滞相場が検出されました。」
設定パネルの入力項目:
出来高のしきい値: 高流動性を判定するために必要な最小の出来高を設定します。この値を超える場合、「高出来高」と見なされます。
ATRの期間: ATRを計算する際に使用される期間数を定義します。値が大きいほど、ATRの計算が滑らかになります。
ATRのしきい値: しきい値を超えた場合に市場に大きなボラティリティがあると判断します。この値を上回るATRであれば、ボラティリティが高いと見なされます。
これらの設定により、分析対象の資産の特性に応じてスクリプトを調整できます。

Trend CCITrend CCI (TCCI) Indicator
Description:
The Trend CCI (TCCI) indicator is a unique combination of the Commodity Channel Index (CCI) and the Average True Range (ATR), designed to identify trends and market reversals with a refined sensitivity to price volatility. The indicator plots the CCI, adjusted by an ATR filter, and color-codes the trendline to signal uptrends and downtrends.
How It Works:
This indicator uses the CCI to measure price momentum and an ATR-based filter to smooth out market noise, making it easier to detect significant shifts in the market trend. Key parameters such as the ATR Period, ATR Multiplier, and CCI Period have been carefully chosen to optimize the indicator's performance:
1. ATR Period (default: 18)
The ATR Period determines the number of periods used to calculate the **Average True Range**, which reflects market volatility. In this case, an **ATR Period of 18** has been selected for several reasons:
Balance between responsiveness and noise reduction : A period of 18 strikes a balance between being responsive to recent price movements and filtering out minor fluctuations. Shorter ATR periods might be too reactive, creating false signals, while longer periods might miss shorter-term trends.
Adaptable to various market conditions : An 18-period ATR is suitable for both intraday and swing trading strategies, making it versatile across different time frames.
Standard industry practice : Many traders use ATR settings between 14 and 20 periods as a convention for detecting reliable volatility levels.
2. ATR Multiplier (default: 1.5)
The ATR Multiplier is applied to the ATR value to define how sensitive the indicator is to volatility. In this case, a multiplier of 1.5 has been chosen:
Avoiding whipsaws in low volatility markets: By setting the multiplier to 1.5, the indicator filters out smaller, less significant price movements, reducing the likelihood of whipsaw signals (i.e., false trend reversals during periods of low volatility).
Optimizing signal accuracy: A moderate multiplier like 1.5 ensures that the indicator only generates signals when the price moves a significant distance from the average range. Higher multipliers (e.g., 2.0) may ignore valid opportunities, while lower multipliers (e.g., 1.0) might create too many signals.
Enhancing trend clarity : The multiplier’s role in widening the range allows the indicator to respond more clearly during periods of strong trends, reducing signal noise and false positives.
3. CCI Period (default: 63)
The CCI Period defines the number of periods used to calculate the Commodity Channel Index. A 63-period CCI is selected based on the following considerations:
Smoothing the momentum calculation: A longer period, such as 63, is used to smooth out the CCI and reduce the effects of short-term price fluctuations. This period captures longer-term momentum, making it ideal for identifying more significant market trends.
-Filtering out short-term noise: While shorter CCI periods (e.g., 14 or 20) may be more reactive, they tend to produce more signals, some of which may be false. A 63-period CCI focuses on stronger and more sustained price movements, providing fewer but higher-quality signals.
Adapted to intermediate trading: A 63-period CCI aligns well with traders looking for medium-term trend-following strategies, striking a balance between long-term trend identification and responsiveness to significant price shifts.
How to Use:
Green Area: When the trendline turns green, it signals that the CCI is positive, reflecting upward momentum. This can be interpreted as a buy signal, indicating the potential for long positions or continuing bullish trades.
Red Area: When the trendline turns red, it signals that the CCI is negative, reflecting downward momentum. This can be interpreted as a sell signal, indicating potential short positions or bearish trades.
ATR Filter: The ATR helps reduce false signals by ignoring minor price movements. Traders can adjust the ATR Multiplier to make the indicator more or less sensitive based on market conditions. A lower multiplier (e.g., 1.2) may increase signal frequency, while a higher multiplier (e.g., 2.0) reduces it.
Originality:
The Trend CCI (TCCI) stands out due to its combination of the CCI and ATR. While many indicators simply plot raw CCI values, this script enhances the CCI’s effectiveness by incorporating an ATR-based volatility filter. This ensures that only significant trends trigger signals, making it a more reliable tool in volatile markets. The choice of the ATR period, multiplier, and CCI period ensures a refined balance between trend detection and noise reduction, distinguishing it as a powerful trend-following indicator.
Additionally, the visual aspect—using color-coded trendlines that dynamically shift between green and red—simplifies the interpretation of market trends, offering traders a clear and immediate understanding of trend direction and momentum strength.
Final Recommendations:
Use in Trending Markets The TCCI is most effective in trending markets, where its signals align with broader market momentum. In sideways or low-volatility markets, consider adjusting the ATR multiplier or using other complementary indicators to confirm the signals.
Risk Management: Always integrate robust risk management practices, such as using stop-loss orders and position sizing, to protect against sudden market reversals or periods of heightened volatility.
Adjust for Volatility: Consider the volatility of the asset being traded. In highly volatile assets, a higher ATR multiplier (e.g., 2.0) may be necessary to filter out noise, while in more stable assets, a lower multiplier (e.g., 1.2) might generate earlier signals.
By using the Trend CCI (TCCI) indicator with a deeper understanding of its key parameters, traders can better identify trends, reduce noise, and improve their overall decision-making in the markets.
Good Profits!

Pullback & ATR Trailing Strategy※日本語は英文の次に記載あります。
Overview
This indicator combines short-term RSI pullback/rebound signals with long-term RSI divergence to visualize potential buy and sell opportunities.
It also plots ATR-based trailing stops and partial take-profit lines, making it suitable for day trading and short-term trading.
Alerts are triggered when signal conditions are met.
Key Features
Detect short-term RSI pullbacks/rebounds (default 6 periods)
Detect divergences on long-term RSI
Visualize buy/sell signals with labels
Display ATR-based trailing stop and partial take-profit lines
Trigger alerts when conditions are met
Settings Explanation
Short-term RSI Length (rsiShortLen) Period for short-term RSI used to detect pullbacks or rebounds
Pullback Threshold (levelLow) RSI level below which a buy signal is considered
Rebound Threshold (levelHigh) RSI level above which a sell signal is considered
Long-term Timeframe (longTF) Timeframe used for divergence detection
Long-term RSI Length (longRSILen) Period for RSI on the long-term timeframe, used for divergence detection
Pivot Width Left / Right (pivotLeft / pivotRight)
Determines how we detect swing highs/lows (peaks and valleys).
For example, with pivotLeft=3 and pivotRight=3, a bar is considered a swing high if it is higher than the 3 bars to its left and 3 bars to its right.
Larger numbers detect only bigger swings, smaller numbers also detect smaller swings.
ATR Length (atrLen) Period for ATR calculation for trailing stops
ATR Multiplier (atrMult) Multiplier for ATR to calculate trailing stop distance
Partial Take-Profit Multiplier (tpMult) Multiplier to calculate half-profit level based on swing amplitude
Green line (Long Trail / translucent green)
ATR-based trailing stop line for long positions.
Used as a stop-loss or trailing stop for open buy trades.
Dark green line shows partial take-profit (TP), translucent green shows trailing stop level.
Red line (Short Trail / translucent red)
ATR-based trailing stop line for short positions.
Used as a stop-loss or trailing stop for open sell trades.
Dark red line shows partial take-profit (TP), translucent red shows trailing stop level.
Note: TP lines indicate partial take-profit targets, while ATR trailing lines indicate stop-loss/trailing stop levels if the price moves against the position.
日本語説明ーーーーーーーーーーーーーーーーーーーーーーーーーーーー
概要
このインジケーターは、短期RSIの押し目/戻りシグナルと、長期足RSIによるダイバージェンスを組み合わせて、買い・売りのチャンスを可視化します。
さらに、ATRベースのトレールストップラインや半分利確ラインも表示し、デイトレードや短期トレードに最適化しています。
シグナル条件に一致した場合にアラートも作動します。
主な機能
短期RSI(デフォルト6期間)で押し目・戻りを検出
長期足RSIでのダイバージェンスを検出
BUY/SELLラベルでシグナルを視覚化
ATRベースのトレールライン・半分利確ラインを表示
条件一致時にアラート発動
各設定の説明
短期RSI期間 (rsiShortLen) デイトレ用の短期RSIの期間。押し目や戻りのシグナルに使用
押し目閾値 (levelLow) RSIが下回ったら買いシグナル判定に使用
戻り閾値 (levelHigh) RSIが上回ったら売りシグナル判定に使用
長期足 (longTF) ダイバージェンス判定用の長期足の時間軸
長期RSI期間 (longRSILen) 長期足で計算するRSIの期間。ダイバージェンス判定に使用
左右ピボット幅 (pivotLeft / pivotRight) 高値や安値を「スイングの山・谷」として判定する時に使う幅です。
例えば pivotLeft=3, pivotRight=3 の場合、「左に3本、右に3本のローソク足より高い/低い点」をスイングの頂点や底と見なします。
数値を大きくすると大きな波だけを拾い、小さくすると小さな波も拾いやすくなります。
ATR期間 (atrLen) トレールライン計算用ATRの期間
ATR倍率 (atrMult) トレールラインの距離をATRに掛ける倍率
半分利確倍率 (tpMult) 押し目/戻り幅に対して半分利確ラインを設定する倍率
緑の線(Long Trail / 半透明緑)
ATRベースのトレールストップラインです。
買いポジション中の損切り目安やトレーリングストップとして使います。
緑の濃い線は半分利確ライン(TP)、薄い緑の線はトレールストップの位置を示します。
赤い線(Short Trail / 半透明赤)
ATRベースのトレールストップラインです。
売りポジション中の損切り目安やトレーリングストップとして使います。
赤の濃い線は半分利確ライン(TP)、薄い赤の線はトレールストップの位置を示します。
補足:TP(Take Profit)線は半分利確の目安で、ATRトレールラインはポジションが逆行した時の損切り目安です。

ATR%指標概要 / Overview
ATR Percentage (MTF):把 ATR 轉為百分比(ATR%)或保留為絕對值,並在該「波動序列」上套用布林帶。支援多週期(MTF)計算:例如在 5 分圖顯示 4H / D1 的 ATR%。內建白色點狀水平線作為固定門檻(預設 1%)。
ATR Percentage (MTF): Converts ATR to a percentage of price (ATR%) or keeps it as absolute ATR, then applies Bollinger Bands on this volatility series. Supports multi-timeframe (MTF) calculation (e.g., show 4H/D1 ATR% on a 5-min chart). Includes a configurable white dotted horizontal threshold line (default 1%).
⸻
設計目的 / Purpose
• 以 ATR% 衡量相對波動,利於跨品種比較。
Use ATR% for relative volatility to compare across markets.
• 以 布林帶 標示「高/低波動區」,觀察擴張與壓縮。
Use Bollinger Bands on volatility to highlight expansion/squeeze.
• 提供 固定閾值(1%) 作為策略濾網或告警門檻。
Provide a fixed threshold (1%) for filters/alerts.
• 以 MTF 方式,讓低週期策略用高週期波動做濾網。
MTF lets lower-TF strategies filter by higher-TF volatility.
⸻
參數說明 / Inputs
• Use ATR as % of Close:切換 ATR(絕對值)/ ATR%(建議)。
Toggle between absolute ATR and ATR% (recommended).
• ATR Periods:ATR 計算長度(預設 22)。
ATR lookback (default 22).
• Show Bollinger Bands / BB Periods / StdDev:布林帶開關、長度與倍數(預設 20 / 2)。
Bollinger Bands on/off, length, and deviation (default 20 / 2).
• Source Timeframe:計算用週期(如 60、240、D、W;留空/Chart = 跟隨圖表)。
Timeframe used for calculations (e.g., 60, 240, D, W; empty/“Chart” = current).
• Threshold Line (%):白色點線門檻,預設 1.0(即 1%)。
White dotted threshold line, default 1.0 (1%).
提醒:當 非 ATR% 模式時,Threshold 值代表「價格單位」而非百分比。
Note: In non-ATR% mode, the threshold is in price units, not percent.
⸻
訊號解讀 / How to Read
• ATR% > 上軌:波動顯著擴張(趨勢啟動或加速常見)。
ATR% above upper band: significant expansion; often trend ignition/acceleration.
• ATR% < 下軌:波動明顯壓縮(常見於突破前)。
ATR% below lower band: volatility squeeze; often precedes breakouts.
• ATR% 穿越 Threshold(1%):達到固定波動標準,可作策略開關或風控分水嶺。
ATR% crossing the 1% threshold: fixed volatility bar for filters/risk gates.
⸻
內建告警 / Built-in Alerts
• Volatility Breakout (MTF):ATR/ATR% 向上穿越上軌。
Triggers when ATR/ATR% crosses above the upper band.
• Volatility Squeeze (MTF):ATR/ATR% 向下穿越下軌。
Triggers when ATR/ATR% crosses below the lower band.
⸻
使用建議 / Suggested Uses
• 當沖濾網:於 1–5 分圖選擇 4H / D1 作為 Source Timeframe;僅在 ATR% > 1% 且位於中線以上時允許趨勢進場。
Intraday filter: on 1–5m charts, set 4H/D1 as source TF; allow trend entries only when ATR% > 1% and above the midline.
• 突破前偵測:ATR% 長時間貼近下軌 → 留意可能的波動擴張。
Pre-breakout scan: prolonged ATR% near lower band can foreshadow expansion.
• 跨品種比較:用 ATR% 統一指數、外匯、商品的波動刻度。
Cross-asset comparison: ATR% normalizes volatility across indices/FX/commodities.
⸻
已知限制 / Notes
• MTF 對齊:使用 request.security() 對映高週期資料到當前圖表;在歷史回補與即時邊界棒可能略有差異。
MTF alignment: request.security() maps higher-TF data; boundary bars may differ slightly between historical and realtime.
• 百分比分母:ATR% 的分母為同一週期的 close;若需更平滑可改 ATR / SMA(close, N) × 100。
Denominator: ATR% uses same-TF close; for smoother values consider ATR / SMA(close, N) × 100.
• 風險聲明:僅供研究/教育用途,非投資建議,請自行控管風險。
Disclaimer: For research/education only. Not investment advice.
⸻
版本與更新 / Version & Updates
• v1.0:ATR/ATR% + BB(MTF)、1% 白色點線、兩組告警。
v1.0: ATR/ATR% + BB (MTF), 1% white dotted line, two alert conditions.

Chonky ATR Levels 2.0Show ATR based high/low projections.
Choose a custom ATR calculation in the indicator's settings.
The default is a 20day RMA based ATR.
----------How projections are calculated----------
To project the ATR High, the ATR value is added to the low of the current candle that matches the ATR's timeframe.
To project the ATR Low, the ATR value is subtracted from the high of the current candle that matches the ATR's timeframe.
Example:
If a 20day RMA ATR is used:
- the ATR High will be the current day's low + the ATR value.
- the ATR Low will be the current day's high - the ATR value.
*However*, if the price action exceeds either ATR projection, the opposite ATR level will be fixed to the extreme of the period.
See the AUDUSD screenshot above for an example.
The ATR Low was exceeded, so the ATR High projection is capped at the high of day.
If the ATR High is exceeded, the ATR Low would be capped at the low of day.

[GrandAlgo] ATR Trend MatrixThe ATR Trend Matrix is a dynamic trendline indicator designed to help traders visualize market structure using ATR-based trend projections. This tool adapts to price action and highlights potential support and resistance zones based on Average True Range (ATR) calculations.
Key Features
ATR-Based Trendlines – Calculates and plots dynamic trendlines using an adjustable ATR factor.
Multi-Level Matrix System – Provides up to four matrix levels, each customizable with different ATR multipliers.
Swing High & Low Detection – Automatically detects market pivots to serve as anchor points for trendlines.
Adjustable Trend Length – Fine-tune the sensitivity of trendlines using the Swing Length and Trend-Line Length Multiplier.
Auto-Adjustment Mode – When enabled, trendlines update dynamically as ATR evolves.
Buy & Sell Signals – Marks potential trade setups when price crosses below or above Matrix Level 1.
How It Works
Detects Swing Points – Identifies key highs and lows in the market using the length setting.
Plots ATR-Based Trendlines – Calculates trendlines using ATR with user-defined multipliers for four matrix levels.
Adjusts Dynamically – If Auto Adjust is enabled, trendlines shift with ATR movements.
Identifies Trade Signals – Highlights potential buy/sell zones when price interacts with Matrix Level 1 trendlines.
Manages Active Trendlines – Automatically updates and removes trendlines based on price interaction.
User Settings
General Settings
ATR Factor – Controls the ATR multiplier for trendline calculation.
Swing Length – Defines the number of bars for swing high/low detection.
Trend-Line Length Multiplier – Adjusts the extension length of trendlines.
Auto Adjust Trendlines – Enables real-time adjustment of trendlines as ATR changes.
Matrix Settings
Matrix Level 1-4 – Enable or disable individual trendline levels.
Matrix Factors – Customize the ATR multipliers for each matrix level.
Trading Applications
Trend Confirmation – Use the primary trendline and matrix levels to gauge trend strength.
Support & Resistance Zones – ATR-based trendlines can act as dynamic support/resistance.
Breakout & Rejection Signals – Identify potential breakouts or reversals when price interacts with matrix levels.
Volatility-Based Trading – ATR helps adjust trendlines based on market volatility.
The ATR Trend Matrix is a powerful tool for traders who want a dynamic, adaptive trendline system that reacts to market structure and volatility. With customizable settings, multi-level ATR projections, and trade signal detection, this indicator provides a comprehensive approach to price action analysis.
Filtered ATR with EMA OverlayFiltered ATR with EMA Overlay is an advanced volatility indicator designed to provide a more accurate representation of market conditions by smoothing the standard Average True Range (ATR). This is achieved by filtering out extreme price movements and abnormal bars that can distort traditional ATR calculations.
The indicator applies an Exponential Moving Average (EMA) to the filtered ATR, creating a dual-layered system that highlights periods of increased or decreased volatility.
Key Features:
Filtered ATR: Filters out extreme bars, reducing noise and making the ATR line more reliable.
EMA Overlay: An EMA (default period of 10) is applied to the filtered ATR, allowing traders to track average volatility trends.
Volatility Signals:
Filtered ATR > EMA(10): Indicates higher-than-average volatility. This often correlates with trend breakouts or strong price movements.
Filtered ATR < EMA(10): Suggests reduced volatility, signaling potential consolidation or sideways price action.
Parameters:
atrLength (Default: 5):
The number of bars used to calculate the ATR. A shorter period (e.g., 3-5) responds faster to price changes, while a longer period (e.g., 10-14) provides smoother results.
multiplier (Default: 1.8):
Controls the sensitivity of the filter. A lower multiplier (e.g., 1.5) filters out more bars, resulting in smoother ATR. Higher values (e.g., 2.0) allow more bars to pass through, retaining more price volatility.
maxIterations (Default: 20):
The maximum number of bars processed to detect abnormal values. Increasing this may improve accuracy at the cost of performance.
ema10Period (Default: 10):
The period for the Exponential Moving Average applied to the filtered ATR. Shorter periods provide faster signals, while longer periods give smoother, lagging signals.
Trading Strategies:
1. Breakout Strategy:
When filtered ATR crosses above EMA(10):
Enter long positions when price breaks above a key resistance level.
Higher volatility suggests strong price action and momentum.
When filtered ATR drops below EMA(10):
Exit positions or tighten stop-loss orders as volatility decreases.
Lower volatility may indicate consolidation or trend exhaustion.
2. Trend Following Strategy:
Use the filtered ATR line to track overall volatility.
If filtered ATR consistently stays above EMA: Hold positions or add to trades.
If filtered ATR remains below EMA: Reduce position size or stay out of trades.
3. Mean Reversion Strategy:
When filtered ATR spikes significantly above EMA, it may indicate market overreaction.
Look for price to revert to the mean once ATR returns below the EMA.
4. Stop-Loss Adjustment:
As volatility increases (ATR above EMA), widen stop-loss levels to avoid being stopped out by random fluctuations.
In low volatility (ATR below EMA), tighten stop-losses to minimize losses during low activity periods.
Benefits:
Reduced Noise: By filtering abnormal bars, the indicator provides cleaner signals.
Better Trend Detection: EMA smoothing highlights volatility trends.
Adaptable: The indicator can be customized for scalping, day trading, or swing trading.
Intuitive Visualization: Traders can visually see volatility shifts and adjust strategies in real-time.
Best Practices:
Timeframes: Works effectively on all timeframes, but higher timeframes (e.g., 1H, 4H, Daily) yield more reliable signals.
Markets: Suitable for forex, crypto, stocks, and commodities.
Combining Indicators: Use in combination with RSI, Moving Averages, Bollinger Bands, or price action analysis for stronger signals.
How It Works (Under the Hood):
The script calculates the Daily Range (High - Low) for each bar.
The largest and smallest bars are filtered out if their difference exceeds the multiplier (default 1.8).
The remaining bars are averaged to generate the filtered ATR.
An EMA(10) is then applied to the filtered ATR for smoother visualization.
