Hyper SAR Reactor Trend StrategyHyperSAR Reactor Adaptive PSAR Strategy
Summary
Adaptive Parabolic SAR strategy for liquid stocks, ETFs, futures, and crypto across intraday to daily timeframes. It acts only when an adaptive trail flips and confirmation gates agree. Originality comes from a logistic boost of the SAR acceleration using drift versus ATR, plus ATR hysteresis, inertia on the trail, and a bear-only gate for shorts. Add to a clean chart and run on bar close for conservative alerts.
Scope and intent
• Markets: large cap equities and ETFs, index futures, major FX, liquid crypto
• Timeframes: one minute to daily
• Default demo: BTC on 60 minute
• Purpose: faster yet calmer PSAR that resists chop and improves short discipline
• Limits: this is a strategy that places simulated orders on standard candles
Originality and usefulness
• Novel fusion: PSAR AF is boosted by a logistic function of normalized drift, trail is monotone with inertia, entries use ATR buffers and optional cooldown, shorts are allowed only in a bear bias
• Addresses false flips in low volatility and weak downtrends
• All controls are exposed in Inputs for testability
• Yardstick: ATR normalizes drift so settings port across symbols
• Open source. No links. No solicitation
Method overview
Components
• Adaptive AF: base step plus boost factor times logistic strength
• Trail inertia: one sided blend that keeps the SAR monotone
• Flip hysteresis: price must clear SAR by a buffer times ATR
• Volatility gate: ATR over its mean must exceed a ratio
• Bear bias for shorts: price below EMA of length 91 with negative slope window 54
• Cooldown bars optional after any entry
• Visual SAR smoothing is cosmetic and does not drive orders
Fusion rule
Entry requires the internal flip plus all enabled gates. No weighted scores.
Signal rule
• Long when trend flips up and close is above SAR plus buffer times ATR and gates pass
• Short when trend flips down and close is below SAR minus buffer times ATR and gates pass
• Exit uses SAR as stop and optional ATR take profit per side
Inputs with guidance
Reactor Engine
• Start AF 0.02. Lower slows new trends. Higher reacts quicker
• Max AF 1. Typical 0.2 to 1. Caps acceleration
• Base step 0.04. Typical 0.01 to 0.08. Raises speed in trends
• Strength window 18. Typical 10 to 40. Drift estimation window
• ATR length 16. Typical 10 to 30. Volatility unit
• Strength gain 4.5. Typical 2 to 6. Steepness of logistic
• Strength center 0.45. Typical 0.3 to 0.8. Midpoint of logistic
• Boost factor 0.03. Typical 0.01 to 0.08. Adds to step when strength rises
• AF smoothing 0.50. Typical 0.2 to 0.7. Adds inertia to AF growth
• Trail smoothing 0.35. Typical 0.15 to 0.45. Adds inertia to the trail
• Allow Long, Allow Short toggles
Trade Filters
• Flip confirm buffer ATR 0.50. Typical 0.2 to 0.8. Raise to cut flips
• Cooldown bars after entry 0. Typical 0 to 8. Blocks re entry for N bars
• Vol gate length 30 and Vol gate ratio 1. Raise ratio to trade only in active regimes
• Gate shorts by bear regime ON. Bear bias window 54 and Bias MA length 91 tune strictness
Risk
• TP long ATR 1.0. Set to zero to disable
• TP short ATR 0.0. Set to 0.8 to 1.2 for quicker shorts
Usage recipes
Intraday trend focus
Confirm buffer 0.35 to 0.5. Cooldown 2 to 4. Vol gate ratio 1.1. Shorts gated by bear regime.
Intraday mean reversion focus
Confirm buffer 0.6 to 0.8. Cooldown 4 to 6. Lower boost factor. Leave shorts gated.
Swing continuation
Strength window 24 to 34. ATR length 20 to 30. Confirm buffer 0.4 to 0.6. Use daily or four hour charts.
Properties visible in this publication
Initial capital 10000. Base currency USD. Order size Percent of equity 3. Pyramiding 0. Commission 0.05 percent. Slippage 5 ticks. Process orders on close OFF. Bar magnifier OFF. Recalculate after order filled OFF. Calc on every tick OFF. No security calls.
Realism and responsible publication
No performance claims. Past results never guarantee future outcomes. Shapes can move while a bar forms and settle on close. Strategies execute only on standard candles.
Honest limitations and failure modes
High impact events and thin books can void assumptions. Gap heavy symbols may prefer longer ATR. Very quiet regimes can reduce contrast and invite false flips.
Open source reuse and credits
Public domain building blocks used: PSAR concept and ATR. Implementation and fusion are original. No borrowed code from other authors.
Strategy notice
Orders are simulated on standard candles. No lookahead.
Entries and exits
Long: flip up plus ATR buffer and all gates true
Short: flip down plus ATR buffer and gates true with bear bias when enabled
Exit: SAR stop per side, optional ATR take profit, optional cooldown after entry
Tie handling: stop first if both stop and target could fill in one bar
Recherche dans les scripts pour "atr"

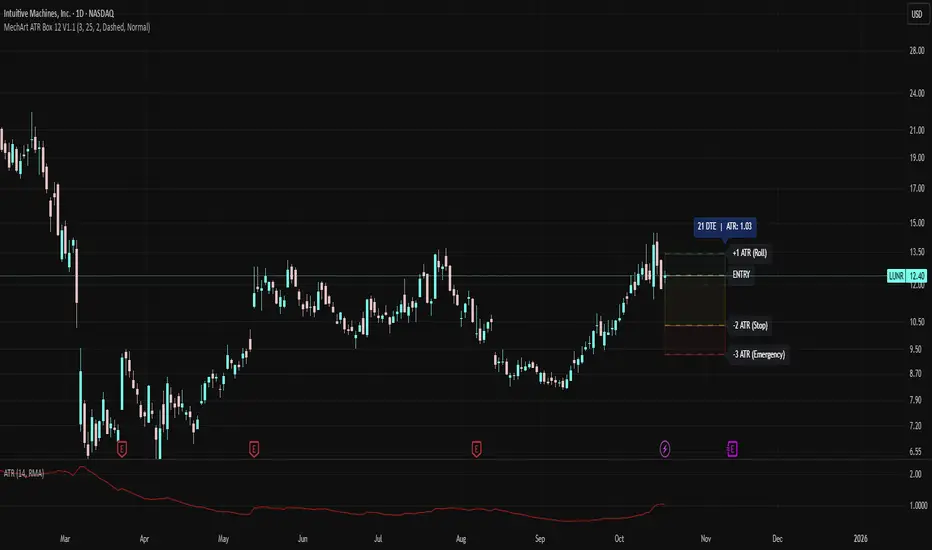
MechArt ATR Box 12 V1.1MechArt ATR Box 12 V1.1 — Auto ATR Edition
Overview:
The MechArt ATR Box 12 is a precision visualization tool for tracking ATR-based trade levels across multiple tickers. It automatically plots your +1 ATR roll zone, -2 ATR stop, and -3 ATR emergency exit, providing a clear visual map of your trade’s range and time horizon.
Key Features:
Auto ATR on Entry Date: For each configured ticker, the indicator automatically pulls the historical ATR(14) value that matches your entry date — no manual ATR entry needed. This refreshes each time the ticker is revisited.
Smart Defaults for Other Tickers:
If a ticker isn’t listed in the code, the indicator defaults to your current price as the entry, calculates ATR live, and sets expiration 21 days out, aligned to the next Friday.
Multi-Ticker Setup (12 Slots):
You can predefine up to 12 tickers inside the code, each with its own entry price, entry date and expiration date. Once saved, the indicator recognizes and loads them automatically when you open that chart.
Customizable Appearance:
Adjustable opacity and colors for each ATR box
Line width, style, and transparency controls
DTE/ATR label with adjustable font size
Dynamic Labels:
Displays the remaining days to expiration (DTE) and the ATR value used for calculations.
Use Case:
Designed for swing traders and options traders managing multiple active tickers. Each ATR box visually represents your trade window — from entry through expiration — with clear risk and roll boundaries.
How It Works:
Simply open the code once and enter your 12 tickers, each with its entry date and price. The script handles ATR lookups and expiration alignment automatically. Any ticker not included will generate its own default 21-day box.
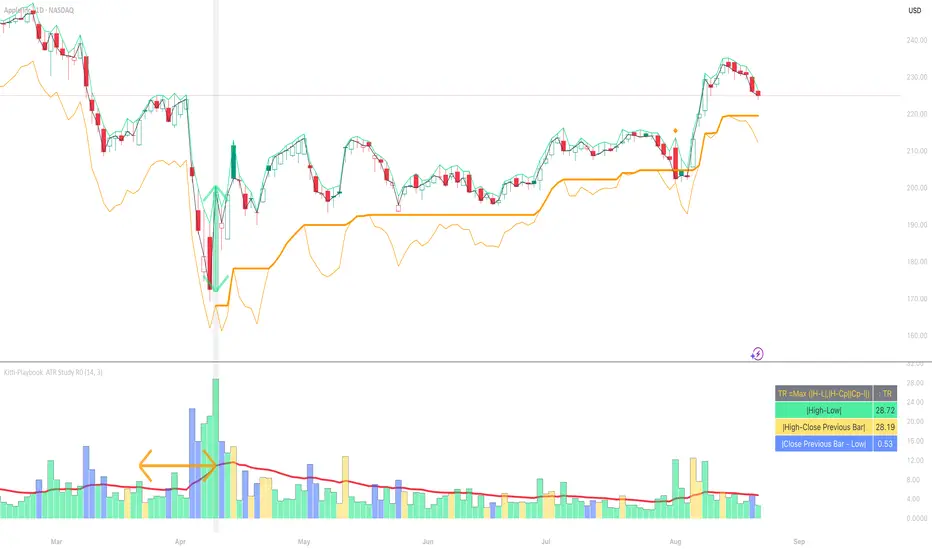
Kitti-Playbook ATR Study R0
Date : Aug 22 2025
Kitti-Playbook ATR Study R0
This is used to study the operation of the ATR Trailing Stop on the Long side, starting from the calculation of True Range.
1) Studying True Range Calculation
1.1) Specify the Bar graph you want to analyze for True Range.
Enable "Show Selected Price Bar" to locate the desired bar.
1.2) Enable/disable "Display True Range" in the Settings.
True Range is calculated as:
TR = Max (|H - L|, |H - Cp|, |Cp - L|)
• Show True Range:
Each color on the bar represents the maximum range value selected:
◦ |H - L| = Green
◦ |H - Cp| = Yellow
◦ |Cp - L| = Blue
• Show True Range on Selected Price Bar:
An arrow points to the range, and its color represents the maximum value chosen:
◦ |H - L| = Green
◦ |H - Cp| = Yellow
◦ |Cp - L| = Blue
• Show True Range Information Table:
Displays the actual values of |H - L|, |H - Cp|, and |Cp - L| from the selected bar.
2) Studying Average True Range (ATR)
2.1) Set the ATR Length in Settings.
Default value: ATR Length = 14
2.2) Enable/disable "Display Average True Range (RMA)" in Settings:
• Show ATR
• Show ATR Length from Selected Price Bar
(An arrow will point backward equal to the ATR Length)
3) Studying ATR Trailing
3.1) Set the ATR Multiplier in Settings.
Default value: ATR Multiply = 3
3.2) Enable/disable "Display ATR Trailing" in Settings:
• Show High Line
• Show ATR Bands
• Show ATR Trailing
4) Studying ATR Trailing Exit
(Occurs when the Close price crosses below the ATR Trailing line)
Enable/disable "Display ATR Trailing" in Settings:
• Show Close Line
• Show Exit Points
(Exit points are marked by an orange diamond symbol above the price bar)
Average True Ranges with IBD RSAdvanced ATR Analysis with IBD Relative Strength
This comprehensive indicator combines Average True Range (ATR) analysis with IBD (Investor's Business Daily) Relative Strength calculation, providing both volatility measurement and momentum analysis in one powerful tool.
Key Features:
ATR Analysis:
Standard ATR: Customizable period (default 14) with multiple smoothing options
1.5x ATR: Extended range for wider stop-loss and target calculations
Smoothing Options: Choose between RMA, SMA, EMA, or WMA for ATR calculation
Customizable Colors: Distinct colors for easy visual identification
IBD Relative Strength:
Professional RS Formula: Uses the same calculation method as Investor's Business Daily
Multi-Timeframe Analysis: Compares current price to 3, 6, 9, and 12-month performance
Weighted Calculation: 40% weight on 3-month, 20% each on 6, 9, and 12-month performance
Zero-Based Scale: Values above 0 indicate outperformance, below 0 indicate underperformance
Trading Applications:
Volatility-Based Stops: Use ATR and 1.5x ATR for dynamic stop-loss placement
Position Sizing: ATR helps determine appropriate position size based on volatility
Relative Strength Analysis: IBD RS identifies stocks with superior momentum
Market Timing: High RS values often precede strong price moves
Risk Management: Combine volatility (ATR) with momentum (RS) for comprehensive analysis
Technical Details:
ATR Calculation: True Range smoothed over selected period with chosen method
IBD RS Formula: (40% × 3M) + (20% × 6M) + (20% × 9M) + (20% × 12M) - 100
Display: Separate pane indicator with customizable colors for each component
How to Interpret:
High ATR: Increased volatility, wider stops needed
Low ATR: Reduced volatility, tighter stops possible
Positive IBD RS: Stock outperforming market over measured periods
Negative IBD RS: Stock underperforming market over measured periods
Customizable Parameters:
ATR calculation length
Smoothing method for ATR
Individual colors for ATR, 1.5x ATR, and IBD RS lines
Perfect for swing traders and position traders who want to combine volatility analysis with relative strength momentum in their decision-making process. Particularly useful for stock selection and risk management.

Trimmed ATR🧠 **Brief Description**:
Trimmed ATR is a modified volatility indicator that removes extreme values from the ATR calculation. This makes it more reliable for analyzing market conditions and filters out "noise" spikes. It is particularly useful for setting stop-losses and in strategies sensitive to false volatility.
🧾 **How Does Trimmed ATR Work?**
📌 For each bar:
- True Range (TR) is calculated.
- A sliding window of the last N TR values (where N = length) is stored.
- The TR list is sorted, and trimPercent % is cut off from each side:
- The smallest and largest values are removed.
- The remaining values are averaged → Trimmed ATR.
🔍 **Why Is This Important?**
Regular ATR can be distorted by outliers:
- A single spike can sharply inflate the ATR.
- This creates a false impression of market volatility.
🎯 Trimmed ATR solves this by eliminating the impact of anomalies, providing a more stable and accurate volatility measure.
📈 **What Does It Mean If Trimmed ATR Is Higher or Lower Than Regular ATR?**
🔵 **Trimmed ATR is lower than ATR** — this is normal:
- There are isolated TR spikes (high volatility on 1–2 bars).
- ATR increases, including these outliers.
- Trimmed ATR discards them → reflects the true average market background.
🧠 This is the most common case, indicating: a spike occurred, but the market is generally calm.
🟠 **Trimmed ATR is higher than ATR** — a rare but important signal:
- There were artificially low TR values (very small movements).
- ATR becomes too low.
- Trimmed ATR discards these "quiet" periods → provides a more realistic volatility estimate.
⚠️ This may indicate:
- Hidden pressure.
- Preparation for a breakout from a tight range.
- Underestimated volatility.
💡 **Applications**:
- **Trailing Stop**: Trimmed ATR helps avoid stop triggers due to noise.
- **Trend Filter**: Better reflects the "true" market dynamics.
- **Strategy Backtesting**: Eliminates distortions in volatility calculations.
Intraday Uncertainty [PhenLabs]📊 Intraday Uncertainty
Version: PineScript™ v6
📌 Description
The Intraday Uncertainty indicator offers traders a visual representation of market certainty/uncertainty during trading sessions. By comparing each price bar’s range to the Average True Range (ATR), it provides an intuitive way to gauge market conviction through a color gradient system.
This tool helps traders identify periods of high certainty (potentially trending markets) versus high uncertainty (potentially choppy or volatile markets) without complex calculations or multiple indicators. The color-coded bars create an immediate visual cue to support decision-making in varying market conditions.
🚀 Points of Innovation
Automated range-to-ATR ratio calculation that adapts to changing market volatility
Dynamic color gradient system that visually distinguishes between certain and uncertain price action
Customizable gradient clamping to fine-tune sensitivity to market conditions
Integrated dashboard that provides clear interpretation guidance
Position-flexible legend that accommodates different chart layouts
Highly optimized for performance with minimal calculation overhead
🔧 Core Components
ATR Calculation: Measures market volatility using a configurable lookback period
Range-to-ATR Ratio: Compares current bar’s high-low range against average volatility
Gradient Mapping System: Converts numerical uncertainty values into an intuitive color scale
Dashboard Legend: Provides clear interpretation guidance with customizable positioning
🔥 Key Features
Bar Coloring: Instantly identifies market certainty levels through intuitive color gradients
Customizable ATR Period: Adjust sensitivity to historical volatility based on trading style
Gradient Clamping: Fine-tune the color sensitivity using the Range/ATR multiplier
Color Customization: Personalize the color scheme to match your chart aesthetics
Informative Dashboard: Quickly interpret color meanings with the optional on-chart legend
Flexible Display Options: Customize dashboard position and text size for your chart layout
🎨 Visualization
Color Gradient: Bars colored on a spectrum from green (high certainty) to red (high uncertainty)
Dashboard Legend: Optional on-chart guide explaining the color interpretation
Color Intensity: Stronger colors indicate more extreme certainty/uncertainty levels
At-a-glance Interpretation: Quickly identify market conviction without analyzing numbers
📖 Usage Guidelines
Calculation Settings
ATR Period
Default: 14
Range: 1+
Description: Controls the lookback period for ATR calculation. Lower values increase sensitivity to recent volatility, while higher values provide more stability.
Gradient Clamp (Range/ATR Multiplier)
Default: 2.0
Range: 0.1+
Description: Sets the maximum Range/ATR ratio for gradient scaling. Ranges above this value display the end color (high uncertainty).
Color Settings
Gradient Start Color (High Certainty)
Default: Green
Description: Color representing high market certainty (low Range/ATR ratio)
Gradient End Color (Low Certainty)
Default: Red
Description: Color representing low market certainty (high Range/ATR ratio)
Dashboard Settings
Show Dashboard Legend
Default: True
Description: Toggles the visibility of the on-chart interpretation guide
Dashboard Position
Options: top_right, top_left, bottom_right, bottom_left, middle_right, middle_left
Default: bottom_right
Description: Controls the placement of the dashboard on your chart
Dashboard Text Size
Options: tiny, small, normal, large, huge
Default: normal
Description: Adjusts the text size of the dashboard for readability
✅ Best Use Cases
Identifying potential trend shifts when certainty levels change dramatically
Confirming trend strength through consistent certainty levels
Detecting choppy/sideways markets with persistent high uncertainty
Filtering trading signals from other indicators based on certainty levels
Gauging market conviction behind price breakouts or pullbacks
Optimizing entry/exit timing based on certainty/uncertainty transitions
⚠️ Limitations
Does not predict future price direction, only measures current bar certainty
May provide false signals during news events or unexpected volatility spikes
Requires context within the broader market environment for optimal interpretation
Color interpretation is relative rather than absolute across different securities
ATR-based calculation means sensitivity varies across different timeframes
💡 What Makes This Unique
Simplicity: Single visual indicator that doesn’t require multiple technical tools
Adaptability: Automatically adjusts to changing market volatility conditions
Contextual Analysis: Provides market conviction context beyond just price movement
Intuitive Design: Color-based system that requires minimal learning curve
Efficiency: Lightweight calculation that doesn’t impact chart performance
🔬 How It Works
1. ATR Calculation:
Calculates the Average True Range using the specified period
Establishes a baseline for normal market volatility
2. Range Analysis:
Measures each bar’s high-low range
Compares this range to the current ATR value to create a ratio
3. Gradient Mapping:
Converts the Range/ATR ratio to a normalized value between 0 and 1
Maps this value onto a color gradient between the start and end colors
Applies the resulting color to the price bar
4. Dashboard Creation:
Constructs an information panel on the last visible bar
Populates it with color samples and interpretation guidance
💡 Note:
This indicator works best when used in conjunction with other technical analysis tools rather than in isolation. The certainty/uncertainty measure provides context for your trading decisions but should not be the sole basis for entries and exits. Consider using higher certainty periods for trend-following strategies and exercise caution during periods of high uncertainty.

Market Structure Break with Volume & ATR#### Indicator Overview:
The *Market Structure Break with Volume & ATR (MSB+VolATR)* indicator is designed to identify significant market structure breakouts and breakdowns using a combination of price action, volume analysis, and volatility (ATR). It is particularly useful for traders who rely on higher timeframes for swing trading or positional trading. The indicator highlights bullish and bearish breakouts, retests, fakeouts, and potential buy/sell signals based on RSI overbought/oversold conditions.
---
### Key Features:
1. *Market Structure Analysis*:
- Identifies swing highs and lows on a user-defined higher timeframe.
- Detects breakouts and breakdowns when price exceeds these levels with volume and ATR validation.
2. *Volume Validation*:
- Ensures breakouts are accompanied by above-average volume, reducing the likelihood of false signals.
3. *ATR Filter*:
- Filters out insignificant breakouts by requiring the breakout size to exceed a multiple of the ATR.
4. *RSI Integration*:
- Adds a momentum filter by considering overbought/oversold conditions using RSI.
5. *Visual Enhancements*:
- Draws colored boxes to highlight breakout zones.
- Labels breakouts, retests, and fakeouts for easy interpretation.
- Displays stop levels for potential trades.
6. *Alerts*:
- Provides alert conditions for buy and sell signals, enabling real-time notifications.
---
### Input Settings and Their Effects:
1. **Timeframe (tf):
- Determines the higher timeframe for market structure analysis.
- *Effect*: A higher timeframe (e.g., 1D) reduces noise and provides more reliable swing points, while a lower timeframe (e.g., 4H) may generate more frequent but less reliable signals.
2. **Lookback Period (length):
- Defines the number of historical bars used to identify significant highs and lows.
- *Effect*: A longer lookback period (e.g., 50) captures broader market structure, while a shorter period (e.g., 20) reacts faster to recent price action.
3. **ATR Length (atr_length):
- Sets the period for ATR calculation.
- *Effect*: A shorter ATR length (e.g., 14) reacts faster to recent volatility, while a longer length (e.g., 21) smooths out volatility spikes.
4. **ATR Multiplier (atr_multiplier):
- Filters insignificant breakouts by requiring the breakout size to exceed ATR × multiplier.
- *Effect*: A higher multiplier (e.g., 0.2) reduces false signals but may miss smaller breakouts.
5. **Volume Multiplier (volume_multiplier):
- Sets the volume threshold for breakout validation.
- *Effect*: A higher multiplier (e.g., 1.0) ensures stronger volume confirmation but may reduce the number of signals.
6. **RSI Length (rsi_length):
- Defines the period for RSI calculation.
- *Effect*: A shorter RSI length (e.g., 10) makes the indicator more sensitive to recent price changes, while a longer length (e.g., 20) smooths out RSI fluctuations.
7. *RSI Overbought/Oversold Levels*:
- Sets the thresholds for overbought (default: 70) and oversold (default: 30) conditions.
- *Effect*: Adjusting these levels can make the indicator more or less conservative in generating signals.
8. **Stop Loss Multiplier (SL_Multiplier):
- Determines the distance of the stop-loss level from the entry price based on ATR.
- *Effect*: A higher multiplier (e.g., 2.0) provides wider stops, reducing the risk of being stopped out prematurely but increasing potential losses.
---
### How It Works:
1. *Breakout Detection*:
- A bullish breakout occurs when the close exceeds the highest high of the lookback period, with volume above the threshold and breakout size exceeding ATR × multiplier.
- A bearish breakout occurs when the close falls below the lowest low of the lookback period, with similar volume and ATR validation.
2. *Retest Logic*:
- After a breakout, if price retests the breakout zone without closing beyond it, a retest label is displayed.
3. *Fakeout Detection*:
- If price briefly breaks out but reverses back into the range, a fakeout label is displayed.
4. *Buy/Sell Signals*:
- A sell signal is generated when price reverses below a bullish breakout zone and RSI is overbought.
- A buy signal is generated when price reverses above a bearish breakout zone and RSI is oversold.
5. *Stop Levels*:
- Stop-loss levels are plotted based on ATR × SL_Multiplier, providing a visual guide for risk management.
---
### Who Can Use It and How:
1. *Swing Traders*:
- Use the indicator on daily or 4-hour timeframes to identify high-probability breakout trades.
- Combine with other technical analysis tools (e.g., trendlines, Fibonacci levels) for confirmation.
2. *Positional Traders*:
- Apply the indicator on weekly or daily charts to capture long-term trends.
- Use the stop-loss levels to manage risk over extended periods.
3. *Algorithmic Traders*:
- Integrate the buy/sell signals into automated trading systems.
- Use the alert conditions to trigger trades programmatically.
4. *Risk-Averse Traders*:
- Adjust the ATR and volume multipliers to filter out low-probability trades.
- Use wider stop-loss levels to avoid premature exits.
---
### Where to Use It:
- *Forex*: Identify breakouts in major currency pairs.
- *Stocks*: Spot trend reversals in high-volume stocks.
- *Commodities*: Trade breakouts in gold, oil, or other commodities.
- *Crypto*: Apply to Bitcoin, Ethereum, or other cryptocurrencies for volatile breakout opportunities.
---
### Example Use Case:
- *Timeframe*: 1D
- *Lookback Period*: 50
- *ATR Length*: 14
- *ATR Multiplier*: 0.1
- *Volume Multiplier*: 0.5
- *RSI Length*: 14
- *RSI Overbought/Oversold*: 70/30
- *SL Multiplier*: 1.5
In this setup, the indicator will:
1. Identify significant swing highs and lows on the daily chart.
2. Validate breakouts with volume and ATR filters.
3. Generate buy/sell signals when price reverses and RSI confirms overbought/oversold conditions.
4. Plot stop-loss levels for risk management.
---
### Conclusion:
The *MSB+VolATR* indicator is a versatile tool for traders seeking to capitalize on market structure breakouts with added confirmation from volume and volatility. By customizing the input settings, traders can adapt the indicator to their preferred trading style and risk tolerance. Whether you're a swing trader, positional trader, or algorithmic trader, this indicator provides actionable insights to enhance your trading strategy.

PTS - Bollinger Bands with Trailing StopPTS - Bollinger Bands with Trailing Stop Strategy
Overview
The "PTS - Bollinger Bands with Trailing Stop" strategy is designed to capitalize on strong bullish market movements by combining the Bollinger Bands indicator with a dynamic trailing stop based on the Average True Range (ATR). This strategy aims to enter long positions during upward breakouts and protect profits through an adaptive exit mechanism.
Key Features
1. Bollinger Bands Indicator
Basis Moving Average Type: Choose from SMA, EMA, SMMA, WMA, or VWMA for the Bollinger Bands' basis line. Length: Adjustable period for calculating the moving average and standard deviation (default is 20). Standard Deviation Multiplier (StdDev): Determines the width of the bands (default is 2.0). Source: Select the price data used for calculations (default is the closing price).
2. Entry Conditions
The strategy enters a long position when the closing price crosses above the upper Bollinger Band , indicating strong upward momentum.
3. Exit Conditions
Trailing Stop Loss: Implemented using ATR to adjust dynamically with market volatility. ATR Length: Period for calculating ATR (default is 14). ATR Multiplier for Trailing Stop: Determines how closely the trailing stop follows the price (default is 2.0). Close Below Lower Bollinger Band: The strategy exits the long position if the closing price crosses below the lower Bollinger Band .
4. Risk Management
Commission and Slippage: Commission is set at 0.1%; slippage is set to 3. Position Sizing: Uses 100% of equity per trade (adjustable).
5. Date Range Filter
Specify the time period during which the strategy is active. Start Date: January 1, 2018. End Date: December 31, 2069.
Customizable Inputs
BB Length: Adjust the period for Bollinger Bands calculation. BB StdDev: Modify the standard deviation multiplier. Basis MA Type: Select the moving average type. Source: Choose the price data source. Offset: Shift the Bollinger Bands on the chart. ATR Length: Set the period for ATR calculation. ATR Multiplier for Trailing Stop: Adjust the trailing stop sensitivity.
Thought for 1m 7s
Description for the "PTS - Bollinger Bands with Trailing Stop" Strategy
PTS - Bollinger Bands with Trailing Stop Strategy
Overview
The "PTS - Bollinger Bands with Trailing Stop" strategy is designed to capitalize on strong bullish market movements by combining the Bollinger Bands indicator with a dynamic trailing stop based on the Average True Range (ATR). This strategy aims to enter long positions during upward breakouts and protect profits through an adaptive exit mechanism.
Key Features
1. Bollinger Bands Indicator
Basis Moving Average Type: Choose from SMA, EMA, SMMA, WMA, or VWMA for the Bollinger Bands' basis line. Length: Adjustable period for calculating the moving average and standard deviation (default is 20). Standard Deviation Multiplier (StdDev): Determines the width of the bands (default is 2.0). Source: Select the price data used for calculations (default is the closing price).
2. Entry Conditions
The strategy enters a long position when the closing price crosses above the upper Bollinger Band , indicating strong upward momentum.
3. Exit Conditions
Trailing Stop Loss: Implemented using ATR to adjust dynamically with market volatility. ATR Length: Period for calculating ATR (default is 14). ATR Multiplier for Trailing Stop: Determines how closely the trailing stop follows the price (default is 2.0). Close Below Lower Bollinger Band: The strategy exits the long position if the closing price crosses below the lower Bollinger Band .
4. Risk Management
Commission and Slippage: Commission is set at 0.1%; slippage is set to 3. Position Sizing: Uses 100% of equity per trade (adjustable).
5. Date Range Filter
Specify the time period during which the strategy is active. Start Date: January 1, 2018. End Date: December 31, 2069.
Customizable Inputs
BB Length: Adjust the period for Bollinger Bands calculation. BB StdDev: Modify the standard deviation multiplier. Basis MA Type: Select the moving average type. Source: Choose the price data source. Offset: Shift the Bollinger Bands on the chart. ATR Length: Set the period for ATR calculation. ATR Multiplier for Trailing Stop: Adjust the trailing stop sensitivity.
How the Strategy Works
1. Initialization
Calculates Bollinger Bands and ATR based on selected parameters.
2. Entry Logic
Opens a long position when the closing price exceeds the upper Bollinger Band.
3. Exit Logic
Uses a trailing stop loss based on ATR. Exits if the closing price drops below the lower Bollinger Band.
4. Date Filtering
Executes trades only within the specified date range.
Advantages
Adaptive Risk Management: Trailing stop adjusts to market volatility. Simplicity: Clear entry and exit signals. Customizable Parameters: Tailor the strategy to different assets or conditions.
Considerations
Aggressive Position Sizing: Using 100% equity per trade is high-risk. Market Conditions: Best in trending markets; may produce false signals in sideways markets. Backtesting: Always test on historical data before live trading.
Disclaimer
This strategy is intended for educational and informational purposes only. Trading involves significant risk, and past performance is not indicative of future results. Assess your financial situation and consult a financial advisor if necessary.
Usage Instructions
1. Apply the Strategy: Add it to your TradingView chart. 2. Configure Inputs: Adjust parameters to suit your style and asset. 3. Analyze Backtest Results: Use the Strategy Tester. 4. Optimize Parameters: Experiment with input values. 5. Risk Management: Evaluate position sizing and incorporate risk controls.
Final Notes
The "PTS - Bollinger Bands with Trailing Stop" strategy provides a framework to leverage momentum breakouts while managing risk through adaptive trailing stops. Customize and test thoroughly to align with your trading objectives.

Sine-Weighted MA ATR [InvestorUnknown]The Sine-Weighted MA ATR is a technical analysis tool designed to emphasize recent price data using sine-weighted calculations , making it particularly well-suited for analyzing cyclical markets with repetitive patterns . The indicator combines the Sine-Weighted Moving Average (SWMA) and a Sine-Weighted Average True Range (SWATR) to enhance price trend detection and volatility analysis.
Sine-Weighted Moving Average (SWMA):
Unlike traditional moving averages that apply uniform or exponentially decaying weights, the SWMA applies Sine weights to the price data.
Emphasis on central data points: The Sine function assigns more weight to the middle of the lookback period, giving less importance to the beginning and end points. This helps capture the main trend more effectively while reducing noise from recent volatility or older data.
// Function to calculate the Sine-Weighted Moving Average
f_Sine_Weighted_MA(series float src, simple int length) =>
var float sine_weights = array.new_float(0)
array.clear(sine_weights) // Clear the array before recalculating weights
for i = 0 to length - 1
weight = math.sin((math.pi * (i + 1)) / length)
array.push(sine_weights, weight)
// Normalize the weights
sum_weights = array.sum(sine_weights)
for i = 0 to length - 1
norm_weight = array.get(sine_weights, i) / sum_weights
array.set(sine_weights, i, norm_weight)
// Calculate Sine-Weighted Moving Average
swma = 0.0
if bar_index >= length
for i = 0 to length - 1
swma := swma + array.get(sine_weights, i) * close
swma
Sine-Weighted ATR:
This is a variation of the Average True Range (ATR), which measures market volatility. Like the SWMA, the ATR is smoothed using Sine-based weighting, where central values are more heavily considered compared to the extremities. This improves sensitivity to changes in volatility while maintaining stability in highly volatile markets.
// Function to calculate the Sine-Weighted ATR
f_Sine_Weighted_ATR(simple int length) =>
var float sine_weights_atr = array.new_float(0)
array.clear(sine_weights_atr)
for i = 0 to length - 1
weight = math.sin((math.pi * (i + 1)) / length)
array.push(sine_weights_atr, weight)
// Normalize the weights
sum_weights_atr = array.sum(sine_weights_atr)
for i = 0 to length - 1
norm_weight_atr = array.get(sine_weights_atr, i) / sum_weights_atr
array.set(sine_weights_atr, i, norm_weight_atr)
// Calculate Sine-Weighted ATR using true ranges
swatr = 0.0
tr = ta.tr(true) // True Range
if bar_index >= length
for i = 0 to length - 1
swatr := swatr + array.get(sine_weights_atr, i) * tr
swatr
ATR Bands:
Upper and lower bands are created by adding/subtracting the Sine-Weighted ATR from the SWMA. These bands help identify overbought or oversold conditions, and when the price crosses these levels, it may generate long or short trade signals.
// - - - - - CALCULATIONS - - - - - //{
bar b = bar.new()
float src = b.calc_src(swma_src)
float swma = f_Sine_Weighted_MA(src, ma_length)
// Use normal ATR or Sine-Weighted ATR based on input
float atr = atr_type == "Normal ATR" ? ta.atr(atr_len) : f_Sine_Weighted_ATR(atr_len)
// Calculate upper and lower bands using ATR
float swma_up = swma + (atr * atr_mult)
float swma_dn = swma - (atr * atr_mult)
float src_l = b.calc_src(src_long)
float src_s = b.calc_src(src_short)
// Signal logic for crossovers and crossunders
var int signal = 0
if ta.crossover(src_l, swma_up)
signal := 1
if ta.crossunder(src_s, swma_dn)
signal := -1
//}
Signal Logic:
Long/Short Signals are triggered when the price crosses above or below the Sine-Weighted ATR bands
Backtest Mode and Equity Calculation
To evaluate its effectiveness, the indicator includes a backtest mode, allowing users to test its performance on historical data:
Backtest Equity: A detailed equity curve is calculated based on the generated signals over a user-defined period (startDate to endDate).
Buy and Hold Comparison: Alongside the strategy’s equity, a Buy-and-Hold equity curve is plotted for performance comparison.
Alerts
The indicator includes built-in alerts for both long and short signals, ensuring users are promptly notified when market conditions meet the criteria for an entry or exit.

DataDoodles ATR RangeThe "DataDoodles ATR Range" indicator provides a comprehensive visual representation of the Average True Range (ATR) levels based on the previous bar's close price . It includes both the raw ATR and an Exponential Moving Average (EMA) of the ATR to offer a smoother view of the range volatility. This indicator is ideal for traders who want to quickly assess potential price movements relative to recent volatility.
Key Features:
ATR Levels Above and Below Close: The indicator calculates and displays three levels of ATR-based ranges above and below the previous close price. These levels are visualized on the chart using distinct colors:
- 1ATR Above/Below
- 2ATR Above/Below
- 3ATR Above/Below
EMA of ATR
Includes the EMA of ATR to provide a smoother trend of the ATR values, helping traders identify long-term volatility trends.
Color-Coded Ranges: The plotted ranges are color-coded for easy identification, with warm gradient tones applied to the corresponding data table for quick reference.
Customizable Table: A data table is displayed at the bottom right corner of the chart, providing real-time values for ATR, EMA ATR, and the various ATR ranges.
Usage
This indicator is useful for traders who rely on volatility analysis to set stop losses, take profit levels, or simply understand the current market conditions. By visualizing ATR ranges directly on the chart, traders can better anticipate potential price movements and adjust their strategies accordingly.
Customization
ATR Length: The default ATR length is set to 14 but can be customized to fit your trading strategy.
Table Positioning: The data table is placed in the bottom right corner by default but can be moved as needed.
How to Use
Add the "DataDoodles ATR Range" indicator to your chart.
Observe the plotted lines for potential support and resistance levels based on recent volatility.
Use the data table for quick reference to ATR values and range levels.
Disclaimer: This indicator is a tool for analysis and should be used in conjunction with other indicators and analysis methods. Always practice proper risk management and consider market conditions before making trading decisions.

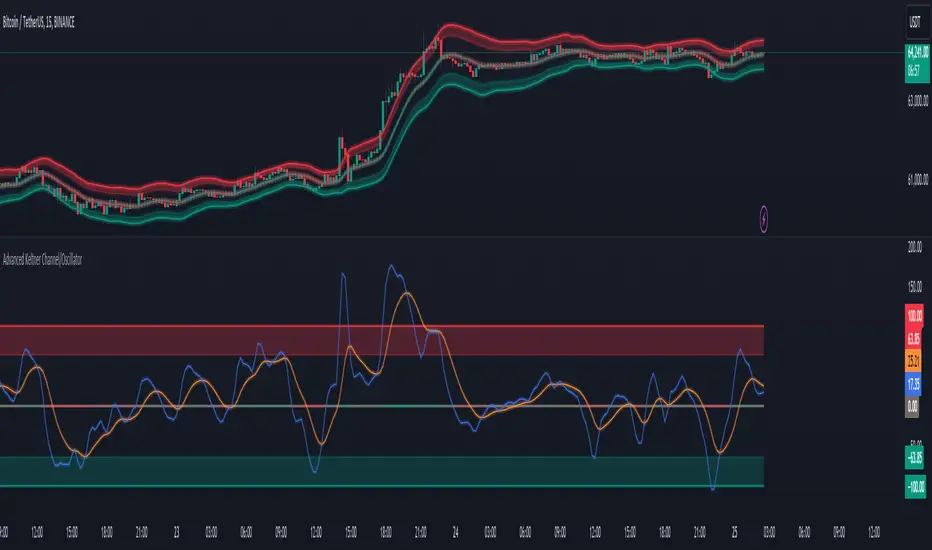
Advanced Keltner Channel/Oscillator [MyTradingCoder]This indicator combines a traditional Keltner Channel overlay with an oscillator, providing a comprehensive view of price action, trend, and momentum. The core of this indicator is its advanced ATR calculation, which uses statistical methods to provide a more robust measure of volatility.
Starting with the overlay component, the center line is created using a biquad low-pass filter applied to the chosen price source. This provides a smoother representation of price than a simple moving average. The upper and lower channel lines are then calculated using the statistically derived ATR, with an additional set of mid-lines between the center and outer lines. This creates a more nuanced view of price action within the channel.
The color coding of the center line provides an immediate visual cue of the current price momentum. As the price moves up relative to the ATR, the line shifts towards the bullish color, and vice versa for downward moves. This color gradient allows for quick assessment of the current market sentiment.
The oscillator component transforms the channel into a different perspective. It takes the price's position within the channel and maps it to either a normalized -100 to +100 scale or displays it in price units, depending on your settings. This oscillator essentially shows where the current price is in relation to the channel boundaries.
The oscillator includes two key lines: the main oscillator line and a signal line. The main line represents the current position within the channel, smoothed by an exponential moving average (EMA). The signal line is a further smoothed version of the oscillator line. The interaction between these two lines can provide trading signals, similar to how MACD is often used.
When the oscillator line crosses above the signal line, it might indicate bullish momentum, especially if this occurs in the lower half of the oscillator range. Conversely, the oscillator line crossing below the signal line could signal bearish momentum, particularly if it happens in the upper half of the range.
The oscillator's position relative to its own range is also informative. Values near the top of the range (close to 100 if normalized) suggest that price is near the upper Keltner Channel band, indicating potential overbought conditions. Values near the bottom of the range (close to -100 if normalized) suggest proximity to the lower band, potentially indicating oversold conditions.
One of the strengths of this indicator is how the overlay and oscillator work together. For example, if the price is touching the upper band on the overlay, you'd see the oscillator at or near its maximum value. This confluence of signals can provide stronger evidence of overbought conditions. Similarly, the oscillator hitting extremes can draw your attention to price action at the channel boundaries on the overlay.
The mid-lines on both the overlay and oscillator provide additional nuance. On the overlay, price action between the mid-line and outer line might suggest strong but not extreme momentum. On the oscillator, this would correspond to readings in the outer quartiles of the range.
The customizable visual settings allow you to adjust the indicator to your preferences. The glow effects and color coding can make it easier to quickly interpret the current market conditions at a glance.
Overlay Component:
The overlay displays Keltner Channel bands dynamically adapting to market conditions, providing clear visual cues for potential trend reversals, breakouts, and overbought/oversold zones.
The center line is a biquad low-pass filter applied to the chosen price source.
Upper and lower channel lines are calculated using a statistically derived ATR.
Includes mid-lines between the center and outer channel lines.
Color-coded based on price movement relative to the ATR.
Oscillator Component:
The oscillator component complements the overlay, highlighting momentum and potential turning points.
Normalized values make it easy to compare across different assets and timeframes.
Signal line crossovers generate potential buy/sell signals.
Advanced ATR Calculation:
Uses a unique method to compute ATR, incorporating concepts like root mean square (RMS) and z-score clamping.
Provides both an average and mode-based ATR value.
Customizable Visual Settings:
Adjustable colors for bullish and bearish moves, oscillator lines, and channel components.
Options for line width, transparency, and glow effects.
Ability to display overlay, oscillator, or both simultaneously.
Flexible Parameters:
Customizable inputs for channel width multiplier, ATR period, smoothing factors, and oscillator settings.
Adjustable Q factor for the biquad filter.
Key Advantages:
Advanced ATR Calculation: Utilizes a statistical method to generate ATR, ensuring greater responsiveness and accuracy in volatile markets.
Overlay and Oscillator: Provides a comprehensive view of price action, combining trend and momentum analysis.
Customizable: Adjust settings to fine-tune the indicator to your specific needs and trading style.
Visually Appealing: Clear and concise design for easy interpretation.
The ATR (Average True Range) in this indicator is derived using a sophisticated statistical method that differs from the traditional ATR calculation. It begins by calculating the True Range (TR) as the difference between the high and low of each bar. Instead of a simple moving average, it computes the Root Mean Square (RMS) of the TR over the specified period, giving more weight to larger price movements. The indicator then calculates a Z-score by dividing the TR by the RMS, which standardizes the TR relative to recent volatility. This Z-score is clamped to a maximum value (10 in this case) to prevent extreme outliers from skewing the results, and then rounded to a specified number of decimal places (2 in this script).
These rounded Z-scores are collected in an array, keeping track of how many times each value occurs. From this array, two key values are derived: the mode, which is the most frequently occurring Z-score, and the average, which is the weighted average of all Z-scores. These values are then scaled back to price units by multiplying by the RMS.
Now, let's examine how these values are used in the indicator. For the Keltner Channel lines, the mid lines (top and bottom) use the mode of the ATR, representing the most common volatility state. The max lines (top and bottom) use the average of the ATR, incorporating all volatility states, including less common but larger moves. By using the mode for the mid lines and the average for the max lines, the indicator provides a nuanced view of volatility. The mid lines represent the "typical" market state, while the max lines account for less frequent but significant price movements.
For the color coding of the center line, the mode of the ATR is used to normalize the price movement. The script calculates the difference between the current price and the price 'degree' bars ago (default is 2), and then divides this difference by the mode of the ATR. The resulting value is passed through an arctangent function and scaled to a 0-1 range. This scaled value is used to create a color gradient between the bearish and bullish colors.
Using the mode of the ATR for this color coding ensures that the color changes are based on the most typical volatility state of the market. This means that the color will change more quickly in low volatility environments and more slowly in high volatility environments, providing a consistent visual representation of price momentum relative to current market conditions.
Using a good IIR (Infinite Impulse Response) low-pass filter, such as the biquad filter implemented in this indicator, offers significant advantages over simpler moving averages like the EMA (Exponential Moving Average) or other basic moving averages.
At its core, an EMA is indeed a simple, single-pole IIR filter, but it has limitations in terms of its frequency response and phase delay characteristics. The biquad filter, on the other hand, is a two-pole, two-zero filter that provides superior control over the frequency response curve. This allows for a much sharper cutoff between the passband and stopband, meaning it can more effectively separate the signal (in this case, the underlying price trend) from the noise (short-term price fluctuations).
The improved frequency response of a well-designed biquad filter means it can achieve a better balance between smoothness and responsiveness. While an EMA might need a longer period to sufficiently smooth out price noise, potentially leading to more lag, a biquad filter can achieve similar or better smoothing with less lag. This is crucial in financial markets where timely information is vital for making trading decisions.
Moreover, the biquad filter allows for independent control of the cutoff frequency and the Q factor. The Q factor, in particular, is a powerful parameter that affects the filter's resonance at the cutoff frequency. By adjusting the Q factor, users can fine-tune the filter's behavior to suit different market conditions or trading styles. This level of control is simply not available with basic moving averages.
Another advantage of the biquad filter is its superior phase response. In the context of financial data, this translates to more consistent lag across different frequency components of the price action. This can lead to more reliable signals, especially when it comes to identifying trend changes or price reversals.
The computational efficiency of biquad filters is also worth noting. Despite their more complex mathematical foundation, biquad filters can be implemented very efficiently, often requiring only a few operations per sample. This makes them suitable for real-time applications and high-frequency trading scenarios.
Furthermore, the use of a more sophisticated filter like the biquad can help in reducing false signals. The improved noise rejection capabilities mean that minor price fluctuations are less likely to cause unnecessary crossovers or indicator movements, potentially leading to fewer false breakouts or reversal signals.
In the specific context of a Keltner Channel, using a biquad filter for the center line can provide a more stable and reliable basis for the entire indicator. It can help in better defining the overall trend, which is crucial since the Keltner Channel is often used for trend-following strategies. The smoother, yet more responsive center line can lead to more accurate channel boundaries, potentially improving the reliability of overbought/oversold signals and breakout indications.
In conclusion, this advanced Keltner Channel indicator represents a significant evolution in technical analysis tools, combining the power of traditional Keltner Channels with modern statistical methods and signal processing techniques. By integrating a sophisticated ATR calculation, a biquad low-pass filter, and a complementary oscillator component, this indicator offers traders a comprehensive and nuanced view of market dynamics.
The indicator's strength lies in its ability to adapt to varying market conditions, providing clear visual cues for trend identification, momentum assessment, and potential reversal points. The use of statistically derived ATR values for channel construction and the implementation of a biquad filter for the center line result in a more responsive and accurate representation of price action compared to traditional methods.
Furthermore, the dual nature of this indicator – functioning as both an overlay and an oscillator – allows traders to simultaneously analyze price trends and momentum from different perspectives. This multifaceted approach can lead to more informed decision-making and potentially more reliable trading signals.
The high degree of customization available in the indicator's settings enables traders to fine-tune its performance to suit their specific trading styles and market preferences. From adjustable visual elements to flexible parameter inputs, users can optimize the indicator for various trading scenarios and time frames.
Ultimately, while no indicator can predict market movements with certainty, this advanced Keltner Channel provides traders with a powerful tool for market analysis. By offering a more sophisticated approach to measuring volatility, trend, and momentum, it equips traders with valuable insights to navigate the complex world of financial markets. As with any trading tool, it should be used in conjunction with other forms of analysis and within a well-defined risk management framework to maximize its potential benefits.
Fourier Adjusted Average True Range [BackQuant]Fourier Adjusted Average True Range
1. Conceptual Foundation and Innovation
The FA-ATR leverages the principles of Fourier analysis to dissect market prices into their constituent cyclical components. By applying Fourier Transform to the price data, the FA-ATR captures the dominant cycles and trends which are often obscured in noisy market data. This integration allows the FA-ATR to adapt its readings based on underlying market dynamics, offering a refined view of volatility that is sensitive to both market direction and momentum.
2. Technical Composition and Calculation
The core of the FA-ATR involves calculating the traditional ATR, which measures market volatility by decomposing the entire range of price movements. The FA-ATR extends this by incorporating a Fourier Transform of price data to assess cyclical patterns over a user-defined period 'N'. This process synthesizes both the magnitude of price changes and their rhythmic occurrences, resulting in a more comprehensive volatility indicator.
Fourier Transform Application: The Fourier series is calculated using price data to identify the fundamental frequency of market movements. This frequency helps in adjusting the ATR to reflect more accurately the current market conditions.
Dynamic Adjustment: The ATR is then adjusted by the magnitude of the dominant cycle from the Fourier analysis, enhancing or reducing the ATR value based on the intensity and phase of market cycles.
3. Features and User Inputs
Customizability: Traders can modify the Fourier period, ATR period, and the multiplication factor to suit different trading styles and market environments.
Visualization : The FA-ATR can be plotted directly on the chart, providing a visual representation of volatility. Additionally, the option to paint candles according to the trend direction enhances the usability and interpretative ease of the indicator.
Confluence with Moving Averages: Optionally, a moving average of the FA-ATR can be displayed, serving as a confluence factor for confirming trends or potential reversals.
4. Practical Applications
The FA-ATR is particularly useful in markets characterized by periodic fluctuations or those that exhibit strong cyclical trends. Traders can utilize this indicator to:
Adjust Stop-Loss Orders: More accurately set stop-loss orders based on a volatility measure that accounts for cyclical market changes.
Trend Confirmation: Use the FA-ATR to confirm trend strength and sustainability, helping to avoid false signals often encountered in volatile markets.
Strategic Entry and Exit: The indicator's responsiveness to changing market dynamics makes it an excellent tool for planning entries and exits in a trend-following or a breakout trading strategy.
5. Advantages and Strategic Value
By integrating Fourier analysis, the FA-ATR provides a volatility measure that is both adaptive and anticipatory, giving traders a forward-looking tool that adjusts to changes before they become apparent through traditional indicators. This anticipatory feature makes it an invaluable asset for traders looking to gain an edge in fast-paced and rapidly changing market conditions.
6. Summary and Usage Tips
The Fourier Adjusted Average True Range is a cutting-edge development in technical analysis, offering traders an enhanced tool for assessing market volatility with increased accuracy and responsiveness. Its ability to adapt to the market's cyclical nature makes it particularly useful for those trading in highly volatile or cyclically influenced markets.
Traders are encouraged to integrate the FA-ATR into their trading systems as a supplementary tool to improve risk management and decision-making accuracy, thereby potentially increasing the effectiveness of their trading strategies.
INDEX:BTCUSD
INDEX:ETHUSD
BINANCE:SOLUSD

Modified ATR Indicator [KL]Modified Average True Range (ATR) Indicator
This indicator displays the ATR with relative highs and relative lows statistically determined.
What is ATR:
To know what ATR is, we need to understand what a True Range (TR) is.
- TR at a given bar is the highest distance between points: a) High vs low, b) High vs Close, and c) Low vs Close.
- ATR is the moving average of TRs over a predefined lookback period; 14 is the most commonly used.
- ATR can be mathematically expressed as:
Why is ATR Important
ATR often used to measure volatility; high volatility is indicated by high ATR, vice versa for low. This is a versatile tool allowing traders to determine entry/exit points, as well as the size of stop losses and when to take profits relative to it.
This is an opinion: Through observations, I have noticed that ATR can also indirectly tell us the levels of relative volume. This intuitively makes sense because in order to increase length of TR, high amounts of capital inflow/outflow is required (graphically speaking, high volume is required in order to make lengths of candle sticks longer). The relationship between ATR and relative volume should hold unless the market is illiquid to the extreme that there is no relationship between volume and price.
That said, knowing the relative lows/highs of ATR is very useful. It can be interpreted as:
- Relative high = high volatility, usually during sell offs
- Relative low = decreasing volume, could indicate price consolidation
Instead of arbitrarily determining whether ATR is high/low, this indicator will determine relative highs and relative lows using a simple statistical model.
How relative high/low is determined by this model
This indicator applies two-tailed hypothesis testing to test whether ATR (ie. say lookback of 14) has greatly deviated from a larger sample size (ie. lookback of 50). Assuming ATR is normally distributed and variance is known, then test statistic (z) can be used to determine whether ATR14 is within the critical area under Null Hypothesis: ATR14 == ATR50. If z falls below/above the left/right critical values (ie. 1.645 for a 90% confidence interval), then this is shown by the indicator through using different colors to plot the ATR line.
FVG ATRFVG ATR — Fair Value Gap Size Measured in ATR Units
This Pine Script v6 indicator detects Fair Value Gaps and displays their size as a ratio of the Average True Range, providing traders with a normalized measurement of gap significance across different market conditions and timeframes.
Key Features
Automatic FVG Detection
The indicator identifies bullish and bearish Fair Value Gaps using the standard three-candle pattern. Bullish FVGs occur when the current low exceeds the high from two bars ago, while bearish FVGs occur when the current high falls below the low from two bars ago.
ATR Ratio Calculation
Each detected FVG is measured against the current Average True Range at the moment of detection. The ratio is displayed as a compact label next to the gap, showing values like "ATR: 0.75" or "ATR: 1.41". This normalization allows comparison of gap significance across volatile and calm market periods.
Minimal Visual Footprint
Labels are displayed directly on the chart without boxes or lines, using customizable text sizes from tiny to large. The default tiny size ensures the chart remains uncluttered while providing essential information at a glance.
Highly Customizable Display
All visual aspects are configurable through input parameters, including label position (top, middle, or bottom of gap), text size, text color, optional background, and horizontal offset from the detection candle.
Customizable Parameters
Detection Settings
Detect Bullish FVG: Enable or disable detection of bullish gaps. Default is enabled.
Detect Bearish FVG: Enable or disable detection of bearish gaps. Default is enabled.
Min Size (pips): Filter out small gaps below the specified threshold. One pip equals 10 ticks for most Forex pairs. Default is 10 pips.
ATR Calculation
ATR Period: Period length for Average True Range calculation. Default is 14, adjustable to match your trading strategy.
Label Settings
Label Position: Vertical placement of the text label relative to the FVG zone. Options are Top, Middle, or Bottom. Default is Middle.
Label Size: Text size from Tiny (smallest), Small, Normal, to Large. Default is Tiny for minimal chart clutter.
Text Color: Custom color for label text. Default is white for visibility on dark themes.
Show Background: Toggle to display labels with a colored background box or as transparent text only. Default is disabled for cleaner appearance.
Background Color: Custom color for label background when enabled. Default is semi-transparent gray.
Label Offset (bars): Horizontal distance in bars between the detection candle and the label. Set to 0 for labels directly on the candle, or increase for separation. Default is 0.
Recommended Use Cases
Multi-Timeframe Analysis
Compare FVG significance across different timeframes by observing ATR ratios. A 1.5 ATR gap on the 1-hour chart may indicate different significance than the same ratio on the daily chart.
Volatility-Adjusted Trading
Use ATR ratios to filter for only the most significant gaps. For example, only trade FVGs with ratios above 1.0 to focus on gaps larger than typical price movement.
Risk Management
Size positions based on gap magnitude relative to current volatility. Larger ATR ratios may warrant tighter stops or smaller position sizes.
Market Efficiency Analysis
Track how quickly and completely different-sized gaps get filled. Gaps with higher ATR ratios may take longer to fill or act as stronger support and resistance zones.
Technical Details
This indicator is written in Pine Script v6 and follows all recommended coding standards including strict 4-space indentation, lazy boolean evaluation, and proper type declarations. The script uses array-based storage to maintain up to 500 labels simultaneously.
The ATR ratio is calculated at the moment of FVG detection and remains fixed, never repainting. The calculation divides the FVG height (distance between gap boundaries) by the current ATR value using the specified period. Division by zero is protected with conditional logic.
Label positioning uses the xloc.bar_index and yloc.price system for precise placement. The horizontal offset parameter allows traders to adjust label spacing based on chart zoom level and personal preference. Text formatting uses str.tostring with two decimal places for clear ratio display.
Important Notes
The indicator never repaints as all FVG detections and ATR calculations are fixed upon bar confirmation. Labels persist on the chart until the maximum label count is reached, at which point the oldest labels are automatically removed by TradingView.
For optimal performance on charts with many FVGs, consider increasing the minimum pip size filter or using smaller label sizes. The tiny size option provides the smallest possible text for maximum chart clarity.
Installation and Usage
Copy the source code into the TradingView Pine Editor and add the indicator to your chart. The overlay parameter is set to true, allowing labels to display directly on price candles. Configure all parameters through the indicator settings panel to match your trading style and visual preferences.
100% Pine Script v6 indicator — No repaint — Open source

Gann Fan Strategy [KedarArc Quant]Description
A single-concept, rule-based strategy that trades around a programmatic Gann Fan.
It anchors to a swing (or a manual point), builds 1×1 and related fan lines numerically, and triggers entries when price interacts with the 1×1 (breakout or bounce). Management is done entirely with the fan structure (next/previous line) plus optional ATR trailing.
What TV indicators are used
* Pivots: `ta.pivothigh/ta.pivotlow` to confirm swing highs/lows for anchor selection.
* ATR: `ta.atr` only to scale the 1×1 slope (optional) and for an optional trailing stop.
* EMA: `ta.ema` as a trend filter (e.g., only long above the EMA, short below).
No RSI/MACD/Stoch/Heikin/etc. The logic is one coherent framework: Gann price–time geometry, with ATR as a scale and EMA as a risk filter.
How it works
1. Anchor
* Auto: chooses the most recent *confirmed* pivot (you control Left/Right).
* Manual: set a price and bar index and the fan will hold that point (no re-anchoring).
* Optional Re-anchor when a newer pivot confirms.
2. 1×1 Slope (numeric, not cosmetic)
* ATR mode: `1×1 = ATR(Length) × Multiplier` (adapts to volatility).
* Fixed mode: `ticks per bar` (constant slope).
Because slope is numeric, it doesn’t change with chart zoom, unlike the drawing tool.
3. Fan Lines
Builds classic ratios around the 1×1: 1/8, 1/4, 1/3, 1/2, 1/1, 2/1, 3/1, 4/1, 8/1.
4. Signals
* Breakout: cross of price over/under the 1×1 in the EMA-aligned direction.
* Bounce (optional): touch + reversal across the 1×1 to reduce whipsaw.
5. Exits & Risk
* Take-profit at the next fan line; Stop at the previous fan line.
* If a level is missing (right after re-anchor), a fallback Risk-Reward (RR) is used.
* Optional ATR trailing stop.
Why this is unique
* True numeric fan: The 1×1 slope is calculated from ATR or fixed ticks—not from screen geometry—so it is scale-invariant and reproducible across users/timeframes.
* Deterministic anchor logic: Uses confirmed pivots (with your L/R settings). No look-ahead; anchors update only when the right bars complete.
* Fan-native trade management: Both entries and exits come from the fan structure itself (with a minimal ATR/EMA assist), keeping the method pure.
* Two entry archetypes: Breakout for momentum days; Bounce for range days—switchable without changing the core model.
* Manual mode: Lock a session’s bias by anchoring to a chosen swing (e.g., day’s first major low/high) and keep the fan constant all day.
Inputs (quick guide)
* Auto Anchor (Left/Right): pivot sensitivity. Higher values = fewer, stronger anchors.
* Re-anchor: refresh to newer pivots as they confirm.
* Manual Anchor Price / Bar Index: fixes the fan (turn Auto off).
* Scale 1×1 by ATR: on = adaptive; off = use ticks per bar.
* ATR Length / ATR Multiplier: controls adaptive slope; start around 14 / 0.25–0.35.
* Ticks per bar: exact fixed slope (match a hand-drawn fan by computing slope ÷ mintick).
* EMA Trend Filter: e.g., 50–100; trades only in EMA direction.
* Use Bounce: require touch + reverse across 1×1 (helps in chop).
* TP/SL at fan lines; Fallback RR for missing levels; ATR Trailing Stop optional.
* Transparency/Plot EMA: visual preferences.
Tips
* Range days: larger pivots (L/R 8–12), Bounce ON, ATR Multiplier \~0.30–0.40, EMA 100.
* Trend days: L/R 5–6, Breakout, Multiplier \~0.20–0.30, EMA 50, ATR trail 1.0–1.5.
* Match the TV Gann Fan drawing: turn ATR scale OFF, set ticks per bar = `(Δprice between anchor and 1×1 target) / (bars) / mintick`.
Repainting & testing notes
* Pivots require Right bars to confirm; anchors are set after confirmation (no look-ahead).
* Signals use the current bar close with TradingView strategy mechanics; real-time vs. bar-close can differ slightly, as with any strategy.
* Re-anchoring legitimately moves the structure when new pivots confirm—by design.
⚠️ Disclaimer
This script is provided for educational purposes only.
Past performance does not guarantee future results.
Trading involves risk, and users should exercise caution and use proper risk management when applying this strategy.

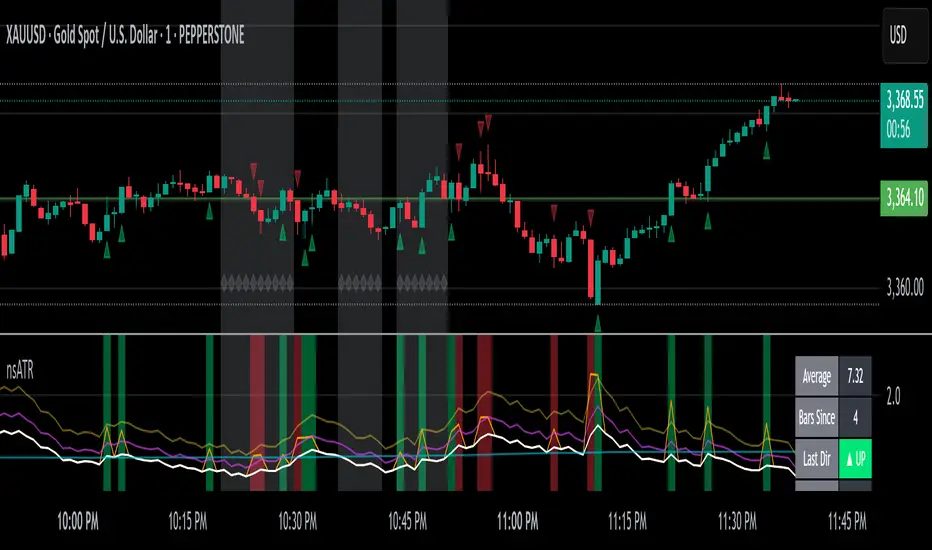
Not-So-Average True Range (nsATR)Not-So-Average True Range (nsATR)
*By Sherlock_MacGyver*
---
Long Story Short
The nsATR is a complete overhaul of traditional ATR analysis. It was designed to solve the fundamental issues with standard ATR, such as lag, lack of contextual awareness, and equal treatment of all volatility events.
Key innovations include:
* A smarter ATR that reacts dynamically when price movement exceeds normal expectations.
* Envelope zones that distinguish between moderate and extreme volatility conditions.
* A long-term ATR baseline that adds historical context to current readings.
* A compression detection system that flags when the market is coiled and ready to break out.
This indicator is designed for traders who want to see volatility the way it actually behaves — contextually, asymmetrically, and with predictive power.
---
What Is This Thing?
Standard ATR (Average True Range) has limitations:
* It smooths too slowly (using Wilder's RMA), which delays detection of meaningful moves.
* It lacks context — no way to know if current volatility is high or low relative to history.
* It treats all volatility equally, regardless of scale or significance.
nsATR** was built from scratch to overcome these weaknesses by applying:
* Amplification of large True Range spikes.
* Visual envelope zones for detecting volatility regimes.
* A long-term context line to anchor current readings.
* Multi-factor compression analysis to anticipate breakouts.
---
Core Features
1. Breach Detection with Amplification
When True Range exceeds a user-defined threshold (e.g., ATR × 1.2), it is amplified using a power function to reflect nonlinear volatility. This amplified value is then smoothed and cascades into future ATR values, affecting the indicator beyond a single bar.
2. Direction Tagging
Volatility spikes are tagged as upward or downward based on basic price momentum (close vs previous close). This provides visual context for how volatility is behaving in real-time.
3. Envelope Zones
Two adaptive envelopes highlight the current volatility regime:
* Stage 1: Moderate volatility (default: ATR × 1.5)
* Stage 2: Extreme volatility (default: ATR × 2.0)
Breaching these zones signals meaningful expansion in volatility.
4. Long-Term Context Baseline
A 200-period simple moving average of the classic ATR establishes whether current readings are above or below long-term volatility expectations.
5. Multi-Signal Compression Detection
Flags potential breakout conditions when:
* ATR is below its long-term baseline
* Price Bollinger Bands are compressed
* RSI Bollinger Bands are also compressed
All three signals must align to plot a "Volatility Confluence Dot" — an early warning of potential expansion.
---
Chart Outputs
In the Indicator Pane:
* Breach Amplified ATR (Orange line)
* Classic ATR baseline (White line)
* Long-Term context baseline (Cyan line)
* Stage 1 and Stage 2 Envelopes (Purple and Yellow lines)
On the Price Chart:
* Triangles for breach direction (green/red)
* Diamonds for compression zones
* Optional background coloring for visual clarity
---
Alerts
Built-in alert conditions:
1. ATR breach detected
2. Stage 1 envelope breached
3. Stage 2 envelope breached
4. Compression zone detected
---
Customization
All components are modular. Traders can adjust:
* Display toggles for each visual layer
* Colors and line widths
* Breach threshold and amplification power
* Envelope sensitivity
* Compression sensitivity and lookback windows
Some options are disabled by default to reduce clutter but can be turned on for more aggressive signal detection.
---
Real-Time Behavior (Non-Repainting Clarification)
The indicator updates in real time on the current bar as new data comes in. This is expected behavior for live trading tools. Once a bar closes, values do not change. In other words, the indicator *does not repaint history* — but the current bar can update dynamically until it closes.
---
Use Cases
* Day traders: Use compression zones to anticipate volatility surges.
* Swing traders: Use envelope breaches for regime awareness.
* System developers: Replace standard ATR in your logic for better responsiveness.
* Risk managers: Use directional volatility signals to better model exposure.
---
About the Developer
Sherlock_MacGyver develops original trading systems that question default assumptions and solve real trader problems.
Dskyz (DAFE) MAtrix with ATR-Powered Precision Dskyz (DAFE) MAtrix with ATR-Powered Precision
This cutting‐edge futures trading strategy built to thrive in rapidly changing market conditions. Developed for high-frequency futures trading on instruments such as the CME Mini MNQ, this strategy leverages a matrix of sophisticated moving averages combined with ATR-based filters to pinpoint high-probability entries and exits. Its unique combination of adaptable technical indicators and multi-timeframe trend filtering sets it apart from standard strategies, providing enhanced precision and dynamic responsiveness.
imgur.com
Core Functional Components
1. Advanced Moving Averages
A distinguishing feature of the DAFE strategy is its robust, multi-choice moving averages (MAs). Clients can choose from a wide array of MAs—each with specific strengths—in order to fine-tune their trading signals. The code includes user-defined functions for the following MAs:
imgur.com
Hull Moving Average (HMA):
The hma(src, len) function calculates the HMA by using weighted moving averages (WMAs) to reduce lag considerably while smoothing price data. This function computes an intermediate WMA of half the specified length, then a full-length WMA, and finally applies a further WMA over the square root of the length. This design allows for rapid adaptation to price changes without the typical delays of traditional moving averages.
Triple Exponential Moving Average (TEMA):
Implemented via tema(src, len), TEMA uses three consecutive exponential moving averages (EMAs) to effectively cancel out lag and capture price momentum. The final formula—3 * (ema1 - ema2) + ema3—produces a highly responsive indicator that filters out short-term noise.
Double Exponential Moving Average (DEMA):
Through the dema(src, len) function, DEMA calculates an EMA and then a second EMA on top of it. Its simplified formula of 2 * ema1 - ema2 provides a smoother curve than a single EMA while maintaining enhanced responsiveness.
Volume Weighted Moving Average (VWMA):
With vwma(src, len), this MA accounts for trading volume by weighting the price, thereby offering a more contextual picture of market activity. This is crucial when volume spikes indicate significant moves.
Zero Lag EMA (ZLEMA):
The zlema(src, len) function applies a correction to reduce the inherent lag found in EMAs. By subtracting a calculated lag (based on half the moving average window), ZLEMA is exceptionally attuned to recent price movements.
Arnaud Legoux Moving Average (ALMA):
The alma(src, len, offset, sigma) function introduces ALMA—a type of moving average designed to be less affected by outliers. With parameters for offset and sigma, it allows customization of the degree to which the MA reacts to market noise.
Kaufman Adaptive Moving Average (KAMA):
The custom kama(src, len) function is noteworthy for its adaptive nature. It computes an efficiency ratio by comparing price change against volatility, then dynamically adjusts its smoothing constant. This results in an MA that quickly responds during trending periods while remaining smoothed during consolidation.
Each of these functions—integrated into the strategy—is selectable by the trader (via the fastMAType and slowMAType inputs). This flexibility permits the tailored application of the MA most suited to current market dynamics and individual risk management preferences.
2. ATR-Based Filters and Risk Controls
ATR Calculation and Volatility Filter:
The strategy computes the Average True Range (ATR) over a user-defined period (atrPeriod). ATR is then used to derive both:
Volatility Assessment: Expressed as a ratio of ATR to closing price, ensuring that trades are taken only when volatility remains within a safe, predefined threshold (volatilityThreshold).
ATR-Based Entry Filters: Implemented as atrFilterLong and atrFilterShort, these conditions ensure that for long entries the price is sufficiently above the slow MA and vice versa for shorts. This acts as an additional confirmation filter.
Dynamic Exit Management:
The exit logic employs a dual approach:
Fixed Stop and Profit Target: Stops and targets are set at multiples of ATR (fixedStopMultiplier and profitTargetATRMult), helping manage risk in volatile markets.
Trailing Stop Adjustments: A trailing stop is calculated using the ATR multiplied by a user-defined offset (trailOffset), which captures additional profits as the trade moves favorably while protecting against reversals.
3. Multi-Timeframe Trend Filtering
The strategy enhances its signal reliability by leveraging a secondary, higher timeframe analysis:
15-Minute Trend Analysis:
By retrieving 15-minute moving averages (fastMA15m and slowMA15m) via request.security, the strategy determines the broader market trend. This secondary filter (enabled or disabled through useTrendFilter) ensures that entries are aligned with the prevailing market direction, thereby reducing the incidence of false signals.
4. Signal and Execution Logic
Combined MA Alignment:
The entry conditions are based primarily on the alignment of the fast and slow MAs. A long condition is triggered when the current price is above both MAs and the fast MA is above the slow MA—complemented by the ATR filter and volume conditions. The reverse applies for a short condition.
Volume and Time Window Validation:
Trades are permitted only if the current volume exceeds a minimum (minVolume) and the current hour falls within the predefined trading window (tradingStartHour to tradingEndHour). An additional volume spike check (comparing current volume to a moving average of past volumes) further filters for optimal market conditions.
Comprehensive Order Execution:
The strategy utilizes flexible order execution functions that allow pyramiding (up to 10 positions), ensuring that it can scale into positions as favorable conditions persist. The use of both market entries and automated exits (with profit targets, stop-losses, and trailing stops) ensures that risk is managed at every step.
5. Integrated Dashboard and Metrics
For transparency and real-time analysis, the strategy includes:
On-Chart Visualizations:
Both fast and slow MAs are plotted on the chart, making it easy to see the market’s technical foundation.
Dynamic Metrics Dashboard:
A built-in table displays crucial performance statistics—including current profit/loss, equity, ATR (both raw and as a percentage), and the percentage gap between the moving averages. These metrics offer immediate insight into the health and performance of the strategy.
Input Parameters: Detailed Breakdown
Every input is meticulously designed to offer granular control:
Fast & Slow Lengths:
Determine the window size for the fast and slow moving averages. Smaller values yield more sensitivity, while larger values provide a smoother, delayed response.
Fast/Slow MA Types:
Choose the type of moving average for fast and slow signals. The versatility—from basic SMA and EMA to more complex ones like HMA, TEMA, ZLEMA, ALMA, and KAMA—allows customization to fit different market scenarios.
ATR Parameters:
atrPeriod and atrMultiplier shape the volatility assessment, directly affecting entry filters and risk management through stop-loss and profit target levels.
Trend and Volume Filters:
Inputs such as useTrendFilter, minVolume, and the volume spike condition help confirm that a trade occurs in active, trending markets rather than during periods of low liquidity or market noise.
Trading Hours:
Restricting trade execution to specific hours (tradingStartHour and tradingEndHour) helps avoid illiquid or choppy markets outside of prime trading sessions.
Exit Strategies:
Parameters like trailOffset, profitTargetATRMult, and fixedStopMultiplier provide multiple layers of risk management and profit protection by tailoring how exits are generated relative to current market conditions.
Pyramiding and Fixed Trade Quantity:
The strategy supports multiple entries within a trend (up to 10 positions) and sets a predefined trade quantity (fixedQuantity) to maintain consistent exposure and risk per trade.
Dashboard Controls:
The resetDashboard input allows for on-the-fly resetting of performance metrics, keeping the strategy’s performance dashboard accurate and up-to-date.
Why This Strategy is Truly Exceptional
Multi-Faceted Adaptability:
The ability to switch seamlessly between various moving average types—each suited to particular market conditions—enables the strategy to adapt dynamically. This is a testament to the high level of coding sophistication and market insight infused within the system.
Robust Risk Management:
The integration of ATR-based stops, profit targets, and trailing stops ensures that every trade is executed with well-defined risk parameters. The system is designed to mitigate unexpected market swings while optimizing profit capture.
Comprehensive Market Filtering:
By combining moving average crossovers with volume analysis, volatility thresholds, and multi-timeframe trend filters, the strategy only enters trades under the most favorable conditions. This multi-layered filtering reduces noise and enhances signal quality.
-Final Thoughts-
The Dskyz Adaptive Futures Elite (DAFE) MAtrix with ATR-Powered Precision strategy is not just another trading algorithm—it is a multi-dimensional, fully customizable system built on advanced technical principles and sophisticated risk management techniques. Every function and input parameter has been carefully engineered to provide traders with a system that is both powerful and transparent.
For clients seeking a state-of-the-art trading solution that adapts dynamically to market conditions while maintaining strict discipline in risk management, this strategy truly stands in a class of its own.
****Please show support if you enjoyed this strategy. I'll have more coming out in the near future!!
-Dskyz
Caution
DAFE is experimental, not a profit guarantee. Futures trading risks significant losses due to leverage. Backtest, simulate, and monitor actively before live use. All trading decisions are your responsibility.

00 Averaging Down Backtest Strategy by RPAlawyer v21FOR EDUCATIONAL PURPOSES ONLY! THE CODE IS NOT YET FULLY DEVELOPED, BUT IT CAN PROVIDE INTERESTING DATA AND INSIGHTS IN ITS CURRENT STATE.
This strategy is an 'averaging down' backtester strategy. The goal of averaging/doubling down is to buy more of an asset at a lower price to reduce your average entry price.
This backtester code proves why you shouldn't do averaging down, but the code can be developed (and will be developed) further, and there might be settings even in its current form that prove that averaging down can be done effectively.
Different averaging down strategies exist:
- Linear/Fixed Amount: buy $1000 every time price drops 5%
- Grid Trading: Placing orders at price levels, often with increasing size, like $1000 at -5%, $2000 at -10%
- Martingale: doubling the position size with each new entry
- Reverse Martingale: decreasing position size as price falls: $4000, then $2000, then $1000
- Percentage-Based: position size based on % of remaining capital, like 10% of available funds at each level
- Dynamic/Adaptive: larger entries during high volatility, smaller during low
- Logarithmic: position sizes increase logarithmically as price drops
Unlike the above average costing strategies, it applies averaging down (I use DCA as a synonym) at a very strong trend reversal. So not at a certain predetermined percentage negative PNL % but at a trend reversal signaled by an indicator - hence it most closely resembles a dynamically moving grid DCA strategy.
Both entering the trade and averaging down assume a strong trend. The signals for trend detection are provided by an indicator that I published under the name '00 Parabolic SAR Trend Following Signals by RPAlawyer', but any indicator that generates numeric signals of 1 and -1 for buy and sell signals can be used.
The indicator must be connected to the strategy: in the strategy settings under 'External Source' you need to select '00 Parabolic SAR Trend Following Signals by RPAlawyer: Connector'. From this point, the strategy detects when the indicator generates buy and sell signals.
The strategy considers a strong trend when a buy signal appears above a very conservative ATR band, or a sell signal below the ATR band. The conservative ATR is chosen to filter ranging markets. This very conservative ATR setting has a default multiplier of 8 and length of 40. The multiplier can be increased up to 10, but there will be very few buy and sell signals at that level and DCA requirements will be very high. Trade entry and DCA occur at these strong trends. In the settings, the 'ATR Filter' setting determines the entry condition (e.g., ATR Filter multiplier of 9), and the 'DCA ATR' determines when DCA will happen (e.g., DCA ATR multiplier of 6).
The DCA levels and DCA amounts are determined as follows:
The first DCA occurs below the DCA Base Deviation% level (see settings, default 3%) which acts as a threshold. The thick green line indicates the long position avg price, and the thin red line below the green line indicates the 3% DCA threshold for long positions. The thick red line indicates the short position avg price, and the thin red line above the thick red line indicates the short position 3% DCA threshold. DCA size multiplier defines the DCA amount invested.
If the loss exceeds 3% AND a buy signal arrives below the lower ATR band for longs, or a sell signal arrives above the upper ATR band for shorts, then the first DCA will be executed. So the first DCA won't happen at 3%, rather 3% is a threshold where the additional condition is that the price must close above or below the ATR band (let's say the first DCA occured at 8%) – this is why the code resembles a dynamic grid strategy, where the grid moves such that alongside the first 3% threshold, a strong trend must also appear for DCA. At this point, the thick green/red line moves because the avg price is modified as a result of the DCA, and the thin red line indicating the next DCA level also moves. The next DCA level is determined by the first DCA level, meaning modified avg price plus an additional +8% + (3% * the Step Scale Multiplier in the settings). This next DCA level will be indicated by the modified thin red line, and the price must break through this level and again break through the ATR band for the second DCA to occur.
Since all this wasn't complicated enough, and I was always obsessed by the idea that when we're sitting in an underwater position for days, doing DCA and waiting for the price to correct, we can actually enter a short position on the other side, on which we can realize profit (if the broker allows taking hedge positions, Binance allows this in Europe).
This opposite position in this strategy can open from the point AFTER THE FIRST DCA OF THE BASE POSITION OCCURS. This base position first DCA actually indicates that the price has already moved against us significantly so time to earn some money on the other side. Breaking through the ATR band is also a condition for entry here, so the hedge position entry is not automatic, and the condition for further DCA is breaking through the DCA Base Deviation (default 3%) and breaking through the ATR band. So for the 'hedge' or rather opposite position, the entry and further DCA conditions are the same as for the base position. The hedge position avg price is indicated by a thick black line and the Next Hedge DCA Level is indicated by a thin black line.
The TPs are indicated by green labels for base positions and red labels for hedge positions.
No SL built into the strategy at this point but you are free to do your coding.
Summary data can be found in the upper right corner.
The fantastic trend reversal indicator Machine learning: Lorentzian Classification by jdehorty can be used as an external indicator, choose 'backtest stream' for the external source. The ATR Band multiplicators need to be reduced to 5-6 when using Lorentz.
The code can be further developed in several aspects, and as I write this, I already have a few ideas 😊

Cosine-Weighted MA ATR [InvestorUnknown]The Cosine-Weighted Moving Average (CWMA) ATR (Average True Range) indicator is designed to enhance the analysis of price movements in financial markets. By incorporating a cosine-based weighting mechanism , this indicator provides a unique approach to smoothing price data and measuring volatility, making it a valuable tool for traders and investors.
Cosine-Weighted Moving Average (CWMA)
The CWMA is calculated using weights derived from the cosine function, which emphasizes different data points in a distinctive manner. Unlike traditional moving averages that assign equal weight to all data points, the cosine weighting allocates more significance to values at the edges of the data window. This can help capture significant price movements while mitigating the impact of outlier values.
The weights are shifted to ensure they remain non-negative, which helps in maintaining a stable calculation throughout the data series. The normalization of these weights ensures they sum to one, providing a proportional contribution to the average.
// Function to calculate the Cosine-Weighted Moving Average with shifted weights
f_Cosine_Weighted_MA(series float src, simple int length) =>
var float cosine_weights = array.new_float(0)
array.clear(cosine_weights) // Clear the array before recalculating weights
for i = 0 to length - 1
weight = math.cos((math.pi * (i + 1)) / length) + 1 // Shift by adding 1
array.push(cosine_weights, weight)
// Normalize the weights
sum_weights = array.sum(cosine_weights)
for i = 0 to length - 1
norm_weight = array.get(cosine_weights, i) / sum_weights
array.set(cosine_weights, i, norm_weight)
// Calculate Cosine-Weighted Moving Average
cwma = 0.0
if bar_index >= length
for i = 0 to length - 1
cwma := cwma + array.get(cosine_weights, i) * close
cwma
Cosine-Weighted ATR Calculation
The ATR is an essential measure of volatility, reflecting the average range of price movement over a specified period. The Cosine-Weighted ATR uses a similar weighting scheme to that of the CWMA, allowing for a more nuanced understanding of volatility. By emphasizing more recent price movements while retaining sensitivity to broader trends, this ATR variant offers traders enhanced insight into potential price fluctuations.
// Function to calculate the Cosine-Weighted ATR with shifted weights
f_Cosine_Weighted_ATR(simple int length) =>
var float cosine_weights_atr = array.new_float(0)
array.clear(cosine_weights_atr)
for i = 0 to length - 1
weight = math.cos((math.pi * (i + 1)) / length) + 1 // Shift by adding 1
array.push(cosine_weights_atr, weight)
// Normalize the weights
sum_weights_atr = array.sum(cosine_weights_atr)
for i = 0 to length - 1
norm_weight_atr = array.get(cosine_weights_atr, i) / sum_weights_atr
array.set(cosine_weights_atr, i, norm_weight_atr)
// Calculate Cosine-Weighted ATR using true ranges
cwatr = 0.0
tr = ta.tr(true) // True Range
if bar_index >= length
for i = 0 to length - 1
cwatr := cwatr + array.get(cosine_weights_atr, i) * tr
cwatr
Signal Generation
The indicator generates long and short signals based on the relationship between the price (user input) and the calculated upper and lower bands, derived from the CWMA and the Cosine-Weighted ATR. Crossover conditions are used to identify potential entry points, providing a systematic approach to trading decisions.
// - - - - - CALCULATIONS - - - - - //{
bar b = bar.new()
float src = b.calc_src(cwma_src)
float cwma = f_Cosine_Weighted_MA(src, ma_length)
// Use normal ATR or Cosine-Weighted ATR based on input
float atr = atr_type == "Normal ATR" ? ta.atr(atr_len) : f_Cosine_Weighted_ATR(atr_len)
// Calculate upper and lower bands using ATR
float cwma_up = cwma + (atr * atr_mult)
float cwma_dn = cwma - (atr * atr_mult)
float src_l = b.calc_src(src_long)
float src_s = b.calc_src(src_short)
// Signal logic for crossovers and crossunders
var int signal = 0
if ta.crossover(src_l, cwma_up)
signal := 1
if ta.crossunder(src_s, cwma_dn)
signal := -1
//}
Backtest Mode and Equity Calculation
To evaluate its effectiveness, the indicator includes a backtest mode, allowing users to test its performance on historical data:
Backtest Equity: A detailed equity curve is calculated based on the generated signals over a user-defined period (startDate to endDate).
Buy and Hold Comparison: Alongside the strategy’s equity, a Buy-and-Hold equity curve is plotted for performance comparison.
Visualization and Alerts
The indicator features customizable plots, allowing users to visualize the CWMA, ATR bands, and signals effectively. The colors change dynamically based on market conditions, with clear distinctions between long and short signals.
Alerts can be configured to notify users of crossover events, providing timely information for potential trading opportunities.

Bollinger Bands Enhanced StrategyOverview
The common practice of using Bollinger bands is to use it for building mean reversion or squeeze momentum strategies. In the current script Bollinger Bands Enhanced Strategy we are trying to combine the strengths of both strategies types. It utilizes Bollinger Bands indicator to buy the local dip and activates trailing profit system after reaching the user given number of Average True Ranges (ATR). Also it uses 200 period EMA to filter trades only in the direction of a trend. Strategy can execute only long trades.
Unique Features
Trailing Profit System: Strategy uses user given number of ATR to activate trailing take profit. If price has already reached the trailing profit activation level, scrip will close long trade if price closes below Bollinger Bands middle line.
Configurable Trading Periods: Users can tailor the strategy to specific market windows, adapting to different market conditions.
Major Trend Filter: Strategy utilizes 100 period EMA to take trades only in the direction of a trend.
Flexible Risk Management: Users can choose number of ATR as a stop loss (by default = 1.75) for trades. This is flexible approach because ATR is recalculated on every candle, therefore stop-loss readjusted to the current volatility.
Methodology
First of all, script checks if currently price is above the 200-period exponential moving average EMA. EMA is used to establish the current trend. Script will take long trades on if this filtering system showing us the uptrend. Then the strategy executes the long trade if candle’s low below the lower Bollinger band. To calculate the middle Bollinger line, we use the standard 20-period simple moving average (SMA), lower band is calculated by the substruction from middle line the standard deviation multiplied by user given value (by default = 2).
When long trade executed, script places stop-loss at the price level below the entry price by user defined number of ATR (by default = 1.75). This stop-loss level recalculates at every candle while trade is open according to the current candle ATR value. Also strategy set the trailing profit activation level at the price above the position average price by user given number of ATR (by default = 2.25). It is also recalculated every candle according to ATR value. When price hit this level script plotted the triangle with the label “Strong Uptrend” and start trail the price at the middle Bollinger line. It also started to be plotted as a green line.
When price close below this trailing level script closes the long trade and search for the next trade opportunity.
Risk Management
The strategy employs a combined and flexible approach to risk management:
It allows positions to ride the trend as long as the price continues to move favorably, aiming to capture significant price movements. It features a user-defined ATR stop loss parameter to mitigate risks based on individual risk tolerance. By default, this stop-loss is set to a 1.75*ATR drop from the entry point, but it can be adjusted according to the trader's preferences.
There is no fixed take profit, but strategy allows user to define user the ATR trailing profit activation parameter. By default, this stop-loss is set to a 2.25*ATR growth from the entry point, but it can be adjusted according to the trader's preferences.
Justification of Methodology
This strategy leverages Bollinger bangs indicator to open long trades in the local dips. If price reached the lower band there is a high probability of bounce. Here is an issue: during the strong downtrend price can constantly goes down without any significant correction. That’s why we decided to use 200-period EMA as a trend filter to increase the probability of opening long trades during major uptrend only.
Usually, Bollinger Bands indicator is using for mean reversion or breakout strategies. Both of them have the disadvantages. The mean reversion buys the dip, but closes on the return to some mean value. Therefore, it usually misses the major trend moves. The breakout strategies usually have the issue with too high buy price because to have the breakout confirmation price shall break some price level. Therefore, in such strategies traders need to set the large stop-loss, which decreases potential reward to risk ratio.
In this strategy we are trying to combine the best features of both types of strategies. Script utilizes ate ATR to setup the stop-loss and trailing profit activation levels. ATR takes into account the current volatility. Therefore, when we setup stop-loss with the user-given number of ATR we increase the probability to decrease the number of false stop outs. The trailing profit concept is trying to add the beat feature from breakout strategies and increase probability to stay in trade while uptrend is developing. When price hit the trailing profit activation level, script started to trail the price with middle line if Bollinger bands indicator. Only when candle closes below the middle line script closes the long trade.
Backtest Results
Operating window: Date range of backtests is 2020.10.01 - 2024.07.01. It is chosen to let the strategy to close all opened positions.
Commission and Slippage: Includes a standard Binance commission of 0.1% and accounts for possible slippage over 5 ticks.
Initial capital: 10000 USDT
Percent of capital used in every trade: 30%
Maximum Single Position Loss: -9.78%
Maximum Single Profit: +25.62%
Net Profit: +6778.11 USDT (+67.78%)
Total Trades: 111 (48.65% win rate)
Profit Factor: 2.065
Maximum Accumulated Loss: 853.56 USDT (-6.60%)
Average Profit per Trade: 61.06 USDT (+1.62%)
Average Trade Duration: 76 hours
These results are obtained with realistic parameters representing trading conditions observed at major exchanges such as Binance and with realistic trading portfolio usage parameters.
How to Use
Add the script to favorites for easy access.
Apply to the desired timeframe and chart (optimal performance observed on 4h BTC/USDT).
Configure settings using the dropdown choice list in the built-in menu.
Set up alerts to automate strategy positions through web hook with the text: {{strategy.order.alert_message}}
Disclaimer:
Educational and informational tool reflecting Skyrex commitment to informed trading. Past performance does not guarantee future results. Test strategies in a simulated environment before live implementation

Big Poppa Code Strat & Momentum Strategy IndicatorThis indicator is a combination of a few things in order to work with a unique trading style gleaned from Callme100k, jrgreatness, TrustMyLevels , FaithInTheStrat, Rob Smith and Saty Mahajan.
This Indicator is created to help you day trade using, ATR Fibonacci Levels, Price Action and Momentum.
It displays Fibonacci Levels Based on ATR to indicate when a security is 0.236, 0.382 +- the Days Open, +- the Days Open, 0.618 +- the Days Open and 1.0 +- Days Open.
To understand this script you need to understand
Average True Range (ATR)
1 Bar Inside Bar
2 Bar Outside Bar (Break either the top or bottom)
3 Bar Engulfing Bar
Strat Setups - 212, 322, 312
Fibonacci - 0.236, 0.382, 0.618, 1.0
Moving Averages
A Trend is considered bullish when (green)
Current Price is greater than the Fast EMA Value (8)
Fast EMA is greater than PIVOT EMA Value (21)
Pivot EMA is greater than SLOW EMA Value (34)
OR Hull is trending up and the Price is above the Volume Weighted Moving Average and price is above VWAP
A trend is considered Bearish when (red)
Current Price is less than the Fast EMA Value (8)
Fast EMA is less than PIVOT EMA Value (21)
Pivot EMA is less than SLOW EMA Value (34)
OR Hull is trending down and the Price is below the Volume Weighted Moving Average and price is below VWAP
If these conditions are not met then the Momentum is in Conflict (orange)
The Momentum band will match the color of the current trend
The table that is present can be turned off at any time lets you see
1) If Moving Averages are showing bullish, bearish or in conflict
2) If There us Time Frame Continuity, (if 5 min up, are all the other timeframes up also)
3) How much of the ATR have we moved on the day
4) Are we in Call or Put range for the day based on ATR Fib Levels
The Ideal situation for entering a call
1) Momentum is Green
2) FTFC on Green
3) A Strat Actionable Signal is present
4) You are in the call range, 0.236 - 0.618 ATR + the Price
5) The ATR still has room, I.e only 50% of the ATR has been run already
Ideal situation from entering a put
1) Momentum is red
2) FTFC on Red
3) A Strat Actionable Signal is present
4) You are in the put range, 0.236 - 0.618 ATR - the Price
5) The ATR still has room, I.e only 50% of the ATR has been run already
Exit the trade for these reasons you entered (for profit or loss)
1) ATR has no more room
2) FTFC is now in conflict
3) Momentum has shifted
Take Profit when
1) You reach a new ATR Level 0.618, 1.0 , -0.618, -1, etc
Passive Stop Loss
1) Open Price if you are aggressive
2) Next ATR Level Down or Up
Feel free to take profit and leave runners
This script does not give signals, you should do your own research, I am not a financial advisors, I am simply applying principles of seasoned veterans to code. You make all decisions about how you buy, sell and trade. The creator of this script makes no promises and takes no responsibility for your personal trading.
To research the methods described above look up
Rob Smith : The Strat
Saty Mahajan : ATR Levels
Fibonacci
Using the HULL Moving Average
Exponential Moving Averages
VWAP
VWMA

Luxy Momentum, Trend, Bias and Breakout Indicators V7
TABLE OF CONTENTS
This is Version 7 (V7) - the latest and most optimized release. If you are using any older versions (V6, V5, V4, V3, etc.), it is highly recommended to replace them with V7.
Why This Indicator is Different
Who Should Use This
Core Components Overview
The UT Bot Trading System
Understanding the Market Bias Table
Candlestick Pattern Recognition
Visual Tools and Features
How to Use the Indicator
Performance and Optimization
FAQ
---
### CREDITS & ATTRIBUTION
This indicator implements proven trading concepts using entirely original code developed specifically for this project.
### CONCEPTUAL FOUNDATIONS
• UT Bot ATR Trailing System
- Original concept by @QuantNomad: (search "UT-Bot-Strategy"
- Our version is a complete reimplementation with significant enhancements:
- Volume-weighted momentum adjustment
- Composite stop loss from multiple S/R layers
- Multi-filter confirmation system (swing, %, 2-bar, ZLSMA)
- Full integration with multi-timeframe bias table
- Visual audit trail with freeze-on-touch
- NOTE: No code was copied - this is a complete reimplementation with enhancements.
• Standard Technical Indicators (Public Domain Formulas):
- Supertrend: ATR-based trend calculation with custom gradient fills
- MACD: Gerald Appel's formula with separation filters
- RSI: J. Welles Wilder's formula with pullback zone logic
- ADX/DMI: Custom trend strength formula inspired by Wilder's directional movement concept, reimplemented with volume weighting and efficiency metrics
- ZLSMA: Zero-lag formula enhanced with Hull MA and momentum prediction
### Custom Implementations
- Trend Strength: Inspired by Wilder's ADX concept but using volume-weighted pressure calculation and efficiency metrics (not traditional +DI/-DI smoothing)
- All code implementations are original
### ORIGINAL FEATURES (70%+ of codebase)
- Multi-Timeframe Bias Table with live updates
- Risk Management System (R-multiple TPs, freeze-on-touch)
- Opening Range Breakout tracker with session management
- Composite Stop Loss calculator using 6+ S/R layers
- Performance optimization system (caching, conditional calcs)
- VIX Fear Index integration
- Previous Day High/Low auto-detection
- Candlestick pattern recognition with interactive tooltips
- Smart label and visual management
- All UI/UX design and table architecture
### DEVELOPMENT PROCESS
**AI Assistance:** This indicator was developed over 2+ months with AI assistance (ChatGPT/Claude) used for:
- Writing Pine Script code based on design specifications
- Optimizing performance and fixing bugs
- Ensuring Pine Script v6 compliance
- Generating documentation
**Author's Role:** All trading concepts, system design, feature selection, integration logic, and strategic decisions are original work by the author. The AI was a coding tool, not the system designer.
**Transparency:** We believe in full disclosure - this project demonstrates how AI can be used as a powerful development tool while maintaining creative and strategic ownership.
---
1. WHY THIS INDICATOR IS DIFFERENT
Most traders use multiple separate indicators on their charts, leading to cluttered screens, conflicting signals, and analysis paralysis. The Suite solves this by integrating proven technical tools into a single, cohesive system.
Key Advantages:
All-in-One Design: Instead of loading 5-10 separate indicators, you get everything in one optimized script. This reduces chart clutter and improves TradingView performance.
Multi-Timeframe Bias Table: Unlike standard indicators that only show the current timeframe, the Bias Table aggregates trend signals across multiple timeframes simultaneously. See at a glance whether 1m, 5m, 15m, 1h are aligned bullish or bearish - no more switching between charts.
Smart Confirmations: The indicator doesn't just give signals - it shows you WHY. Every entry has multiple layers of confirmation (MA cross, MACD momentum, ADX strength, RSI pullback, volume, etc.) that you can toggle on/off.
Dynamic Stop Loss System: Instead of static ATR stops, the SL is calculated from multiple support/resistance layers: UT trailing line, Supertrend, VWAP, swing structure, and MA levels. This creates more intelligent, price-action-aware stops.
R-Multiple Take Profits: Built-in TP system calculates targets based on your initial risk (1R, 1.5R, 2R, 3R). Lines freeze when touched with visual checkmarks, giving you a clean audit trail of partial exits.
Educational Tooltips Everywhere: Every single input has detailed tooltips explaining what it does, typical values, and how it impacts trading. You're not guessing - you're learning as you configure.
Performance Optimized: Smart caching, conditional calculations, and modular design mean the indicator runs fast despite having 15+ features. Turn off what you don't use for even better performance.
No Repainting: All signals respect bar close. Alerts fire correctly. What you see in history is what you would have gotten in real-time.
What Makes It Unique:
Integrated UT Bot + Bias Table: No other indicator combines UT Bot's ATR trailing system with a live multi-timeframe dashboard. You get precision entries with macro trend context.
Candlestick Pattern Recognition with Interactive Tooltips: Patterns aren't just marked - hover over any emoji for a full explanation of what the pattern means and how to trade it.
Opening Range Breakout Tracker: Built-in ORB system for intraday traders with customizable session times and real-time status updates in the Bias Table.
Previous Day High/Low Auto-Detection: Automatically plots PDH/PDL on intraday charts with theme-aware colors. Updates daily without manual input.
Dynamic Row Labels in Bias Table: The table shows your actual settings (e.g., "EMA 10 > SMA 20") not generic labels. You know exactly what's being evaluated.
Modular Filter System: Instead of forcing a fixed methodology, the indicator lets you build your own strategy. Start with just UT Bot, add filters one at a time, test what works for your style.
---
2. WHO WHOULD USE THIS
Designed For:
Intermediate to Advanced Traders: You understand basic technical analysis (MAs, RSI, MACD) and want to combine multiple confirmations efficiently. This isn't a "one-click profit" system - it's a professional toolkit.
Multi-Timeframe Traders: If you trade one asset but check multiple timeframes for confirmation (e.g., enter on 5m after checking 15m and 1h alignment), the Bias Table will save you hours every week.
Trend Followers: The indicator excels at identifying and following trends using UT Bot, Supertrend, and MA systems. If you trade breakouts and pullbacks in trending markets, this is built for you.
Intraday and Swing Traders: Works equally well on 5m-1h charts (day trading) and 4h-D charts (swing trading). Scalpers can use it too with appropriate settings adjustments.
Discretionary Traders: This isn't a black-box system. You see all the components, understand the logic, and make final decisions. Perfect for traders who want tools, not automation.
Works Across All Markets:
Stocks (US, international)
Cryptocurrency (24/7 markets supported)
Forex pairs
Indices (SPY, QQQ, etc.)
Commodities
NOT Ideal For :
Complete Beginners: If you don't know what a moving average or RSI is, start with basics first. This indicator assumes foundational knowledge.
Algo Traders Seeking Black Box: This is discretionary. Signals require context and confirmation. Not suitable for blind automated execution.
Mean-Reversion Only Traders: The indicator is trend-following at its core. While VWAP bands support mean-reversion, the primary methodology is trend continuation.
---
3. CORE COMPONENTS OVERVIEW
The indicator combines these proven systems:
Trend Analysis:
Moving Averages: Four customizable MAs (Fast, Medium, Medium-Long, Long) with six types to choose from (EMA, SMA, WMA, VWMA, RMA, HMA). Mix and match for your style.
Supertrend: ATR-based trend indicator with unique gradient fill showing trend strength. One-sided ribbon visualization makes it easier to see momentum building or fading.
ZLSMA : Zero-lag linear-regression smoothed moving average. Reduces lag compared to traditional MAs while maintaining smooth curves.
Momentum & Filters:
MACD: Standard MACD with separation filter to avoid weak crossovers.
RSI: Pullback zone detection - only enter longs when RSI is in your defined "buy zone" and shorts in "sell zone".
ADX/DMI: Trend strength measurement with directional filter. Ensures you only trade when there's actual momentum.
Volume Filter: Relative volume confirmation - require above-average volume for entries.
Donchian Breakout: Optional channel breakout requirement.
Signal Systems:
UT Bot: The primary signal generator. ATR trailing stop that adapts to volatility and gives clear entry/exit points.
Base Signals: MA cross system with all the above filters applied. More conservative than UT Bot alone.
Market Bias Table: Multi-timeframe dashboard showing trend alignment across 7 timeframes plus macro bias (3-day, weekly, monthly, quarterly, VIX).
Candlestick Patterns: Six major reversal patterns auto-detected with interactive tooltips.
ORB Tracker: Opening range high/low with breakout status (intraday only).
PDH/PDL: Previous day levels plotted automatically on intraday charts.
VWAP + Bands : Session-anchored VWAP with up to three standard deviation band pairs.
---
4. THE UT BOT TRADING SYSTEM
The UT Bot is the heart of the indicator's signal generation. It's an advanced ATR trailing stop that adapts to market volatility.
Why UT Bot is Superior to Fixed Stops:
Traditional ATR stops use a fixed multiplier (e.g., "stop = entry - 2×ATR"). UT Bot is smarter:
It TRAILS the stop as price moves in your favor
It WIDENS during high volatility to avoid premature stops
It TIGHTENS during consolidation to lock in profits
It FLIPS when price breaks the trailing line, signaling reversals
Visual Elements You'll See:
Orange Trailing Line: The actual UT stop level that adapts bar-by-bar
Buy/Sell Labels: Aqua triangle (long) or orange triangle (short) when the line flips
ENTRY Line: Horizontal line at your entry price (optional, can be turned off)
Suggested Stop Loss: A composite SL calculated from multiple support/resistance layers:
- UT trailing line
- Supertrend level
- VWAP
- Swing structure (recent lows/highs)
- Long-term MA (200)
- ATR-based floor
Take Profit Lines: TP1, TP1.5, TP2, TP3 based on R-multiples. When price touches a TP, it's marked with a checkmark and the line freezes for audit trail purposes.
Status Messages: "SL Touched ❌" or "SL Frozen" when the trade leg completes.
How UT Bot Differs from Other ATR Systems:
Multiple Filters Available: You can require 2-bar confirmation, minimum % price change, swing structure alignment, or ZLSMA directional filter. Most UT implementations have none of these.
Smart SL Calculation: Instead of just using the UT line as your stop, the indicator suggests a better SL based on actual support/resistance. This prevents getting stopped out by wicks while keeping risk controlled.
Visual Audit Trail: All SL/TP lines freeze when touched with clear markers. You can review your trades weeks later and see exactly where entries, stops, and targets were.
Performance Options: "Draw UT visuals only on bar close" lets you reduce rendering load without affecting logic or alerts - critical for slower machines or 1m charts.
Trading Logic:
UT Bot flips direction (Buy or Sell signal appears)
Check Bias Table for multi-timeframe confirmation
Optional: Wait for Base signal or candlestick pattern
Enter at signal bar close or next bar open
Place stop at "Suggested Stop Loss" line
Scale out at TP levels (TP1, TP2, TP3)
Exit remaining position on opposite UT signal or stop hit
---
5. UNDERSTANDING THE MARKET BIAS TABLE
This is the indicator's unique multi-timeframe intelligence layer. Instead of looking at one chart at a time, the table aggregates signals across seven timeframes plus macro trend bias.
Why Multi-Timeframe Analysis Matters:
Professional traders check higher and lower timeframes for context:
Is the 1h uptrend aligning with my 5m entry?
Are all short-term timeframes bullish or just one?
Is the daily trend supportive or fighting me?
Doing this manually means opening multiple charts, checking each indicator, and making mental notes. The Bias Table does it automatically in one glance.
Table Structure:
Header Row:
On intraday charts: 1m, 5m, 15m, 30m, 1h, 2h, 4h (toggle which ones you want)
On daily+ charts: D, W, M (automatic)
Green dot next to title = live updating
Headline Rows - Macro Bias:
These show broad market direction over longer periods:
3 Day Bias: Trend over last 3 trading sessions (uses 1h data)
Weekly Bias: Trend over last 5 trading sessions (uses 4h data)
Monthly Bias: Trend over last 30 daily bars
Quarterly Bias: Trend over last 13 weekly bars
VIX Fear Index: Market regime based on VIX level - bullish when low, bearish when high
Opening Range Breakout: Status of price vs. session open range (intraday only)
These rows show text: "BULLISH", "BEARISH", or "NEUTRAL"
Indicator Rows - Technical Signals:
These evaluate your configured indicators across all active timeframes:
Fast MA > Medium MA (shows your actual MA settings, e.g., "EMA 10 > SMA 20")
Price > Long MA (e.g., "Price > SMA 200")
Price > VWAP
MACD > Signal
Supertrend (up/down/neutral)
ZLSMA Rising
RSI In Zone
ADX ≥ Minimum
These rows show emojis: GREEB (bullish), RED (bearish), GRAY/YELLOW (neutral/NA)
AVG Column:
Shows percentage of active timeframes that are bullish for that row. This is the KEY metric:
AVG > 70% = strong multi-timeframe bullish alignment
AVG 40-60% = mixed/choppy, no clear trend
AVG < 30% = strong multi-timeframe bearish alignment
How to Use the Table:
For a long trade:
Check AVG column - want to see > 60% ideally
Check headline bias rows - want to see BULLISH, not BEARISH
Check VIX row - bullish market regime preferred
Check ORB row (intraday) - want ABOVE for longs
Scan indicator rows - more green = better confirmation
For a short trade:
Check AVG column - want to see < 40% ideally
Check headline bias rows - want to see BEARISH, not BULLISH
Check VIX row - bearish market regime preferred
Check ORB row (intraday) - want BELOW for shorts
Scan indicator rows - more red = better confirmation
When AVG is 40-60%:
Market is choppy, mixed signals. Either stay out or reduce position size significantly. These are low-probability environments.
Unique Features:
Dynamic Labels: Row names show your actual settings (e.g., "EMA 10 > SMA 20" not generic "Fast > Slow"). You know exactly what's being evaluated.
Customizable Rows: Turn off rows you don't care about. Only show what matters to your strategy.
Customizable Timeframes: On intraday charts, disable 1m or 4h if you don't trade them. Reduces calculation load by 20-40%.
Automatic HTF Handling: On Daily/Weekly/Monthly charts, the table automatically switches to D/W/M columns. No configuration needed.
Performance Smart: "Hide BIAS table on 1D or above" option completely skips all table calculations on higher timeframes if you only trade intraday.
---
6. CANDLESTICK PATTERN RECOGNITION
The indicator automatically detects six major reversal patterns and marks them with emojis at the relevant bars.
Why These Six Patterns:
These are the most statistically significant reversal patterns according to trading literature:
High win rate when appearing at support/resistance
Clear visual structure (not subjective)
Work across all timeframes and assets
Studied extensively by institutions
The Patterns:
Bullish Patterns (appear at bottoms):
Bullish Engulfing: Green candle completely engulfs prior red candle's body. Strong reversal signal.
Hammer: Small body with long lower wick (at least 2× body size). Shows rejection of lower prices by buyers.
Morning Star: Three-candle pattern (large red → small indecision → large green). Very strong bottom reversal.
Bearish Patterns (appear at tops):
Bearish Engulfing: Red candle completely engulfs prior green candle's body. Strong reversal signal.
Shooting Star: Small body with long upper wick (at least 2× body size). Shows rejection of higher prices by sellers.
Evening Star: Three-candle pattern (large green → small indecision → large red). Very strong top reversal.
Interactive Tooltips:
Unlike most pattern indicators that just draw shapes, this one is educational:
Hover your mouse over any pattern emoji
A tooltip appears explaining: what the pattern is, what it means, when it's most reliable, and how to trade it
No need to memorize - learn as you trade
Noise Filter:
"Min candle body % to filter noise" setting prevents false signals:
Patterns require minimum body size relative to price
Filters out tiny candles that don't represent real buying/selling pressure
Adjust based on asset volatility (higher % for crypto, lower for low-volatility stocks)
How to Trade Patterns:
Patterns are NOT standalone entry signals. Use them as:
Confirmation: UT Bot gives signal + pattern appears = stronger entry
Reversal Warning: In a trade, opposite pattern appears = consider tightening stop or taking profit
Support/Resistance Validation: Pattern at key level (PDH, VWAP, MA 200) = level is being respected
Best combined with:
UT Bot or Base signal in same direction
Bias Table alignment (AVG > 60% or < 40%)
Appearance at obvious support/resistance
---
7. VISUAL TOOLS AND FEATURES
VWAP (Volume Weighted Average Price):
Session-anchored VWAP with standard deviation bands. Shows institutional "fair value" for the trading session.
Anchor Options: Session, Day, Week, Month, Quarter, Year. Choose based on your trading timeframe.
Bands: Up to three pairs (X1, X2, X3) showing statistical deviation. Price at outer bands often reverses.
Auto-Hide on HTF: VWAP hides on Daily/Weekly/Monthly charts automatically unless you enable anchored mode.
Use VWAP as:
Directional bias (above = bullish, below = bearish)
Mean reversion levels (outer bands)
Support/resistance (the VWAP line itself)
Previous Day High/Low:
Automatically plots yesterday's high and low on intraday charts:
Updates at start of each new trading day
Theme-aware colors (dark text for light charts, light text for dark charts)
Hidden automatically on Daily/Weekly/Monthly charts
These levels are critical for intraday traders - institutions watch them closely as support/resistance.
Opening Range Breakout (ORB):
Tracks the high/low of the first 5, 15, 30, or 60 minutes of the trading session:
Customizable session times (preset for NYSE, LSE, TSE, or custom)
Shows current breakout status in Bias Table row (ABOVE, BELOW, INSIDE, BUILDING)
Intraday only - auto-disabled on Daily+ charts
ORB is a classic day trading strategy - breakout above opening range often leads to continuation.
Extra Labels:
Change from Open %: Shows how far price has moved from session open (intraday) or daily open (HTF). Green if positive, red if negative.
ADX Badge: Small label at bottom of last bar showing current ADX value. Green when above your minimum threshold, red when below.
RSI Badge: Small label at top of last bar showing current RSI value with zone status (buy zone, sell zone, or neutral).
These labels provide quick at-a-glance confirmation without needing separate indicator windows.
---
8. HOW TO USE THE INDICATOR
Step 1: Add to Chart
Load the indicator on your chosen asset and timeframe
First time: Everything is enabled by default - the chart will look busy
Don't panic - you'll turn off what you don't need
Step 2: Start Simple
Turn OFF everything except:
UT Bot labels (keep these ON)
Bias Table (keep this ON)
Moving Averages (Fast and Medium only)
Suggested Stop Loss and Take Profits
Hide everything else initially. Get comfortable with the basic UT Bot + Bias Table workflow first.
Step 3: Learn the Core Workflow
UT Bot gives a Buy or Sell signal
Check Bias Table AVG column - do you have multi-timeframe alignment?
If yes, enter the trade
Place stop at Suggested Stop Loss line
Scale out at TP levels
Exit on opposite UT signal
Trade this simple system for a week. Get a feel for signal frequency and win rate with your settings.
Step 4: Add Filters Gradually
If you're getting too many losing signals (whipsaws in choppy markets), add filters one at a time:
Try: "Require 2-Bar Trend Confirmation" - wait for 2 bars to confirm direction
Try: ADX filter with minimum threshold - only trade when trend strength is sufficient
Try: RSI pullback filter - only enter on pullbacks, not chasing
Try: Volume filter - require above-average volume
Add one filter, test for a week, evaluate. Repeat.
Step 5: Enable Advanced Features (Optional)
Once you're profitable with the core system, add:
Supertrend for additional trend confirmation
Candlestick patterns for reversal warnings
VWAP for institutional anchor reference
ORB for intraday breakout context
ZLSMA for low-lag trend following
Step 6: Optimize Settings
Every setting has a detailed tooltip explaining what it does and typical values. Hover over any input to read:
What the parameter controls
How it impacts trading
Suggested ranges for scalping, day trading, and swing trading
Start with defaults, then adjust based on your results and style.
Step 7: Set Up Alerts
Right-click chart → Add Alert → Condition: "Luxy Momentum v6" → Choose:
"UT Bot — Buy" for long entries
"UT Bot — Sell" for short entries
"Base Long/Short" for filtered MA cross signals
Optionally enable "Send real-time alert() on UT flip" in settings for immediate notifications.
Common Workflow Variations:
Conservative Trader:
UT signal + Base signal + Candlestick pattern + Bias AVG > 70%
Enter only at major support/resistance
Wider UT sensitivity, multiple filters
Aggressive Trader:
UT signal + Bias AVG > 60%
Enter immediately, no waiting
Tighter UT sensitivity, minimal filters
Swing Trader:
Focus on Daily/Weekly Bias alignment
Ignore intraday noise
Use ORB and PDH/PDL less (or not at all)
Wider stops, patient approach
---
9. PERFORMANCE AND OPTIMIZATION
The indicator is optimized for speed, but with 15+ features running simultaneously, chart load time can add up. Here's how to keep it fast:
Biggest Performance Gains:
Disable Unused Timeframes: In "Time Frames" settings, turn OFF any timeframe you don't actively trade. Each disabled TF saves 10-15% calculation time. If you only day trade 5m, 15m, 1h, disable 1m, 2h, 4h.
Hide Bias Table on Daily+: If you only trade intraday, enable "Hide BIAS table on 1D or above". This skips ALL table calculations on higher timeframes.
Draw UT Visuals Only on Bar Close: Reduces intrabar rendering of SL/TP/Entry lines. Has ZERO impact on logic or alerts - purely visual optimization.
Additional Optimizations:
Turn off VWAP bands if you don't use them
Disable candlestick patterns if you don't trade them
Turn off Supertrend fill if you find it distracting (keep the line)
Reduce "Limit to 10 bars" for SL/TP lines to minimize line objects
Performance Features Built-In:
Smart Caching: Higher timeframe data (3-day bias, weekly bias, etc.) updates once per day, not every bar
Conditional Calculations: Volume filter only calculates when enabled. Swing filter only runs when enabled. Nothing computes if turned off.
Modular Design: Every component is independent. Turn off what you don't need without breaking other features.
Typical Load Times:
5m chart, all features ON, 7 timeframes: ~2-3 seconds
5m chart, core features only, 3 timeframes: ~1 second
1m chart, all features: ~4-5 seconds (many bars to calculate)
If loading takes longer, you likely have too many indicators on the chart total (not just this one).
---
10. FAQ
Q: How is this different from standard UT Bot indicators?
A: Standard UT Bot (originally by @QuantNomad) is just the ATR trailing line and flip signals. This implementation adds:
- Volume weighting and momentum adjustment to the trailing calculation
- Multiple confirmation filters (swing, %, 2-bar, ZLSMA)
- Smart composite stop loss system from multiple S/R layers
- R-multiple take profit system with freeze-on-touch
- Integration with multi-timeframe Bias Table
- Visual audit trail with checkmarks
Q: Can I use this for automated trading?
A: The indicator is designed for discretionary trading. While it has clear signals and alerts, it's not a mechanical system. Context and judgment are required.
Q: Does it repaint?
A: No. All signals respect bar close. UT Bot logic runs intrabar but signals only trigger on confirmed bars. Alerts fire correctly with no lookahead.
Q: Do I need to use all the features?
A: Absolutely not. The indicator is modular. Many profitable traders use just UT Bot + Bias Table + Moving Averages. Start simple, add complexity only if needed.
Q: How do I know which settings to use?
A: Every single input has a detailed tooltip. Hover over any setting to see:
What it does
How it affects trading
Typical values for scalping, day trading, swing trading
Start with defaults, adjust gradually based on results.
Q: Can I use this on crypto 24/7 markets?
A: Yes. ORB will not work (no defined session), but everything else functions normally. Use "Day" anchor for VWAP instead of "Session".
Q: The Bias Table is blank or not showing.
A: Check:
"Show Table" is ON
Table position isn't overlapping another indicator's table (change position)
At least one row is enabled
"Hide BIAS table on 1D or above" is OFF (if on Daily+ chart)
Q: Why are candlestick patterns not appearing?
A: Patterns are relatively rare by design - they only appear at genuine reversal points. Check:
Pattern toggles are ON
"Min candle body %" isn't too high (try 0.05-0.10)
You're looking at a chart with actual reversals (not strong trending market)
Q: UT Bot is too sensitive/not sensitive enough.
A: Adjust "Sensitivity (Key×ATR)". Lower number = tighter stop, more signals. Higher number = wider stop, fewer signals. Read the tooltip for guidance.
Q: Can I get alerts for the Bias Table?
A: The Bias Table is a dashboard for visual analysis, not a signal generator. Set alerts on UT Bot or Base signals, then manually check Bias Table for confirmation.
Q: Does this work on stocks with low volume?
A: Yes, but turn OFF the volume filter. Low volume stocks will never meet relative volume requirements.
Q: How often should I check the Bias Table?
A: Before every entry. It takes 2 seconds to glance at the AVG column and headline rows. This one check can save you from fighting the trend.
Q: What if UT signal and Base signal disagree?
A: UT Bot is more aggressive (ATR trailing). Base signals are more conservative (MA cross + filters). If they disagree, either:
Wait for both to align (safest)
Take the UT signal but with smaller size (aggressive)
Skip the trade (conservative)
There's no "right" answer - depends on your risk tolerance.
---
FINAL NOTES
The indicator gives you an edge. How you use that edge determines results.
For questions, feedback, or support, comment on the indicator page or message the author.
Happy Trading!

Rolling Midpoint of Price & VWAP with ATR BandsThe Rolling Midpoint of Price & VWAP with ATR Bands indicator is a dual-equilibrium concept that fuses price-range structure and traded-volume flow into one continuously updating hybrid model. Traditional VWAPs reset each session and reflect where trading occurred by volume, while midpoints used here reveal where price has structurally balanced between extremes. This script merges both ideas into a cohesive, dynamic system. The Rolling Price Midpoint (50 % of range) represents the structural fair-value line, calculated as the average of the highest high and lowest low over a selected window. The Rolling VWAP (Volume-Weighted Window) tracks the flow-based fair-value line by weighting each bar’s typical price by its volume. Together, these components form the Hybrid Equilibrium — the adaptive center of gravity that shifts as price and volume evolve. Surrounding this equilibrium, ATR Bands at ± 2.226 ATR and ± 5.382 ATR define volatility envelopes that expand and contract with market energy. The result is a living cloud that breathes with the market: compressing during phases of balance and widening during impulsive movements, offering traders a clear visual framework for understanding equilibrium, volatility, and directional bias in real time.
➖
⚙️ Auto-Preset System
The Auto-Preset System intelligently adjusts lookback windows for both the Price Midpoint and VWAP calculations according to the active chart timeframe.
This ensures that the indicator automatically adapts to any trading style — from scalping on 1-minute charts to swing trading on daily or weekly charts — without manual tuning.
🔹 How It Works
When Auto-Preset mode is enabled, the script dynamically selects the most effective lookback lengths for each timeframe.
These presets are optimized to balance responsiveness and stability, maintaining consistent real-world coverage (e.g., the same approximate duration of price data) across all intervals.
📊 Preset Mapping Table
| Chart Timeframe | Price Midpoint Lookback | VWAP Lookback |
|:----------------:|:-----------------------:|:--------------:|
| 1–3m | 13 bars | 21 bars
| 5–10m | 21 bars | 34 bars
| 15–30m | 34 bars | 55 bars
| 1–2 hr | 55 bars | 89 bars
| 4 hr-1D | 89 bars | 144 bars
| 1W | 144 bars | 233 bars
| 1M | 233 bars | 377 bars
⚡ Notes & Customization
- Manual Override: Turn off Auto-Preset Mode to specify your own custom lookback lengths.
- Consistency Across Scales: These adaptive values keep the indicator visually coherent when switching between timeframes — avoiding distortions that can occur with static lengths.
- Practical Benefit: Traders can maintain a single chart layout that self-tunes seamlessly, removing the need to manually recalibrate settings when shifting from short-term to long-term analysis.
In short, the Auto-Preset System is designed to make this hybrid equilibrium tool timeframe-aware — automatically scaling its logic so that the cloud behaves consistently, regardless of chart resolution.
➖
🌐 Hybrid Equilibrium Envelope
The core hybrid midpoint acts as the mean of structural (price) and volumetric (VWAP) balance.
ATR-based bands project natural expansion zones:
🔸+2.226 / –2.226 ATR → inner equilibrium (controlled trend)
*🔸+5.382 / –5.382 ATR → outer volatility extension (over-stretch / reversion zones)
Color-coded fills show regime strength:
* 🟧 Upper Outer (+5.382) – strong bullish expansion
* 🟩 Upper Inner (+2.226) – trending equilibrium
* 🔴 Lower Inner (–2.226) – mild bearish control
* 🟣 Lower Outer (–5.382) – volatility exhaustion
➖
🧭 Higher-Timeframe Framework
Two macro anchors — Price length of 144 and VWAP length of 233 — outline higher-timeframe bias zones. These help confirm when local momentum aligns with (or fades against) long-term structure.
Labels on the right show active lookback values for quick readout:
`$(13) V(21)` → current rolling pair
`$144 / V233` → macro anchors
➖
🧩 Chart Examples
**AMD 15m (Equilibrium Expansion)**
Price steadily rides above the hybrid midpoint as teal and orange (bullish) ATR zones widen, confirming a phase of controlled bullish volatility and healthy trend expansion.
BTCUSD 1m (Volatility Compression)
Bitcoin coils tightly inside the teal-to-maroon equilibrium bands before breaking out.
The hybrid midpoint flattens and ATR envelopes contract, signaling a state of balance before volatility expansion.
ETHUSD 15m (Transition from Compression → Impulse)
Ethereum transitions from purple-zone compression into a clear upper-band expansion.
The hybrid midpoint breaks above the macro VWAP 233, confirming the shift from equilibrium to directional momentum.
SOFI 1m (Micro Bias Reversal)
SOFI’s intraday structure flips as price reclaims the hybrid midpoint.
The macro VWAP 233 flattens, signaling a transition from oversold lower bands back toward equilibrium and early trend recovery.
➖
🎯 How to Use
1. Bias Detection – Price > Hybrid Midpoint → bullish; < → bearish.
2. Volatility Gauge – Watch band spacing for compression / expansion cycles.
3. Confluence Checks – Align Hybrid Midpoint with HTF 233 VWAP for strong continuation signals.
4. Mean Reversion Zones – Outer bands highlight areas where probability of snap-back increases.
➖
🔧 Inputs & Customization
Auto Presets toggle
🔸Manual Lookback Overrides** for fine-tuning
🔸Plot Window Length** (show recent vs full history)
🔸ATR Sensitivity & Fill Opacity** controls
🔸Label Padding / Font Size** for cleaner overlay visuals
➖
🧮 Formula Highlights
➖Rolling Midpoint = (highest(high,N) + lowest(low,N)) / 2
➖Rolling VWAP = Σ(Typical Price×Vol) / Σ(Vol)
➖Hybrid = (PriceMid + VWAP) / 2
➖Upper₂ = Hybrid + ATR×2.226
➖Lower₂ = Hybrid − ATR×2.226
➖Upper₅ = Hybrid + ATR×5.382
➖Lower₅ = Hybrid − ATR×5.382
➖
🎯 Ideal For
➡️ Traders who want adaptive fair-value zones that evolve with both price and volume.
➡️ Analysts who shift between scalping, swing, and position timeframes, and need a tool that self-adjusts.
➡️ Those who rely on visual structure clarity to confirm setups across changing volatility conditions.
➡️ Anyone seeking a hybrid model that unites structural range logic (midpoint) and flow-based balance (VWAP).
➖
🏁 Final Word
This script is more than a visual overlay — it’s a complete trend and structure framework built to adapt with market rhythm. It helps traders visualize equilibrium, momentum, and volatility as one cohesive system. Whether you’re seeking clean trend alignment, dynamic support/resistance, or early warning signs of reversals, this indicator is tuned to help you react with confidence — not hindsight.
➖
Remember — no single indicator should ever stand alone. For best results, pair it with price action context, higher-timeframe structure, and complementary tools such as moving averages or trendlines. Use it to confirm setups, not define them in isolation.
💡 Turn logic into clarity, structure into trades, and uncertainty into confidence.
