Volume-Supported Linear Regression Trend TableThe "Volume-Supported Linear Regression Trend Table" (VSLRT Table) script helps traders identify buy and sell opportunities by analyzing price trends and volume dynamics across multiple timeframes. It uses linear regression to calculate the trend direction and volume strength, visually representing this data with color-coded signals on the chart and in a table. Green signals indicate buying opportunities, while red signals suggest selling, with volume acting as confirmation of trend strength. Traders can use these signals for both short and long positions, with additional risk management and multi-timeframe validation to enhance the strategy.
------------------------------------------------------------------------------
To use the "Volume-Supported Linear Regression Trend Table" (VSLRT Table) script in a trading strategy, you would incorporate it into your decision-making process to identify potential buy and sell opportunities based on the trend and volume dynamics. Here’s how you could apply it for trading:
1. Understanding the Key Elements:
Trend Direction (Slope of Price): The script uses linear regression to assess the trend direction of the price. If the price slope is positive, the asset is likely in an uptrend; if it's negative, the asset is in a downtrend.
Volume-Backed Signals: The buy or sell signal is not only based on the price trend but also on volume. Volume is crucial in validating the strength of a trend; large volume often indicates strong interest in a direction.
2. Interpreting the Table and Signals:
The table displayed at the bottom-right of your TradingView chart gives you a clear overview of the trends across different timeframes:
Trend Colors:
Green hues (e.g., ccol11, ccol12, etc.): Indicate a buying trend supported by volume.
Red hues (e.g., ccol21, ccol22, etc.): Indicate a selling trend supported by volume.
Gray: Indicates weak or unclear trends where no decisive direction is present.
Buy/Sell Signals:
The script plots triangles on the chart:
Upward triangle below the bar signals a potential buy.
Downward triangle above the bar signals a potential sell.
3. Building a Trading Strategy:
Here’s how you can incorporate the script’s information into a trading strategy:
Buy Signal (Long Entry):
Look for green triangles (indicating a buy signal) below a bar.
Confirm that the trend color in the table for the relevant timeframe is green, which shows that the buy signal is supported by strong volume.
Ensure that the price is in an uptrend (positive slope) and that volume is increasing on upward moves, as this indicates buying interest.
Execute a long position when these conditions align.
Sell Signal (Short Entry):
Look for red triangles (indicating a sell signal) above a bar.
Confirm that the trend color in the table for the relevant timeframe is red, which shows that the sell signal is supported by strong volume.
Ensure that the price is in a downtrend (negative slope) and that volume is increasing on downward moves, indicating selling pressure.
Execute a short position when these conditions align.
Exiting the Trade:
Exit a long position when a sell signal (red triangle) appears, or when the trend color in the table shifts to red.
Exit a short position when a buy signal (green triangle) appears, or when the trend color in the table shifts to green.
4. Multi-Timeframe Confirmation:
The script provides trends across multiple timeframes (tf1, tf2, tf3), which can help in validating your trade:
Short-Term Trading: Use shorter timeframes (e.g., 3, 5 minutes) for intraday trades. If both short and medium timeframes align in trend direction (e.g., both showing green), it strengthens the signal.
Longer-Term Trading: If you are trading on a higher timeframe (e.g., daily or weekly), confirm that the lower timeframes align with your intended trade direction.
5. Adding Risk Management:
Stop-Loss: Place stop-losses below recent lows (for long trades) or above recent highs (for short trades) to minimize risk.
Take Profit: Consider taking profit at key support/resistance levels or based on a fixed risk-to-reward ratio (e.g., 2:1).
Example Strategy Flow:
For Long (Buy) Trade:
Signal: A green triangle appears below a candle (Buy signal).
Trend Confirmation: Check that the color in the table for your selected timeframe is green, confirming the trend is supported by volume.
Execute Long: Enter a long trade if the price is trending upward (positive price slope).
Exit Long: Exit when a red triangle appears above a candle (Sell signal) or if the trend color shifts to red in the table.
For Short (Sell) Trade:
Signal: A red triangle appears above a candle (Sell signal).
Trend Confirmation: Check that the color in the table for your selected timeframe is red, confirming the trend is supported by volume.
Execute Short: Enter a short trade if the price is trending downward (negative price slope).
Exit Short: Exit when a green triangle appears below a candle (Buy signal) or if the trend color shifts to green in the table.
6. Fine-Tuning:
Backtesting: Before trading live, use TradingView’s backtesting features to test the strategy on historical data and optimize the settings (e.g., length of linear regression, timeframe).
Combine with Other Indicators: Use this strategy alongside other technical indicators (e.g., RSI, MACD) for better confirmation.
In summary, the script helps identify trends with volume support, giving more confidence in buy/sell decisions. Combining these signals with risk management and multi-timeframe analysis can create a solid trading strategy.
Recherche dans les scripts pour "backtest"

Two Pole Butterworth For Loop [BackQuant]Two Pole Butterworth For Loop
PLEASE read the following carefully, as understanding the underlying concepts and logic behind the indicator is key to incorporating it into your trading system in a sound and methodical manner.
Introducing BackQuant's Two Pole Butterworth For Loop (2P BW FL) — an advanced indicator that fuses the power of the Two Pole Butterworth filter with a dynamic for-loop scoring mechanism. This unique approach is designed to extract actionable trading signals by smoothing out price data and then analyzing it using a comparative scoring method. Let's delve into how this indicator works, why it was created, and how it can be used in various trading scenarios.
Understanding the Two Pole Butterworth Filter
The Butterworth filter is a signal processing tool known for its smooth response and minimal distortion. It's often used in electronic and communication systems to filter out unwanted noise. In trading, the Butterworth filter can be applied to price data to smooth out the volatility, providing traders with a clearer view of underlying trends without the whipsaws often associated with market noise.
The Two Pole Butterworth variant further enhances this effect by applying the filter with two poles, effectively creating a sharper transition between the passband and stopband. In simple terms, this allows the filter to follow the price action more closely, reacting to changes while maintaining smoothness.
In this script, the Two Pole Butterworth filter is applied to the Calculation Source (default is set to the closing price), creating a smoothed price series that serves as the foundation for further analysis.
Why Use a Two Pole Butterworth Filter?
The Two Pole Butterworth filter is chosen for its ability to reduce lag while maintaining a smooth output. This makes it an ideal choice for traders who want to capture trends without being misled by short-term volatility or market noise. By filtering the price data, the Two Pole Butterworth enables traders to focus on the broader market movements and avoid false signals.
The For-Loop Scoring Mechanism
In addition to the Butterworth filter, this script uses a for-loop scoring system to evaluate the smoothed price data. The for-loop compares the current value of the filtered price (referred to as "subject") to previous values over a defined range (set by the start and end input). The score is calculated based on whether the subject is higher or lower than the previous points, and the cumulative score is used to determine the strength of the trend.
Long and Short Signal Logic
Long Signals: A long signal is triggered when the score surpasses the Long Threshold (default set at 40). This suggests that the price has built sufficient upward momentum, indicating a potential buying opportunity.
Short Signals: A short signal is triggered when the score crosses under the Short Threshold (default set at -10). This indicates weakening price action or a potential downtrend, signaling a possible selling or shorting opportunity.
By utilizing this scoring system, the indicator identifies moments when the price momentum is shifting, helping traders enter positions at opportune times.
Customization and Visualization Options
One of the strengths of this indicator is its flexibility. Traders can customize various settings to fit their personal trading style or adapt it to different markets and timeframes:
Calculation Periods: Adjust the lookback period for the Butterworth filter, allowing for shorter or longer smoothing depending on the desired sensitivity.
Threshold Levels: Set the long and short thresholds to define when signals should be triggered, giving you control over the balance between sensitivity and specificity.
Signal Line Width and Colors: Customize the visual presentation of the indicator on the chart, including the width of the signal line and the colors used for long and short conditions.
Candlestick and Background Colors: If desired, the indicator can color the candlesticks or the background according to the detected trend, offering additional clarity at a glance.
Trading Applications
This Two Pole Butterworth For Loop indicator is versatile and can be adapted to various market conditions and trading strategies. Here are a few use cases where this indicator shines:
Trend Following: The Butterworth filter smooths the price data, making it easier to follow trends and identify when they are gaining or losing strength. The for-loop scoring system enhances this by providing a clear indication of how strong the current trend is compared to recent history.
Mean Reversion: For traders looking to identify potential reversals, the indicator’s ability to compare the filtered price to previous values over a range of periods allows it to spot moments when the trend may be losing steam, potentially signaling a reversal.
Swing Trading: The combination of smoothing and scoring allows swing traders to capture short to medium-term price movements by filtering out the noise and focusing on significant shifts in momentum.
Risk Management: By providing clear long and short signals, this indicator helps traders manage their risk by offering well-defined entry and exit points. The smooth nature of the Butterworth filter also reduces the risk of getting caught in false signals due to market noise.
Final Thoughts
The Two Pole Butterworth For Loop indicator offers traders a powerful combination of smoothing and scoring to detect meaningful trends and shifts in price momentum. Whether you are a trend follower, swing trader, or someone looking to refine your entry and exit points, this indicator provides the tools to make more informed trading decisions.
As always, it's essential to backtest the indicator on historical data and tailor the settings to your specific trading style and market. While the Butterworth filter helps reduce noise and smooth trends, no indicator can predict the future with absolute certainty, so it should be used in conjunction with other tools and sound risk management practices.
Thus following all of the key points here are some sample backtests on the 1D Chart
Disclaimer: Backtests are based off past results, and are not indicative of the future.
INDEX:BTCUSD
INDEX:ETHUSD
BINANCE:SOLUSD

Market Oracle Plus [ChartPrime]ChartPrime Oracle Plus combines actionable, elegant and functional indicators into a single toolkit. It builds upon previously laid out creations in order to create a more advanced experience. Combinations of both trend following and contrarian logic aim to provide traders with a deeper insight into market movements; aiming to assist in better entries and exits.
Designed and created by the ChartPrime team, this toolkit takes deeper level theory and expresses it in a usable format for traders. ChartPrime Oracle Plus is designed to satisfy and cover major trading theories allowing the user to pick and select the features that fit them.
Trend signals, Prime Ranges and Quantum Reactor
When using any indicator suite it is important to understand these tools are there to assist trading rather than to be a single source of truth. Functionality such as Auto Maximization of parameters is there to guide and enhance user experience, however it is important to be aware of overfitting results.
Plus features:
ChartPrime Market Oracle Plus has introduced some unique additions in order to enhance traders’ experiences.
Custom Signals: Toolkits and signals often limit traders to a single algorithm. This reduces flexibility and adaptability in the market. Traders will often want to develop their own systems without the constraints of an existing one. Market Oracle Plus introduces a custom signals builder; taking components in the toolkit and allowing them to be combined into a single signal/alert. Want a signal when the trend changes with bullish candlestick patterns? With a few clicks this can now be enabled. Traders can also set alerts on their custom signals making automating trades easier than ever.
Custom signals labelled with a cross
The Quantum tools. Looking at the tiny in the market and making it clearer.
Quantum Bands: The quantum bands provide areas of highly likely reversals to occur by analysing market momentum and noise. They can be used classically and are comparable in application to the commonly used bollinger bands. When price finds itself inside a zone it is more likely to reverse. This is excellent when used in confluence with other reversal indicators. The reason these bands are unique is their ability to adapt to trending markets allowing not only reversals to be identified in ranging markets but also trending ones leveraging volatility calculations. They also enable the user to use MTF functionality to load bands from higher timeframes. This allows users to have a broader perspective of support and resistance levels in the market.
The quantum bands are powerful for scalpers who want faster entries and exits. Entering a trade on a bands extremity can give earlier entries and exiting on the touch of the opposing band can serve as a great take profit.
Quantum Bands bounce
Quantum Reactor: The quantum reactor is a custom weighted moving average analyzing trends in the market. Unlike another moving averages; weighting has been considered to account for ranging markets. The Reactor will turn gray in a ranging market to avoid chop allowing for filtering of trades. This offers a unique insight into price action. Classical moving averages will constantly attempt to re-adapt to a trend whereas the Reactor will avoid adaptation where it sees fit.
Filtering a ranging market
Features included & Use cases:
Signal Mode: Select the type of assistive signals you are requiring. Provided are both trend following signals with self optimization using backtest results as well as reversal signals, aiming to provide real time tops and bottoms in markets. Both these signal modes can be fine tuned using the tuning input to refine signals to a trader's liking. The ChartPrime Auto Maximizer will automatically apply a backtested parameter and display the "best performing signals" on your chart. It is important to note this is not indicative of future results. ChartPrime Trend Signals leverage audio engineering inspired techniques and low-pass filters in order to achieve and attempt to produce lower lag response times and therefore is designed to have a uniqueness when compared to more classical trend following approaches.
Candle Highlighting: Choose between a clean gradient or more classical red/green coloring. These color the candles to assist with trend identification.
ChartPrime Dashboard: This redesigned dashboard provides 4 simple to interpret metrics. Firstly, the Optimal Tuning box provides a backtested result giving you the most accurate input. Again, it is important to note this is not indicative of future results. A Prime Score is also provided. This metric is a collection of ChartPrime trend following indicators bundled into a single item. It ranges from 0 (being a very bearish trend) to 10 (being a very bullish trend). 5 would indicate a ranging market. A consolidation score is also provided showing how "ranging" the market is. 10 being a low volatility and consolidating market and 0 being a more volatile and trending market which can assist the trader in avoiding ranges (if undesired). Finally the market prophecy gives simple forecasts in text form giving outlooks on potential activity.
The unique bar based visualization makes it clearer than ever to quantify key metrics on your chart.
Additional Features:
The Dynamic Reactor provides a simple band passing through the chart. This can provide assistance in support and resistance locations as well as identifying the trend direction expressed via green and red colors. Taking a moving average and applying unique low lag adaptivity calculations gives this plot a unique and fast behavior. This gives a unique edge to standard high length moving averages.
The Prime Ranges provide VWAP inspired real time actionable ranges on your chart. These ranges provide support and resistance levels as well as coloring, once again, there to aid trend identification. By generating a distribution and projecting it we produce real time levels for traders.
Candlestick structures analyze candlestick formation putting a spin on classical candlestick patterns and provide the most relevant formations on the chart. These are not classical and are filtered by further analyzing market activity. A trader's classic with a spin.
The Prime Trend Assistant provides a trend following dynamic support and resistance level. This makes it perfect to use in confluence or as a filter for other supporting indicators. This is an adaptive trend following system designed to handle volatility leveraging filter kernels as opposed to low pass filters.
Settings:
Signal Mode: Drop down to select the types of signals wanted
Tuning: Integer input to adjust signal's responsiveness. Lower inputs result in more frequent signals being produced.
Auto Maximizer Toggle: Automatically apply a backtested parameter to the signals
Dashboard Size: Drop down to select the size of the dashboard
Dashboard Position: Change the location of the dashboard on your chart
Additional Features: A set of toggles turning on/off these indicators.
Example Usecases:
Trend based confluences:
ChartPrime Oracle Plus provides classical (all be-it self optimizing) trend based signals. When trading, taking into consideration other forms of confluences are crucial. Take the image below:
Here we see the quantum reactor being green suggesting the market was in an upwards trend. We then see a sell signal appear. Knowing that we were in a macro uptrend allows us to filter out signals that go against this. Albeit basic; understanding multi-level confluence is key.
Features such as the Prime Ranges have duplicate usecases whereby a trend can be identified via the color of the bands as well as providing TP/SL levels. Considering these assisting features is vital before entering a trade.
Contrarian trading methodologies:
Commonly; trading with a trending market is most well known. However; markets are just as susceptible to ranging behaviors. ChartPrime has designed this toolkit to cater to most market conditions. For example, finding confluence between reversal indicators such as our contrarian signals and the Quantum Band can provide for some very strong confluence that can help a trader attempt to enter at bottoms of retracements and achieve the best possible entries or exits.
Developing confluences as shown above can be key to a trader's success. It is important to avoid biases when looking at indicators and view the market as objectively as possible.
ChartPrime believes that there is no magic indicator that is able to print money. Indicator toolkits provide value via their convenience, adaptability and uniqueness. Combining these items can help a trader make more educated; less messy, more planned trades and in turn hopefully help them succeed.
Risk Disclaimer
All content and developments created by ChartPrime are purely for informational & educational purposes only. Past performance does not guarantee future results. Suggested usecases are theoretical.
Script payant

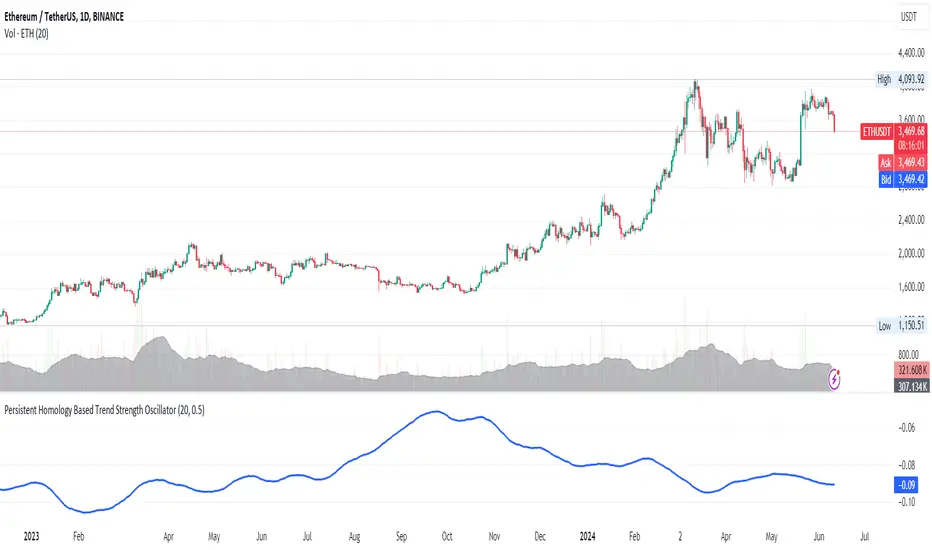
Persistent Homology Based Trend Strength OscillatorPersistent Homology Based Trend Strength Oscillator
The Persistent Homology Based Trend Strength Oscillator is a unique and powerful tool designed to measure the persistence of market trends over a specified rolling window. By applying the principles of persistent homology, this indicator provides traders with valuable insights into the strength and stability of uptrends and downtrends, helping to inform better trading decisions.
What Makes This Indicator Original?
This indicator's originality lies in its application of persistent homology , a method from topological data analysis, to financial markets. Persistent homology examines the shape and features of data across multiple scales, identifying patterns that persist as the scale changes. By adapting this concept, the oscillator tracks the persistence of uptrends and downtrends in price data, offering a novel approach to trend analysis.
Concepts Underlying the Calculations:
Persistent Homology: This method identifies features such as clusters, holes, and voids that persist as the scale changes. In the context of this indicator, it tracks the duration and stability of price trends.
Rolling Window Analysis: The oscillator uses a specified window size to calculate the average length of uptrends and downtrends, providing a dynamic view of trend persistence over time.
Threshold-Based Trend Identification: It differentiates between uptrends and downtrends based on specified thresholds for price changes, ensuring precision in trend detection.
How It Works:
The oscillator monitors consecutive changes in closing prices to identify uptrends and downtrends.
An uptrend is detected when the closing price increase exceeds a specified positive threshold.
A downtrend is detected when the closing price decrease exceeds a specified negative threshold.
The lengths of these trends are recorded and averaged over the chosen window size.
The Trend Persistence Index is calculated as the difference between the average uptrend length and the average downtrend length, providing a measure of trend persistence.
How Traders Can Use It:
Identify Trend Strength: The Trend Persistence Index offers a clear measure of the strength and stability of uptrends and downtrends. A higher value indicates stronger and more persistent uptrends, while a lower value suggests stronger and more persistent downtrends.
Spot Trend Reversals: Significant shifts in the Trend Persistence Index can signal potential trend reversals. For instance, a transition from positive to negative values might indicate a shift from an uptrend to a downtrend.
Confirm Trends: Use the Trend Persistence Index alongside other technical indicators to confirm the strength and duration of trends, enhancing the accuracy of your trading signals.
Manage Risk: Understanding trend persistence can help traders manage risk by identifying periods of high trend stability versus periods of potential volatility. This can be crucial for timing entries and exits.
Example Usage:
Default Settings: Start with the default settings to get a feel for the oscillator’s behavior. Observe how the Trend Persistence Index reacts to different market conditions.
Adjust Thresholds: Fine-tune the positive and negative thresholds based on the asset's volatility to improve trend detection accuracy.
Combine with Other Indicators: Use the Persistent Homology Based Trend Strength Oscillator in conjunction with other technical indicators such as moving averages, RSI, or MACD for a comprehensive analysis.
Backtesting: Conduct backtesting to see how the oscillator would have performed in past market conditions, helping you to refine your trading strategy.
Normalised T3 Oscillator [BackQuant]Normalised T3 Oscillator
The Normalised T3 Oscillator is an technical indicator designed to provide traders with a refined measure of market momentum by normalizing the T3 Moving Average. This tool was developed to enhance trading decisions by smoothing price data and reducing market noise, allowing for clearer trend recognition and potential signal generation. Below is a detailed breakdown of the Normalised T3 Oscillator, its methodology, and its application in trading scenarios.
1. Conceptual Foundation and Definition of T3
The T3 Moving Average, originally proposed by Tim Tillson, is renowned for its smoothness and responsiveness, achieved through a combination of multiple Exponential Moving Averages and a volume factor. The Normalised T3 Oscillator extends this concept by normalizing these values to oscillate around a central zero line, which aids in highlighting overbought and oversold conditions.
2. Normalization Process
Normalization in this context refers to the adjustment of the T3 values to ensure that the oscillator provides a standard range of output. This is accomplished by calculating the lowest and highest values of the T3 over a user-defined period and scaling the output between -0.5 to +0.5. This process not only aids in standardizing the indicator across different securities and time frames but also enhances comparative analysis.
3. Integration of the Oscillator and Moving Average
A unique feature of the Normalised T3 Oscillator is the inclusion of a secondary smoothing mechanism via a moving average of the oscillator itself, selectable from various types such as SMA, EMA, and more. This moving average acts as a signal line, providing potential buy or sell triggers when the oscillator crosses this line, thus offering dual layers of analysis—momentum and trend confirmation.
4. Visualization and User Interaction
The indicator is designed with user interaction in mind, featuring customizable parameters such as the length of the T3, normalization period, and type of moving average used for signals. Additionally, the oscillator is plotted with a color-coded scheme that visually represents different strength levels of the market conditions, enhancing readability and quick decision-making.
5. Practical Applications and Strategy Integration
Traders can leverage the Normalised T3 Oscillator in various trading strategies, including trend following, counter-trend plays, and as a component of a broader trading system. It is particularly useful in identifying turning points in the market or confirming ongoing trends. The clear visualization and customizable nature of the oscillator facilitate its adaptation to different trading styles and market environments.
6. Advanced Features and Customization
Further enhancing its utility, the indicator includes options such as painting candles according to the trend, showing static levels for quick reference, and alerts for crossover and crossunder events, which can be integrated into automated trading systems. These features allow for a high degree of personalization, enabling traders to mold the tool according to their specific trading preferences and risk management requirements.
7. Theoretical Justification and Empirical Usage
The use of the T3 smoothing mechanism combined with normalization is theoretically sound, aiming to reduce lag and false signals often associated with traditional moving averages. The practical effectiveness of the Normalised T3 Oscillator should be validated through rigorous backtesting and adjustment of parameters to match historical market conditions and volatility.
8. Conclusion and Utility in Market Analysis
Overall, the Normalised T3 Oscillator by BackQuant stands as a sophisticated tool for market analysis, providing traders with a dynamic and adaptable approach to gauging market momentum. Its development is rooted in the understanding of technical nuances and the demand for a more stable, responsive, and customizable trading indicator.
Thus following all of the key points here are some sample backtests on the 1D Chart
Disclaimer: Backtests are based off past results, and are not indicative of the future.
INDEX:BTCUSD
INDEX:ETHUSD
BINANCE:SOLUSD

VCBBDOVWAPSMA By Anil ChawraHow Users Can Make Profit Using This Script:
1. Volume Representation : Each candle on the chart represents a specific time period (e.g., 1 minute, 1 hour, 1 day) and includes information about both price movement and trading volume during that period.
2. Candlestick Anatomy : A volume candle has the same components as a regular candlestick: the body (which represents the opening and closing prices) and the wicks or shadows (which indicate the highest and lowest prices reached during the period).
3. Volume Bars : Instead of just the candlestick itself, volume candles also include a bar or histogram representing the trading volume during that period. The height or length of the volume bar indicates the amount of trading activity.
4. Interpreting Volume : High volume candles typically indicate increased market interest or activity during that period. This could be due to significant buying or selling pressure.
5. Confirmation : Traders often look for confirmation from other technical indicators or price action to validate the significance of a high volume candle. For example, a high volume candle breaking through a key support or resistance level may signal a strong market move.
6. Trend Strength : Volume candles can provide insights into the strength of a trend. A series of high volume candles in the direction of the trend suggests strong momentum, while decreasing volume may indicate weakening momentum or a potential reversal.
7. Volume Patterns : Traders also analyze volume patterns, such as volume spikes or divergences, to identify potential trading opportunities or reversals.
8. Combination with Price Action: Volume analysis is often used in conjunction with price action analysis and other technical indicators to make more informed trading decisions.
9. Confirmation and Validation: It's important to confirm the significance of volume candles with other indicators or price action signals to avoid false signals.
10. Risk Management : As with any trading strategy, proper risk management is crucial when using volume candles to make trading decisions. Set stop-loss orders and adhere to risk management principles to protect your capital.
How to script works :
1.Identify High Volume Candles: Look for candles with significantly higher volume compared to the surrounding candles. These can indicate increased market interest or activity.
2.Wait for Confirmation: Once you identify a high volume candle, wait for confirmation from subsequent candles to ensure the momentum is sustained.
3.Enter the Trade: After confirmation, consider entering a trade in the direction indicated by the high volume candle. For example, if it's a bullish candle, consider buying.
4.Set Stop Loss: Always set a stop loss to limit potential losses in case the trade goes against you.
5.Take Profit: Set a target for taking profits. This could be based on technical analysis, such as a resistance level or a certain percentage gain.
6.Monitor Volume: Continuously monitor volume to gauge the strength of the trend. Decreasing volume may signal weakening momentum and could be a sign to exit the trade.
7.Risk Management: Manage risk carefully by adjusting position sizes according to your risk tolerance and the size of your trading account.
8.Review and Adapt: Regularly review your trades and adapt your strategy based on what's working and what's not.
Remember, no trading strategy guarantees profits, and it's essential to practice proper risk management and have realistic expectations. Additionally, consider combining volume analysis with other technical indicators for a more comprehensive approach to trading.
**How Users Can Make Profit Using This Script:
**
DAYS OPEN LINE:
1.Purpose: Publishing a "Days Open Line" indicator serves to inform customers about the operational schedule of a business or service.
2.Visibility: It ensures that the information regarding the days of operation is easily accessible to current and potential customers.
3.Transparency: By making the operational schedule public, businesses demonstrate transparency and reliability to their customers.
4.Accessibility: The indicator should be published on various platforms such as the business website, social media channels, and physical locations to ensure accessibility to a wide audience.
5.Clarity: The information should be presented in a clear and concise manner, specifying the days of the week the business is open and the corresponding operating hours.
6.Updates: It's important to regularly update the "Days Open Line" indicator to reflect any changes in the operational schedule, such as holidays or special events.
7.Customer Convenience: Providing this information helps customers plan their visits accordingly, reducing inconvenience and frustration due to unexpected closures.
8.Expectation Management: Setting clear expectations regarding the business hours helps manage customer expectations and reduces the likelihood of disappointment or complaints.
9.Customer Service: Publishing the "Days Open Line" indicator demonstrates a commitment to customer service by ensuring that customers have the information they need to engage with the business.
10.Brand Image: Consistently .maintaining and updating the indicator contributes to a positive brand image, as it reflects professionalism, reliability, and a customer-centric approach.
SMA CROSS:
1.This indicator generates buy and sell signals based on the crossover of two Simple Moving Averages (SMA): a shorter 3-day SMA and a longer 8-day SMA.
When the 3-day SMA crosses above the 8-day SMA, it generates a buy signal indicating a potential upward trend.
Conversely, when the 3-day SMA crosses below the 8-day SMA, it generates a sell signal indicating a potential downward trend.
Signal Interpretation:
2.Buy Signal: Generated when the 3-day SMA crosses above the 8-day SMA.
Sell Signal: Generated when the 3-day SMA crosses below the 8-day SMA.
Usage:
3.Traders can use this indicator to identify potential entry and exit points in the market.
Buy signals suggest a bullish trend, indicating a favorable time to enter or hold a long position.
4.Sell signals suggest a bearish trend, indicating a potential opportunity to exit or take a short position.
Parameters:
5.Periods: 3-day SMA and 8-day SMA.
Price: Closing price is commonly used, but users can choose other price types (open, high, low) for calculation.
Confirmation:
6.It's recommended to use additional technical analysis tools or confirmatory indicators to validate signals and minimize false signals.
Risk Management:
7.Implement proper risk management strategies, such as setting stop-loss orders, to mitigate losses in case of adverse price movements.
Backtesting:
8.Before using the indicator in live trading, conduct thorough backtesting to evaluate its effectiveness under various market conditions.
Considerations:
9.While SMA crossovers can provide valuable insights, they may generate false signals during ranging or choppy markets.
Combine this indicator with other technical analysis techniques for comprehensive market analysis.
Continuous Optimization:
10.Monitor the performance of the indicator and adjust parameters or incorporate additional filters as needed to enhance accuracy over time.
BOLLINGER BAND:
1.Definition: A Bollinger Band indicator is a technical analysis tool that consists of a centerline (typically a moving average) and two bands plotted above and below it. These bands represent volatility around the moving average.
2.Purpose: Publishing a Bollinger Band indicator serves to provide traders and investors with insights into the volatility and potential price movements of a financial instrument.
3.Visualization: The indicator is typically displayed on price charts, allowing users to visualize the relationship between price movements and volatility levels.
4.Interpretation: Traders use Bollinger Bands to identify overbought and oversold conditions, potential trend reversals, and volatility breakouts.
5.Components: The indicator consists of three main components: the upper band, lower band, and centerline (usually a simple moving average). These components are calculated based on standard deviations from the moving average.
6.Parameters: Traders can adjust the parameters of the Bollinger Bands, such as the period length and standard deviation multiplier, to customize the indicator based on their trading strategy and preferences.
7.Signals: Bollinger Bands generate signals when prices move outside the bands, indicating potential trading opportunities. For example, a price breakout above the upper band may signal a bullish trend continuation, while a breakout below the lower band may indicate a bearish trend continuation.
8.Confirmation: Traders often use other technical indicators or price action analysis to confirm signals generated by Bollinger Bands, enhancing the reliability of their trading decisions.
9.Education: Publishing Bollinger Band indicators can serve an educational purpose, helping traders learn about technical analysis concepts and how to apply them in real-world trading scenarios.
10.Risk Management: Traders should exercise proper risk management when using Bollinger Bands, as false signals and market volatility can lead to losses. Publishing educational content alongside the indicator can help users understand the importance of risk management in trading.
VWAP:
1.Calculation: VWAP is calculated by dividing the cumulative sum of price times volume traded for every transaction (price * volume) by the total volume traded.
2.Time Frame: VWAP is typically calculated for a specific time frame, such as a trading day or a session.
3.Intraday Trading: It's commonly used by intraday traders to assess the fair value of a security and to determine if the current price is above or below the average price traded during the day.
4.Execution: Institutional traders often use VWAP as a benchmark for executing large orders, aiming to buy at prices below VWAP and sell at prices above VWAP.
5.Benchmark: It serves as a benchmark for traders to evaluate their trading performance. Trades executed below VWAP are considered good buys, while those above are considered less favorable.
6.Sensitivity: VWAP is more sensitive to price and volume changes during periods of high trading activity and less sensitive during periods of low trading activity.
7.Day's End: VWAP resets at the end of each trading day, providing a new reference point for the following trading session.
8.Volume Weighting: The weighting by volume means that prices with higher trading volumes have a greater impact on VWAP than those with lower volumes.
9.Popular with Algorithmic Traders: Algorithmic trading systems often incorporate VWAP strategies to execute trades efficiently and minimize market impact.
10.Limitations: While VWAP is a useful indicator, it's not foolproof. It may lag behind rapidly changing market conditions and may not be suitable for all trading strategies or market conditions. Additionally, it's more effective in liquid markets where there is significant trading volume.

Day Open Line + SMA 8/3 Crossover + BollingerHow Users Can Make Profit Using This Script:
DAYS OPEN LINE:
1.Purpose: Publishing a "Days Open Line" indicator serves to inform customers about the operational schedule of a business or service.
2.Visibility: It ensures that the information regarding the days of operation is easily accessible to current and potential customers.
3.Transparency: By making the operational schedule public, businesses demonstrate transparency and reliability to their customers.
4.Accessibility: The indicator should be published on various platforms such as the business website, social media channels, and physical locations to ensure accessibility to a wide audience.
5.Clarity: The information should be presented in a clear and concise manner, specifying the days of the week the business is open and the corresponding operating hours.
6.Updates: It's important to regularly update the "Days Open Line" indicator to reflect any changes in the operational schedule, such as holidays or special events.
7.Customer Convenience: Providing this information helps customers plan their visits accordingly, reducing inconvenience and frustration due to unexpected closures.
8.Expectation Management: Setting clear expectations regarding the business hours helps manage customer expectations and reduces the likelihood of disappointment or complaints.
9.Customer Service: Publishing the "Days Open Line" indicator demonstrates a commitment to customer service by ensuring that customers have the information they need to engage with the business.
10.Brand Image: Consistently .maintaining and updating the indicator contributes to a positive brand image, as it reflects professionalism, reliability, and a customer-centric approach.
SMA CROSS:
1.This indicator generates buy and sell signals based on the crossover of two Simple Moving Averages (SMA): a shorter 3-day SMA and a longer 8-day SMA.
When the 3-day SMA crosses above the 8-day SMA, it generates a buy signal indicating a potential upward trend.
Conversely, when the 3-day SMA crosses below the 8-day SMA, it generates a sell signal indicating a potential downward trend.
Signal Interpretation:
2.Buy Signal: Generated when the 3-day SMA crosses above the 8-day SMA.
Sell Signal: Generated when the 3-day SMA crosses below the 8-day SMA.
Usage:
3.Traders can use this indicator to identify potential entry and exit points in the market.
Buy signals suggest a bullish trend, indicating a favorable time to enter or hold a long position.
4.Sell signals suggest a bearish trend, indicating a potential opportunity to exit or take a short position.
Parameters:
5.Periods: 3-day SMA and 8-day SMA.
Price: Closing price is commonly used, but users can choose other price types (open, high, low) for calculation.
Confirmation:
6.It's recommended to use additional technical analysis tools or confirmatory indicators to validate signals and minimize false signals.
Risk Management:
7.Implement proper risk management strategies, such as setting stop-loss orders, to mitigate losses in case of adverse price movements.
Backtesting:
8.Before using the indicator in live trading, conduct thorough backtesting to evaluate its effectiveness under various market conditions.
Considerations:
9.While SMA crossovers can provide valuable insights, they may generate false signals during ranging or choppy markets.
Combine this indicator with other technical analysis techniques for comprehensive market analysis.
Continuous Optimization:
10.Monitor the performance of the indicator and adjust parameters or incorporate additional filters as needed to enhance accuracy over time.
BOLLINGER BAND:
1.Definition: A Bollinger Band indicator is a technical analysis tool that consists of a centerline (typically a moving average) and two bands plotted above and below it. These bands represent volatility around the moving average.
2.Purpose: Publishing a Bollinger Band indicator serves to provide traders and investors with insights into the volatility and potential price movements of a financial instrument.
3.Visualization: The indicator is typically displayed on price charts, allowing users to visualize the relationship between price movements and volatility levels.
4.Interpretation: Traders use Bollinger Bands to identify overbought and oversold conditions, potential trend reversals, and volatility breakouts.
5.Components: The indicator consists of three main components: the upper band, lower band, and centerline (usually a simple moving average). These components are calculated based on standard deviations from the moving average.
6.Parameters: Traders can adjust the parameters of the Bollinger Bands, such as the period length and standard deviation multiplier, to customize the indicator based on their trading strategy and preferences.
7.Signals: Bollinger Bands generate signals when prices move outside the bands, indicating potential trading opportunities. For example, a price breakout above the upper band may signal a bullish trend continuation, while a breakout below the lower band may indicate a bearish trend continuation.
8.Confirmation: Traders often use other technical indicators or price action analysis to confirm signals generated by Bollinger Bands, enhancing the reliability of their trading decisions.
9.Education: Publishing Bollinger Band indicators can serve an educational purpose, helping traders learn about technical analysis concepts and how to apply them in real-world trading scenarios.
10.Risk Management: Traders should exercise proper risk management when using Bollinger Bands, as false signals and market volatility can lead to losses. Publishing educational content alongside the indicator can help users understand the importance of risk management in trading.
VWAP:
1.Calculation: VWAP is calculated by dividing the cumulative sum of price times volume traded for every transaction (price * volume) by the total volume traded.
2.Time Frame: VWAP is typically calculated for a specific time frame, such as a trading day or a session.
3.Intraday Trading: It's commonly used by intraday traders to assess the fair value of a security and to determine if the current price is above or below the average price traded during the day.
4.Execution: Institutional traders often use VWAP as a benchmark for executing large orders, aiming to buy at prices below VWAP and sell at prices above VWAP.
5.Benchmark: It serves as a benchmark for traders to evaluate their trading performance. Trades executed below VWAP are considered good buys, while those above are considered less favorable.
6.Sensitivity: VWAP is more sensitive to price and volume changes during periods of high trading activity and less sensitive during periods of low trading activity.
7.Day's End: VWAP resets at the end of each trading day, providing a new reference point for the following trading session.
8.Volume Weighting: The weighting by volume means that prices with higher trading volumes have a greater impact on VWAP than those with lower volumes.
9.Popular with Algorithmic Traders: Algorithmic trading systems often incorporate VWAP strategies to execute trades efficiently and minimize market impact.
10.Limitations: While VWAP is a useful indicator, it's not foolproof. It may lag behind rapidly changing market conditions and may not be suitable for all trading strategies or market conditions. Additionally, it's more effective in liquid markets where there is significant trading volume.
How the Script Works:
1.Utilizes Day Open Line for accurate market entry points.
2.Identifies bullish trends with SMA 3 crossover SMA 8.
3.Signals potential sell opportunities with SMA 8 crossunder SMA 3.
4.Bollinger Bands indicate overbought and oversold conditions.
5.VWAP offers insights into average price levels weighted by volume.
6.Combination of indicators enhances trade confirmation.
7.Facilitates precise timing for buy and sell decisions.
8.Enables traders to capitalize on market volatility.
9.Empowers users to navigate dynamic market conditions.
10.Supports profitable trading strategies with comprehensive analysis.
11.It is known when the market is sideways.

RSI Graphique and Dashboard MTFMTF RSI Indicator - User Guide
Introduction:
The MTF RSI (Multi-Timeframe Relative Strength Index) Pine Script is designed to provide traders with a comprehensive view of the RSI (Relative Strength Index) across multiple timeframes. The script includes a primary chart displaying RSI values and a dashboard summarizing RSI trends for different time intervals.
Installation:
Copy the provided Pine Script.
Open the TradingView platform.
Create a new script.
Paste the copied code into the script editor.
Save and apply the script to your chart.
Primary Chart:
The primary chart displays RSI values for the selected timeframe (5, 15, 60, 240, 1440 minutes).
different color lines represent RSI values for different timeframes.
Overbought and Oversold Levels:
Overbought levels (70) are marked in red, while oversold levels (30) are marked in blue for different timeframes.
Dashboard:
The dashboard is a quick reference for RSI trends across multiple timeframes.
Each row represents a timeframe with corresponding RSI trend information.
Arrows (▲ for bullish, ▼ for bearish) indicate the current RSI trend.
Arrow colors represent the trend: blue for bullish, red for bearish.
Settings:
Users can customize the RSI length, background color, and other parameters.
The background color of the dashboard can be adjusted for light or dark themes.
Interpretation:
Bullish Trend: ▲ arrow and blue color.
Bearish Trend: ▼ arrow and red color.
RSI values above 70 may indicate overbought conditions, while values below 30 may indicate oversold conditions.
Practical Tips:
Timeframe Selection: Consider the trend alignment across different timeframes for comprehensive market analysis.
Confirmation: Use additional indicators or technical analysis to confirm RSI signals.
Backtesting: Before applying in live trading, conduct thorough backtesting to evaluate the script's performance.
Adjustment: Modify settings according to your trading preferences and market conditions.
Disclaimer:
This script is a tool for technical analysis and should be used in conjunction with other indicators. It is not financial advice, and users should conduct their own research before making trading decisions. Adjust settings based on personal preferences and risk tolerance. Use the script responsibly and at your own risk.

SIP SmartlyIntroduction:
The SIP Smartly indicator is designed to mimic the behavior of a systematic investment plan, a popular investment strategy where a fixed quantity of an asset is purchased at regular intervals, typically monthly. In this case, we're applying this concept to trading by specifying a start date, a fixed purchase quantity, and certain conditions for buying.
Indicator Components:
User Inputs:
1. Start Date Inputs:
startyear, startmonth, startday: These inputs allow you to specify the year, month, and day when the SIP strategy begins.
2. buyQty:
This input allows you to specify the quantity of the security to purchase in each SIP installment.
What is Standard SIP ?
A Standard Systematic Investment Plan (SIP) is an investment strategy where individuals consistently invest a fixed amount of money at regular intervals, such as monthly or quarterly, in mutual funds or stocks. This approach promotes disciplined and long-term investing, taking advantage of rupee-cost averaging, where more shares are purchased when prices are low and fewer when prices are high. SIPs are designed for individuals seeking gradual wealth accumulation over time while mitigating the impact of market volatility through consistent, automated investments.
Logic of the Smart SIP Indicator:
Dynamic Quantity: The Smart SIP indicator allows you to invest a fixed quantity of a security at regular intervals based on technical analysis conditions. This is different from a standard SIP, where you typically invest a fixed amount of money.
Technical Analysis Driven: The Smart SIP indicator employs technical analysis indicators, such as multiple moving averages and uses the crossover of a higher MA with a lower MA which indicates a possible trend reversal, to determine Buy signals based on price trends. In contrast, a standard SIP doesn't consider technical factors but rather involves regular investments regardless of market conditions.
Adaptability: Unlike a standard SIP, which follows a predetermined investment schedule, the Smart SIP can adapt to changing market conditions. It triggers Buy actions only when specific technical conditions are met, providing a more flexible and responsive approach to investing or trading.
Market Value Tracking: The Smart SIP continuously tracks the market value of the invested quantity in real-time. This allows you to monitor the performance of your SIP investments dynamically, considering market fluctuations. In a standard SIP, you typically track the overall portfolio value without real-time adjustments.
Alert Notifications: The Smart SIP can send alert notifications when Buy conditions are met. This feature ensures timely execution of trades when favorable market conditions align with the technical criteria. In a standard SIP, you usually follow a fixed investment schedule without real-time alerting.
In summary, the unique logic of the Smart SIP indicator lies in its adaptability, technical analysis-driven approach, and real-time tracking and alerting features, making it well-suited for trading in financial markets while still following the concept of a systematic investment plan.
How to Use the SIP Smartly Indicator:
Start Date Selection:
Input your desired start date using the startyear, startmonth, and startday parameters. This is the date when your SIP strategy will begin.
Buy Quantity Setting:
Set the buyQty input to the quantity of the security you want to purchase in each SIP installment.
Alerts:
The indicator can trigger alerts when Buy conditions are met. These alerts can be configured to notify you when it's time to make a SIP installment.
Risk Management and Considerations:
Confirmation: While the SIP Smartly indicator provides insights, use it alongside other technical and fundamental analysis tools for confirmation before making trading decisions.
Backtesting: Before using this indicator in live trading, conduct thorough backtesting on historical data to evaluate its performance under different market conditions.
Position Sizing: Determine your position size and risk management rules based on the quantity purchased in each SIP installment.
Market Awareness: Stay informed about market conditions and news events that could impact price movements. This indicator is a tool to aid your trading strategy, not a standalone solution.
Conclusion:
The SIP Smartly Indicator offers a systematic approach to trading by simulating a SIP strategy. By inputting your start date and desired buy quantity, you can follow a disciplined investment approach in your trading. Remember to customize the inputs to match your trading preferences and risk tolerance.
Disclaimer: This indicator is provided for educational purposes and should be used with caution. Trading involves risks, and you should thoroughly test any strategy before applying it in live trading.

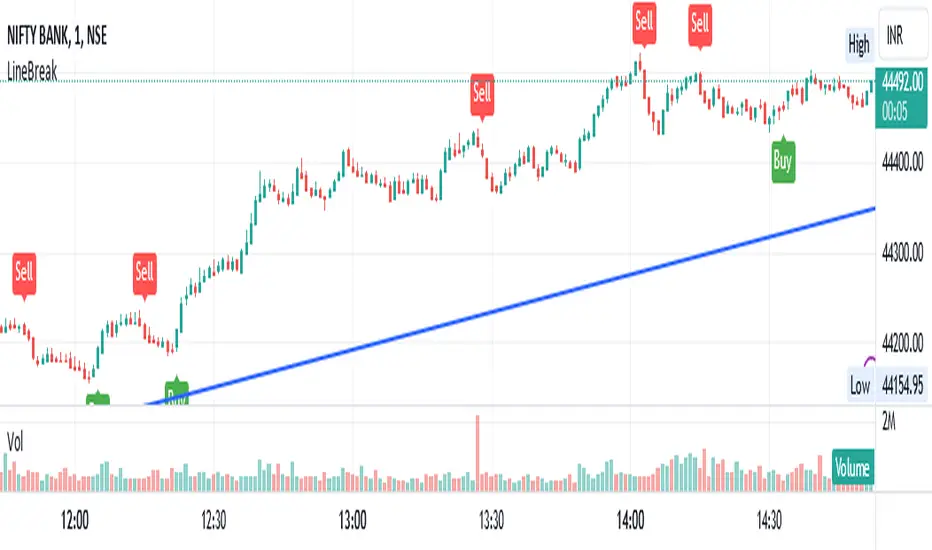
LineBreakIntroduction:
The LineBreak Indicator is a technical tool designed to assist traders in identifying potential trend reversals or continuations using a unique charting method known as Line Break charts. This indicator overlays Line Break chart patterns on the main price chart and generates Buy and Sell signals based on specific price movements. In this guide, we will explore the LineBreak Indicator's functionality and how to utilize it effectively in your trading strategy.
Indicator Components:
The LineBreak Indicator comprises several components that work together to identify potential trade signals:
Line Break Chart Creation:
The script starts with an indicator declaration, "@version=5," followed by the creation of the LineBreak chart overlay on the main price chart. Line Break charts focus solely on price movements, omitting time entirely.
Line Break Chart Data Retrieval:
The indicator requests Line Break chart data using the "ticker.linebreak" function, which generates Line Break brick patterns based on a specified brick size (in this case, 3). The script then retrieves the Line Break open, high, low, and close prices for analysis.
Buy and Sell Signal Generation:
The script generates Buy and Sell signals using plotshape functions and specific conditions based on Line Break chart patterns. These patterns involve the relationship between consecutive brick prices and their opening prices.
Alert Conditions:
The script establishes alert conditions for both Buy and Sell signals. These alerts notify traders when specific Line Break chart patterns are detected, ensuring timely awareness of potential trading opportunities.
How to Use the LineBreak Indicator:
Line Break Chart Analysis:
Begin by understanding the Line Break chart patterns displayed on the main price chart. Line Break charts focus on price movements rather than time intervals. An upward Line Break brick suggests bullish momentum, while a downward brick indicates bearish momentum.
Buy Signal Interpretation:
Pay attention to Buy signals generated by the indicator. A Buy signal is triggered when specific Line Break brick conditions are met, indicating a potential reversal from a downtrend to an uptrend. This suggests a potential opportunity to enter a long (Buy) trade.
Sell Signal Interpretation:
Likewise, be attentive to Sell signals produced by the indicator. A Sell signal occurs when predefined Line Break brick conditions are fulfilled, suggesting a potential reversal from an uptrend to a downtrend. This could signal a chance to enter a short (Sell) trade.
Alert Notifications:
To ensure you stay informed, set up alert conditions for Buy and Sell signals. Alerts can be customized to your preferences and communication channels, enabling you to promptly respond to potential trade setups.
Risk Management and Considerations:
Confirmation: While the LineBreak Indicator provides valuable insights, use it in conjunction with other technical analysis tools and indicators to confirm signals.
Backtesting: Before deploying the indicator in live trading, perform comprehensive backtesting on historical data to assess its performance and suitability for your trading strategy.
Position Sizing: Determine appropriate position sizes based on your risk tolerance and the signals provided by the LineBreak Indicator. Avoid overleveraging your trades.
Market Awareness: Stay aware of market conditions and news events that could influence price movements. The LineBreak Indicator is a tool to enhance your decision-making process, not a standalone strategy.
Conclusion:
The LineBreak Indicator introduces a different perspective on price movements through its unique charting method. By interpreting Line Break chart patterns and acting on generated Buy and Sell signals, traders can make informed trading decisions. Practice proper risk management and integrate the LineBreak Indicator into a comprehensive trading strategy to achieve consistent and successful trading outcomes.
Please remember that this guide provides a high-level overview of the LineBreak Indicator and its usage. It's essential to thoroughly test and validate any trading strategy before implementing it in a live trading environment.
RenkoIndicatorIntroduction:
The Renko Indicator is a powerful tool designed to help traders identify trends and potential trade opportunities in the financial markets. This indicator overlays a Renko chart on the main price chart and generates Buy and Sell signals based on Renko brick movements. Renko charts are unique in that they focus solely on price movements, ignoring the element of time. In this guide, we will walk you through how to use the Renko Indicator effectively in your trading strategy.
Indicator Components:
The Renko Indicator consists of several components, each serving a specific purpose in aiding your trading decisions.
Market Sentiment Calculation:
At the top of the script, the indicator calculates market sentiment by analyzing recent price action. It determines whether the market sentiment is Bullish, Bearish, or Neutral based on the highest and lowest prices within specific time periods. This information provides you with a broader context for potential trading decisions.
Renko Chart Creation:
The indicator creates a Renko chart overlay on the main price chart using the Average True Range (ATR) method. ATR is used to calculate the brick size for the Renko chart, allowing you to adjust the sensitivity of the chart to price movements.
Renko Open and Close Midpoint:
The script plots the midpoint of Renko open and close prices as a line on the main chart. This visualization helps you understand the direction of Renko bricks and identify trends.
Buy and Sell Signal Generation:
The script generates Buy and Sell signals as label shapes on the chart. A Buy signal is generated when the Renko close price crosses above the Renko open price, indicating potential upward momentum. Conversely, a Sell signal is generated when the Renko close price crosses below the Renko open price, suggesting potential downward momentum.
Alert Conditions:
To ensure you never miss a trading opportunity, the script sets up alert conditions for Buy and Sell signals. These alerts notify you when the specified conditions for potential trades are met. Alerts can be customized to your preference, allowing you to receive notifications via your chosen communication channels.
How to Use the Renko Indicator:
Market Sentiment Analysis:
Start by analyzing the calculated market sentiment. This information helps you understand the broader trend in the market. A Bullish sentiment indicates potential upward movement, a Bearish sentiment suggests potential downward movement, and a Neutral sentiment signals uncertainty.
Renko Chart Interpretation:
Observe the Renko chart overlay and its midpoint line. Upward-trending Renko bricks suggest Bullish momentum, while downward-trending bricks indicate Bearish momentum. Use the Renko chart to identify trends and confirm your trading bias.
Buy and Sell Signals:
Pay close attention to the Buy and Sell signals generated by the indicator. A Buy signal occurs when the Renko close price crosses above the Renko open price. Conversely, a Sell signal occurs when the Renko close price crosses below the Renko open price. These signals highlight potential entry points for trades.
Alert Notifications:
Make use of the alert conditions to receive real-time notifications for Buy and Sell signals. Alerts help you stay informed even when you're not actively watching the charts, allowing you to promptly take action on potential trade opportunities.
Risk Management and Considerations:
Confirmation: While the Renko Indicator provides valuable insights, it's crucial to use it in conjunction with other technical and fundamental analysis tools for confirmation.
Backtesting: Before implementing the indicator in live trading, conduct thorough backtesting on historical data to assess its performance and suitability for your trading strategy.
Position Sizing: Determine appropriate position sizes based on your risk tolerance and the signals provided by the indicator. Avoid overleveraging your trades.
Market Conditions: Be mindful of market conditions and news events that could impact price movements. Use the Renko Indicator as a tool to enhance your decision-making process, not as a standalone strategy.
Conclusion:
The Renko Indicator offers a unique perspective on price movements and can be a valuable addition to your trading toolkit. By analyzing market sentiment, interpreting Renko chart patterns, and acting on Buy and Sell signals, you can make informed trading decisions. Remember to practice proper risk management and integrate the Renko Indicator into a comprehensive trading strategy to achieve consistent and successful trading outcomes.

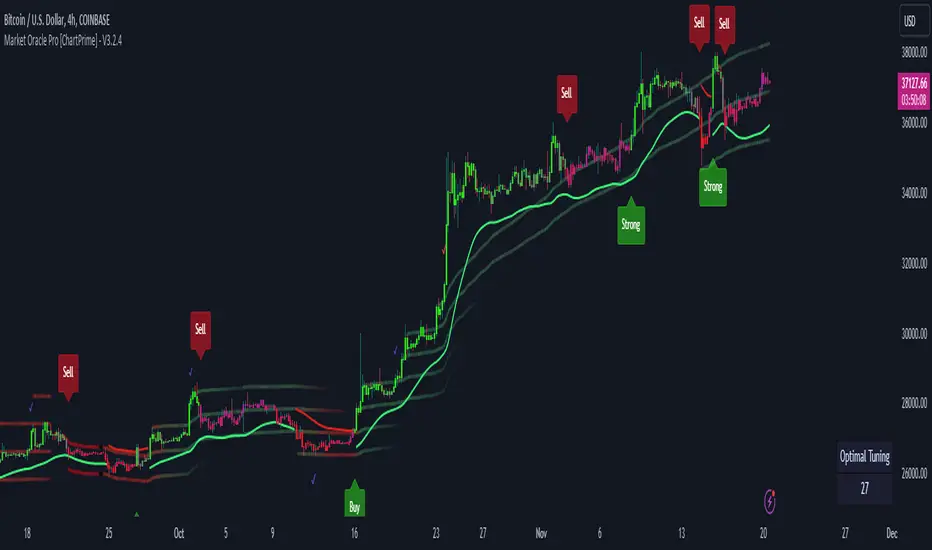
Market Oracle Pro [ChartPrime]ChartPrime Oracle Pro combines actionable, elegant and functional indicators into a single toolkit. Combinations of both trend following and contrarian logic aim to provide traders with a deeper insight into market movements; aiming to assist in better entries and exits.
Designed and created by the ChartPrime team, peacefullizard (digital signal processing expert), Gecko, and ExoMaven, this toolkit takes deeper level theory and expresses it in a useable format for traders. ChartPrime Oracle Pro is designed to satisfy and cover major trading theories allowing the user to pick and select the features that fit them.
When using any indicator suite it is important to understand these tools are there to assist trading rather than to be a single source of truth. Functionality such as Auto Maximization of parameters is there to guide and enhance user experience, however it is important to be aware of overfitting results.
Features included & Use cases:
Signal Mode: Select the type of assistive signals you are requiring. Provided are both trend following signals with self optimization using backtest results as well as reversal signals, aiming to provide real time tops and bottoms in markets. Both these signal modes can be fine tuned using the tuning input to refine signals to a trader's liking. The ChartPrime Auto Maximizer will automatically apply a backtested parameter and display the "best performing signals" on your chart. It is important to note this is not indicative of future results. ChartPrime Trend Signals leverage audio engineering inspired techniques and low-pass filters in order to achieve and attempt to produce lower lag response times and therefore is designed to have a uniqueness when compared to more classical trend following approaches.
Candle Highlighting: Choose between a clean gradient or more classical red/green coloring. These color the candles to assist with trend identification.
ChartPrime Dashboard: This cleanly designed dashboard provides 3 simple to interpret metrics. Firstly, the Optimal Tuning box provides a backtested result giving you the most accurate input. Again, it is important to note this is not indicative of future results. A Prime Score is also provided. This metric is a collection of ChartPrime trend following indicators bundled into a single item. It ranges from 0 (being very bearish trend) to 10 (being a very bullish trend). 5 would indicate a ranging market. A consolidation score is also provided showing how "ranging" the market is. 10 being a low volatility and consolidating market and 0 being a more volatile and trending market which can assist the trader in avoiding ranges (if undesired).
Additional Features:
The Dynamic Reactor provides a simple band passing through the chart. This can provide assistance in support and resistance locations as well as identifying the trend direction expressed via green and red colors. Taking a moving average and applying unique adaptivity calculations gives this plot a unique and fast behaviour.
The Prime Ranges provide VWAP inspired real time actionable ranges on your chart. These ranges provide support and resistance levels as well as coloring, once again, there to aid trend identifcation. By generating a distribution and projecting it we produce real time levels for traders.
Candlestick structures analyze candlestick formation putting a spin on classical candlestick patterns and provide the most relevant formations on the chart. These are not classical and are filtered by further analyzing market activity. A trader's classic with a spin.
The Momentum Wave Bands provide classical areas of high deviation where the price may reverse. It also provides additional insight on trend direction and volatility.
The Prime Trend Assistant provides a trend following dynamic support and resistance level. This makes it perfect to use in confluence or as a filter for other supporting indicators. This is an adaptive trend following system designed to handle volatility leveraging filter kernels as apposed to low pass filters.
Settings:
Signal Mode: Drop down to select the types of signals wanted
Tuning: Integer input to adjust signal's responsiveness. Lower inputs result in more frequent signals being produced.
Auto Maximizer Toggle: Automatically apply a backtested parameter to the signals
Dashboard Size: Drop down to select the size of the dashboard
Dashboard Position: Change the location of the dashboard on your chart
Additional Features: A set of toggles turning on/off these indicators.
Example Usecases:
Trend based confluences:
ChartPrime Oracle Pro provides classical (all be-it self optimizing) trend based signals. When trading, taking into consideration other forms of confluences are crucial. Take the image below: Here we see a *uptrend* where smaller retracements in price action are resulting in sell signals. When identifying a trend, analyzing the macro and micro price action can help the trader deduce how relevant a move in the market may be. We can use the Prime Trend Assistant to help filter out said retracements. We are also able to use the Prime Ranges in a similar way.
Features such as the Prime Ranges have duplicate usecases whereby a trend can be idenfied via the color of the bands as well as providing TP/SL levels. Considering these assisting features is vital before entering a trade.
Contrarian trading methodologies:
Commonly; trading with a trending market is most well known. However; markets are just as susceptible to ranging behaviors. ChartPrime has designed this toolkit to cater to most market conditions. For example, finding confluence between reversal indicators such as our contrarian signals and the momentum wave band can provide for some very strong confluence that can help a trader attempt to enter at bottoms of retracements and achieve the best possible entries or exits.
Developing confluences as shown above can be key to a trader's success. It is import ant to avoid biases when looking at indicators and view the market as objectively as possible.
ChartPrime believe that there is no magic indicator that is able to print money. Indicator toolkits provide value via their convinience, adaptibility and uniqueness. Combining these items can help a trader make more educated; less messy, more planned trades and in turn hopefully help them succeed.
Risk Disclaimer
All content and developments created by ChartPrime are purely for informational & educational purposes only. Past performance does not guarantee future results.
Script payant
Pivot Highs&lows: Short/Medium/Long-term + Spikeyness FilterShows Pivot Highs & Lows defined or 'Graded' on a fractal basis: Short-term, medium-term and long-term. Also applies 'Spikeyness' condition by default to filter-out weak/rounded pivots
ES1! 4hr chart (CME) shown above, with lookback = 15; clearly identifying the major highs & lows on the basis of how they are fractally 'nested' within lesser Pivots.
-- in the above chart Short term pivot highs (STH) are simply represented by green 'ʌ', and short-term pivot lows (STL) are simply represented by orange 'v'.
//Basics: (as applying to pivot highs, the following is reversed for pivot lows)
-Short term highs (STH) are simple pivot highs, albeit refined from standard with the 'spikeyness' filter.
-Medium-term highs (MTH) are defined as having a lower STH on either side of them.
-Long-term highs (LTH) are defined as having a lower MTH on either side of them.
//Purpose:
-Education: Quick and easy visualization of the strength or importance of a pivot high or low; a way of grading them based on their larger context.
-Backtesting: use in combination with other trading methods when backtesting to see the relative significance and price sensitivity of LTHs/LTLs compared to lower grade highs and lows.
//Settings:
-Choose Pivot lookback/lookforward bars: One setting, the basis from which all further pivot calculations are done.
-Toggle on/off 'Spikeyness' condition to filter-out weak/rounded/unimpressive pivot highs or lows (default is ON).
-Toggle on/off each of STH, MTH, LTH, STL, MTL, LTL; and choose label text-styles/colors/sizes independently.
-Set text Vertically, horizonally, or simply use 'ʌ' or 'v' symbols if you want to declutter your chart.
//Usage notes:
-Pivots take time to print (lookback bars must have elapsed before confirmation). Fractally nested pivots as here (i.e. a LTH), take even longer to print/confirm, so please be patient.
-Works across timeframes & Assets. Different timeframes may require slightly tweaked lookback/forward settings for optimal use; default is 15 bars.
Example usage with just symbolic labels short-term, med-term, long-term with 1x, 2x and 3x ʌ/v respectively:

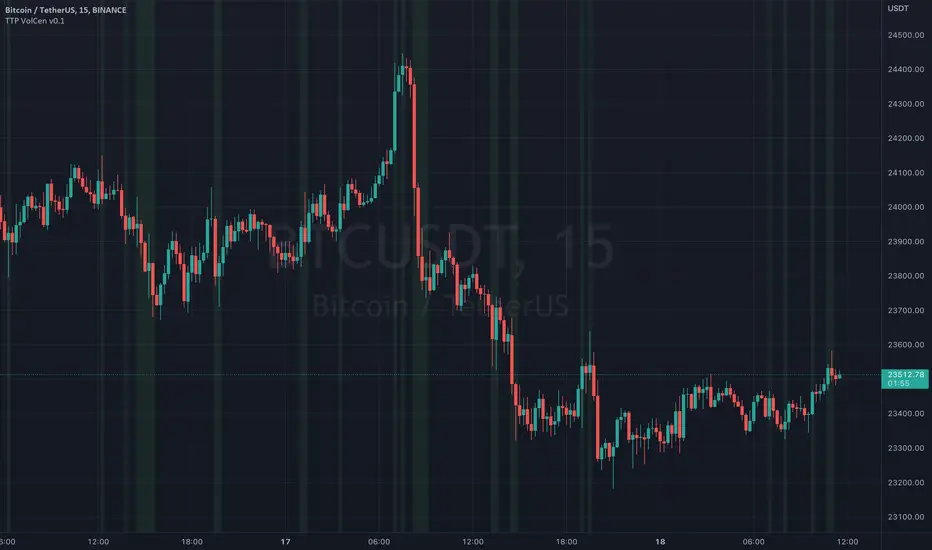
TTP Volume CSThis indicator helps you flagging areas where the volume is higher or lower than a moving average of the volume.
You can define a % threshold and whether you want the volume to be below or above the simple moving average of the volume.
The areas that are above the MA of the volume are shown in green and below in red.
Lookback parameter
This parameter allows you to check back in time for your condition. You can use it for reducing the noise of volume fluctuations
Examples of use:
- show areas where the volume is 20% above the SMA30 of the volume
- show areas where the volume is 40% below the SMA30 of the volume
Examples of trading ideas with this indicator:
- Areas of low volume can act as a reversal of the price.
- Areas where volume is too high as well.
- Trading in areas of low volume can affect the results when scalping
Ebb N Flo Trend [Signals]Ebb n Flo Trend is a trend indicator that makes use of higher time frame High - Low pivots to determine when a trend has changed
In order to reduce over trading, and to reduce fake outs, the script relies on a clever combination of Fib ratio expansions and an averaged candle close
By combining the above strategies, the trend indicator forms a trailing trend indicator
The script determines when the current market condition has crossed over or under the trailing trend, and based on the closing conditions will change the trend of the script signaling a change. If the trend indicator is below the current market and green, the trend is bullish. If the trend is above the market and red, the trend is bearish
The indicator does not repaint, as such, once a signal has been received, the condition has been met on a previous candle and is final
Trend indicator can be used on any markets, for both Long and Short swings, however is best suited for long term trading on certain crypto markets (based on backtesting results). Be on the lookout for pairs with decent volume on reputable exchanges. It is not a holy grail type script for all markets. The key is to find enough to diversify your trades.
As can be seen in the backtester results, the script performs exceptionally well when trading using the 1W higher time frame (selection in the script settings), in the 1D current time frame (selecting the chart time frame)
The script is ideal for the beginner trader that cannot spend hours everyday looking at charts.
The backtesting results are based on allocating 10% of your portfolio to a single trade - this should be determined by your risk appetite.
There are risks associated with any form of investing. Never invest more than you are willing to lose. Past performance is not a guarantee or predictor of future performance. Do your own due diligence before making any investment decisions.
Configuration:
The dropdown in the script selects the time frame for Highs and Lows that the script must consider, and the chart time frame is the time frame of which closing conditions the script should use
Alerts:
The indicator comes with 2 off alerts: open_LONG and open_SHORT, which in itself is self explanatory, however, due to the slow trading nature of the script, alerts are generally not needed
Once you receive access to the trial version, you will also receive a link to a video that will show you exactly how to set up the script
Happy trading

WhaleCrew VisionVision is an advanced momentum oscillator that visualizes momentum strength with overbought and oversold readings.
Features
Momentum Waves
Divergence Detection (regular and hidden divergences)
Detection for momentum shifts (detects higher lows/lower highs on the oscillator)
Detection for momentum stagnation
Moneyflow
Most important: Our Custom Strategy Builder
Custom Strategy Builder
The custom strategy builder is a framework that allows you to easily create custom strategies.
1. Configure long/short conditions
Pre-defined conditions for custom timeframes, under which you're looking to potentially enter a trade.
2. Configure trigger
Select a trigger (e.g. "Wave Cross" or "Wave Lower High") to generate labels/alerts for potential entries, whenever long/short conditions are met.
3. Configure Take Profit Conditions
Potential Take Profits are triggered by momentum stagnation.
4. Backtest your strategy
By using our open-source backtester script (published on our profile).
5. Trade responsibly
Manually review each signal/alert before taking any actions.
Note: The "Strategy Backtest" input section can also help you develop your strategy.
Usage
You can use this indicator to follow the trend, detect momentum shifts or memorize patterns.
Take a systematic approach by using our strategy builder.
Access to this indicator can be obtained through our website.

Kama Based Regressive Strategy for NIFTY : IndicatorThis is a Indicator Script for a Strategy which is backtested here
Background
I was pretty fascinated about the use of KAMA (Kaufman's Adaptive Moving Average) with non linear time-series, and my research about its realtime usage came out pretty good,
Kama if utilised correctly with a proper set of other indicators can give us non-repainting profitable strategies with a good unit(no. of trades) of backtest!
How i came up with this Strategy ?
One bright day, I and some of my friends were discussing over some of the quantitative measures, to minimise the risks in a trade by reentering and reverse entering at a very high frequency. After a lot of brain-storming that night I came to rescue some behaviours in KAMA, which made my day that day,
I came up with a strategy that would reenter and reverse enter any positions with core goal of getting into an efficient profitable frontier. I did some coding over return assessments and it showed very promising results for certain boundary and variable conditions, you just require a good trend-filter and a good boundary break condition, i coded the boundary break conditions with KAMA, and used a simple adaptive ATR for trend filtering.
Use of the above Strategy
We all know that all things cant be coded, you just have to start right, with a well backtested profitable strategy in trading.
The above strategy is a good start towards an analysis and alert generation for taking a good backtested-profitable lookup into a security, finding where it works and where it fails, final decision always lies in the hands of the trader,
I personally use such kind of strategies to generate alerts for me to take lookup into and get ready and prepared for any good trade that is coming.
Optimisation
This strategy is non-repainting and is optimised for Nifty 5 mins
With Provision For Alerts which are :
Buy Alert
Sell Alert
Buy Adder Alert
Sell Adder Alert
Trend Change Alert for Exit
How can i get Access
Right now access to the script is limited to few people and friends as it is experimental, and it is just for a demo purpose. Meanwhile if you want to have access just private message me, don't write any comment for the access since it is against the house rules of Tradingview, use comment-box only if you wanna add something!
At last Thanks to Tradingview for making such an awesome platform.

Megalodon
Why Megalodon?
We believe that enlightening others is an incredible way to make this world a better place. That's why we created the tools you need to stop worrying about your investments and focus on what really matters in your life.
What is Megalodon?
Megalodon uses Artificial Intelligence that combines 574 back-tested indicators and 2674 back-tested setups, simultaneously.
Megalodon works with any kind of asset , market state and time frame .
What is the win rate?
Megalodon is extremely accurate and offers insane profits as long as the fundamental analysis is done right .
Backtesting results can be found on our social media or down below .
How to use Megalodon Pro Automated Trader?
Simply, orange rectangles are buy signals and purple rectangles are sell signals .
Green clouds show buy signals and red clouds show sell signals.
Yellow line shows the difference between buy and sell counts.
How to set alarms on Megalodon Pro Automated Trader?
Click on Alert, select Megalodon Pro Automated Trader and click on Buy-Signal or Sell-Signal. More details can be found on our social media.
You may also watch our Megalodon Investing Tutorials on Youtube for more information.
How to purchase?
Megalodon is totally FREE .
You may upgrade to Megalodon Pro for the most important features , including automizing your trading on any asset profitably, setting up alarms to get notified , joining to our VIP telegram channel to get daily updates and our VIP telegram group to interact with the community. Simply go to our website on our TradingView page for learning more and joining us for free.
Some of the backtesting results are:
BTC/USD for longer time frame trading in the bear market for the last year.
APPLE for longer time frame trading in the bull market for the last 10 years.
EURO/USD for day trading in the neutral market for the last month.
BTC/USD for day trading in the bull market for the last 15 days.
APPLE for day trading in the neutral market for the last 2 days and 6 hours.
15 Minute Bitcoin Indicator 1.0Indicator Description:
This is a premium indicator that is intended for trading on the 15 minute time scale. This script uses ADX to judge the strength of trends. When a trend is confirmed by ADX, the indicator uses SRSI to find the optimal entry. The indicator works best on BITFINEX:BTCUSD .
Instructions:
Whenever there is a sell signal exit the current long and vice versa. If a close signal appears close the current position but do not open another trade in opposite direction. There is a indicator based stop loss system that is built into the signals, but no static stop loss based on % loss or pips moved in one direction.
Available Settings :
1. Buying and Selling Thresholds: These are the values that are used with SRSI to determine entries. The default values were experimentally determined
to be the most profitable.
2. Stacked Orders Allowed: This limits the amount of positions that can be entered in the same direction. This is useful for trading with leverage. This is defaulted to 2 because I limit myself to 2x leverage. Backtesting shows the more orders allowed, the more profitable, but also risk is increased.
3. ADX/DI Settings: These are settings the ADX smoothing and DI length.
Backtesting:
CLICK HERE
This is a strategy that enters and exits positions on the exact same criteria as this indicator. For the simulation the capital was 10,000 dollars and it was allowed to go up to 2x leverage. Each trade used 100% of available funds. The same simulation done from 1/1/2018 to 4/10/2018 resulted in:
3658.38 % Net Profit
316 Total Closed Trades
77.22 % Profitable
4.552 Profit Factor
24 % Max Drawdown
+11.58% Average Trade
20 15m candles in each trade on average.
Future Plans:
More robust stop loss system.
Factoring trend into trading signals.
EMA integration.
MULTI-TIMEFRAME SUPPORT
Availability
This indicator is currently in a testing stage of development with a full release planned for mid April. While the indicator is not completed, it currently is profitable for me to consider it ready for release. During this testing phase anyone can test it for free for three days, just comment below. Lifetime access currently costs .005 btc, and this price will increase once the full release occurs, if you are interested, DM me for further details.
Please comment with any ideas, suggestions, or criticisms.
0DTE Credit Spreads Indicator0DTE Credit Spreads Indicator
This indicator is designed to assist 0DTE credit spread traders by providing rule-based PCS (Put Credit Spread) and CCS (Call Credit Spread) signals, dynamic risk levels, and an integrated performance summary — all within a single, cohesive tool.
What the indicator does
The script implements a complete intraday framework tailored specifically to same-day expiration credit spreads, combining market structure, volatility context, and trade management logic into one workflow:
Opening Range logic (15-minute)
A defined opening range is used to establish directional bias. Signals are generated only after the range is confirmed, aligning entries with controlled intraday structure rather than momentum chasing.
Optional Early Entry logic
An optional early-entry mechanism evaluates 30-minute RSI extremes during the opening phase only. This is intentionally constrained to the opening window and designed for early premium capture scenarios common in 0DTE trading.
Volatility-aware credit estimation
Expected credit is derived from current volatility conditions to provide realistic assumptions for backtesting, trade visualization, and partial-profit modeling.
Dynamic risk visualization
Each signal automatically plots:
A horizontal stop-loss level
A take-profit level based on user-selected credit percentage
A dynamic diagonal stop line from entry to end-of-day, modeling time-based risk specific to 0DTE positions
Partial profit and contract modeling
The backtest logic supports closing a user-defined number of contracts at the take-profit level, while allowing remaining contracts to run to end-of-day or stop loss. This mirrors real-world 0DTE trade management practices.
Flexible evaluation modes
Trades can be evaluated using either:
Intraday stop-loss crosses, or
End-of-day outcome logic
allowing users to align results with their execution style.
Backtesting and transparency
The indicator includes a live, on-chart backtest table displaying:
PCS and CCS signal counts
Wins, losses, and win rate
Total P/L (points or dollar-based per contract)
Contract and partial-TP configuration
A non-blocking “Recommended context” note indicating whether the script is running on the preferred symbol and timeframe
Signals and visuals will display on any chart. The recommended context is informational only and does not restrict usage.
Chart presentation
Full visual mode with labels, TP/SL levels, and diagonal risk lines
Clean Chart mode with arrow-only signals and a compact summary table
Automatic object management to prevent chart clutter.
Intended use
This indicator is intended as a decision-support and research tool for experienced traders. It does not place trades, does not guarantee profitability, and should be used alongside proper risk management.

SUPERTREND VALIDADO ADX EMAS VWAP # Modular Trading System - SuperTrend + ADX + Multi-Filter Confirmation
## Overview
Professional modular trading system designed for trend-following strategies on 4H timeframes. Features a clean, mobile-optimized interface with customizable filters and real-time status monitoring.
## Core Features
### Validated Components (Backtested)
- **SuperTrend (ATR 10, Multiplier 3.0)**: Primary trend direction filter with visual fill
- **ADX >23**: Trend strength confirmation (14-period)
- Proven performance: 52.11% win rate, 3.162 profit factor over 4 years
### Additional Filters (Optional)
- **DI Spread >9**: Directional movement confirmation
- **Volume > EMA20**: Volume confirmation above 20-period average
- **EMA System**: 7/21/50 with dynamic coloring
- **VWAP**: Daily volume-weighted average price
### Visual Elements
- **SuperTrend Line**: Green (bullish) / Red (bearish) with background fill
- **EMA 7**: Yellow when ADX >23, White when ADX ≤23
- **EMA 21**: Green (price above) / Red (price below)
- **EMA 50**: Blue reference line
- **VWAP**: Orange line
- **PDH/PDL**: Previous day high/low levels
- **EMA Cross Signals**: Small dots marking 7/21 crossovers
### Smart Money Concepts
- Automatic Previous Day High (PDH) / Previous Day Low (PDL) tracking
- Horizontal lines extending from current price
- Clear labeling for support/resistance levels
## Status Dashboard
Compact 2-column table (top-right) shows:
```
FILTERS | STATUS
1. ADX >23 | 47.6 OK / 18.2 NO
2. DI Spread >9 | Bullish / Bearish
3. SuperTrend | Bullish / Bearish
4. Volume >EMA20 | 1.25x OK / 0.14x NO
─────────────────────────────
SIGNAL | BUY / SELL / WAIT
```
Color-coded backgrounds:
- Green: Condition met
- Red: Condition not met
- Yellow: Waiting for confirmation
## Signal Logic
### Entry Conditions
**LONG**: All active filters must align
- SuperTrend bullish (green)
- ADX >23
- DI+ > DI- (if DI Spread enabled)
- Volume > EMA20 (if Volume enabled)
- Price > EMA21 and EMA7 > EMA21 (if EMAs enabled)
**SHORT**: All active filters must align
- SuperTrend bearish (red)
- ADX >23
- DI- > DI+ (if DI Spread enabled)
- Volume > EMA20 (if Volume enabled)
- Price < EMA21 and EMA7 < EMA21 (if EMAs enabled)
### Exit Conditions
- SuperTrend direction change
- Clear "EXIT" markers on chart
### Position Management
- One position per trend (no pyramiding)
- Prevents multiple entries in same direction
- "WAIT" status when conditions partially met
## Settings & Customization
### Filters (Enable/Disable)
**Core Filters:**
- ✓ SuperTrend (VALIDATED)
- ✓ ADX >23 (VALIDATED)
**Additional Filters:**
- ⚠️ DI Spread >9 (EXPERIMENTAL)
- ⚠️ Volume > EMA20 (EXPERIMENTAL)
- ⚠️ EMAs 7/21/50 (EXPERIMENTAL)
**Visual:**
- Show EMA 7/21 Crosses (dots)
### Parameters
**SuperTrend:**
- ATR Period: 10 (default)
- ATR Multiplier: 3.0 (default)
**ADX/DI:**
- ADX Length: 14 (default)
- ADX Threshold: 23 (default)
- DI Spread Threshold: 9 (default)
**Volume:**
- Volume EMA: 20 (default)
**EMAs:**
- Fast EMA: 7 (default)
- Medium EMA: 21 (default)
- Slow EMA: 50 (default)
## Alerts
Pre-configured alerts for:
- Long Signal (BUY - Entry confirmed)
- Short Signal (SELL - Entry confirmed)
- Exit Long (EXIT LONG - SuperTrend changed)
- Exit Short (EXIT SHORT - SuperTrend changed)
- EMA Cross Up (EMA 7 crossed above EMA 21)
- EMA Cross Down (EMA 7 crossed below EMA 21)
## Best Practices
### Recommended Setup (Validated System)
```
Enable ONLY:
- SuperTrend: ON
- ADX >23: ON
- All other filters: OFF
```
### Testing New Filters
1. Enable experimental filters
2. Backtest thoroughly before live trading
3. Compare performance metrics
4. Validate with demo account first
### Timeframe
- Optimized for: 4H charts
- Tested on: Bitcoin/USDT
- Works on: Any trending instrument
## Risk Management
This indicator provides entry/exit signals but does NOT include:
- Stop loss levels
- Take profit targets
- Position sizing
Always use proper risk management:
- Maximum 1-2% risk per trade
- Use stop losses
- Follow your trading plan
## Performance Notes
**Validated Backtest Results (SuperTrend + ADX only):**
- Win Rate: 52.11%
- Profit Factor: 3.162
- Return: +45.46% (4 years)
- Tested Period: 2020-2024
- Instrument: BTC/USDT 4H
**Important:** Adding additional filters changes the system. Results may vary. Always backtest your specific configuration before live trading.
## Mobile Optimization
- Compact table design
- Clear color coding
- Minimal chart clutter
- Large signal text
- Optimized for small screens
## Use Cases
✅ **Ideal for:**
- Trend-following strategies
- Swing trading (4H timeframe)
- Clear market conditions
- Systematic traders
❌ **NOT ideal for:**
- Scalping (too slow)
- Range-bound markets
- Counter-trend strategies
- Lateral/choppy conditions
## Credits & Methodology
Based on proven technical analysis principles:
- SuperTrend (volatility-based trend following)
- ADX (trend strength measurement)
- Directional Indicators (DI+/DI-)
- Volume analysis
- EMA systems
**Designed for:** Disciplined execution over frequent trading
**Philosophy:** Quality setups > Quantity of trades
## Disclaimer
This indicator is for educational purposes only. Past performance does not guarantee future results. Always:
- Test on demo account first
- Use proper risk management
- Never risk more than you can afford to lose
- Consult a financial advisor
Trading involves substantial risk. This tool does not constitute financial advice.
---
## Version History
**v2.0 (Current)**
- Modular filter system
- 2-column compact status table
- EMA 7 dynamic coloring (yellow when ADX >23)
- EMA 50 + VWAP added
- PDH/PDL levels
- EMA cross markers
- Improved signal logic
- One position per trend
- Multiple alert conditions
---
**For support, updates, or feedback, contact the developer.**

IDLP – Intraday Daily Levels Pro [FXSMARTLAB]🔥 IDLP – Intraday Daily Levels Pro
IDLP – Intraday Daily Levels Pro is a precision toolkit for intraday traders who rely on objective daily structure instead of repainting indicators and noisy signals.
Every level plotted by IDLP is derived from one simple rule:
Today’s trading decisions must be based on completed market data only.
That means:
✅ No use of the current day’s unfinished data for levels
✅ No lookahead
✅ No hidden repaint behavior
IDLP reconstructs the previous trading day from the intraday chart and then projects that structure forward onto the current session, giving you a stable, institutional-style intraday map.
🧱 1. Previous Daily Levels (Core Structure)
IDLP extracts and displays the full previous daily structure, which you can toggle on/off individually via the inputs:
Previous Daily High (PDH)
Previous Daily Low (PDL)
Previous Daily Open
Previous Daily Close,
Previous Daily Mid (50% of the range)
Previous Daily Q1 (25% of the range)
Previous Daily Q3 (75% of the range)
All of these come from the day that just closed and are then locked for the entire current session.
What these levels tell you:
PDH / PDL – true extremes of yesterday’s price action (liquidity zones, breakout/reversal points).
Previous Daily Open / Close – how the market positioned itself between session start and end
Mid (50%) – equilibrium level of the previous day’s auction.
Q1 / Q3 (25% / 75%) internal structure of the previous day’s range, dividing it into four equal zones and helping you see if price is trading in the lower, middle, or upper quarter of yesterday’s range.
All these levels are non-repaint: once the day is completed, they are fixed and never change when you scroll, replay, or backtest.
🎯 2. Previous Day Pivot System (P, S1, S2, R1, R2)
IDLP includes a classic floor-trader pivot grid, but critically:
It is calculated only from the previous day’s high, low, and close.
So for the current session, the following are fixed:
Pivot P – central reference level of the previous day.
Support 1 (S1) and Support 2 (S2)
Resistance 1 (R1) and Resistance 2 (R2)
These levels are widely used by institutional desks and algos to structure:
mean-reversion plays, breakout zones, intraday targets, and risk placement.
Everything in this section is non-repaint because it only uses the previous day’s fully closed OHLC.
📏 3. 1-Day ADR Bands Around Previous Daily Open
Instead of a multi-day ADR, IDLP uses a pure 1-Day ADR logic:
ADR = Range of the previous day
ADR = PDH − PDL
From that, IDLP builds two clean bands centered around the previous daily Open:
ADR Upper Band = Previous Day Open + (ADR × Multiplier)
ADR Lower Band = Previous Day Open − (ADR × Multiplier)
The multiplier is user-controlled in the inputs:
ADR Multiplier (default: 0.8)
This lets you choose how “tight” or “wide” you want the ADR envelope to be around the previous day’s open.
Typical use cases:
Identify realistic intraday extension targets, Spot exhaustion moves beyond ADR bands, Frame reversals after reaching volatility extremes, Align trades with or against volatility expansion
Again, since ADR is calculated only from the completed previous day, these bands are totally non-repaint during the current session.
🔒 4. True Non-Repaint Architecture
The internal logic of IDLP is built to guarantee non-repaint behavior:
It reconstructs each day using time("D") and tracks:
dayOpen, dayHigh, dayLow, dayClose for the current day
prevDayOpen, prevDayHigh, prevDayLow, prevDayClose for the previous day
At the moment a new day starts:
The “current day” gets “frozen” into prevDay*
These prevDay* values then drive: Previous Daily Levels, Pivots, ADR.
During the current day:
All these “previous day” values stay fixed, no matter what happens.
They do not move in real time, they do not shift in replay.
This means:
What you see in the past is exactly what you would have seen live.
No fake backtests.
No illusion of perfection from repainting behavior.
🎯 5. Designed For Intraday Traders
IDLP – Intraday Daily Levels Pro is made for:
- Day traders and scalpers
- Index and FX traders
- Prop firm challenge trading
- Traders using ICT/SMC-style levels, liquidity, and range logic
- Anyone who wants a clean, institutional-style daily framework without noise
You get:
Previous Day OHLC
Mid / Q1 / Q3 of the previous range
Previous-Day Pivots (P, S1, S2, R1, R2)
1-Day ADR Bands around Previous Day Open
All calculated only from closed data, updated once per day, and then locked.

indicator CalibrationIndicator Calibration - Multi-Indicator Consensus System
Overview
Indicator Calibration is a powerful consensus-based trading indicator that leverages the MyIndicatorLibrary (NormalizedIndicators) to combine multiple trend-following indicators into a single, actionable signal. By averaging the normalized outputs of up to 8 different trend indicators, this tool provides traders with a clear consensus view of market direction, reducing noise and false signals inherent in single-indicator approaches.
The indicator outputs a value between -1 (strong bearish) and +1 (strong bullish), with 0 representing a neutral market state. This creates an intuitive, easy-to-read oscillator that synthesizes multiple analytical perspectives into one coherent signal.
🎯 Core Concept
Consensus Trading Philosophy
Rather than relying on a single indicator that may give conflicting or premature signals, Indicator Calibration employs a democratic voting system where multiple indicators contribute their normalized opinion:
Each enabled indicator votes: +1 (bullish), -1 (bearish), or 0 (neutral)
The votes are averaged to create a consensus signal
Strong consensus (closer to ±1) indicates high agreement among indicators
Weak consensus (closer to 0) indicates market indecision or transition
Key Benefits
Reduced False Signals: Multiple indicators must agree before strong signals appear
Noise Filtering: Individual indicator quirks are smoothed out by averaging
Customizable: Enable/disable indicators and adjust parameters to suit your trading style
Universal Application: Works across all timeframes and asset classes
Clear Visualization: Simple line oscillator with clear bull/bear zones
📊 Included Indicators
The system can utilize up to 8 normalized trend-following indicators from the library:
1. BBPct - Bollinger Bands Percent
Parameters: Length (default: 20), Factor (default: 2)
Type: Stationary oscillator
Strength: Mean reversion and volatility detection
2. NorosTrendRibbonEMA
Parameters: Length (default: 20)
Type: Non-stationary trend follower
Strength: Breakout detection with momentum confirmation
3. RSI - Relative Strength Index
Parameters: Length (default: 9), SMA Length (default: 4)
Type: Stationary momentum oscillator
Strength: Overbought/oversold with smoothing
4. Vidya - Variable Index Dynamic Average
Parameters: Length (default: 30), History Length (default: 9)
Type: Adaptive moving average
Strength: Volatility-adjusted trend following
5. HullSuite
Parameters: Length (default: 55), Multiplier (default: 1)
Type: Fast-response moving average
Strength: Low-lag trend identification
6. TrendContinuation
Parameters: MA Length 1 (default: 50), MA Length 2 (default: 25)
Type: Dual HMA system
Strength: Trend quality assessment with neutral states
7. LeonidasTrendFollowingSystem
Parameters: Short Length (default: 21), Key Length (default: 10)
Type: Dual EMA crossover
Strength: Simple, reliable trend tracking
8. TRAMA - Trend Regularity Adaptive Moving Average
Parameters: Length (default: 50)
Type: Adaptive trend follower
Strength: Adjusts to trend stability
⚙️ Input Parameters
Source Settings
Source: Choose your price input (default: close)
Can be modified to: open, high, low, close, hl2, hlc3, ohlc4, hlcc4
Indicator Selection
Each indicator can be enabled or disabled via checkboxes:
use_bbpct: Enable/disable Bollinger Bands Percent
use_noros: Enable/disable Noro's Trend Ribbon
use_rsi: Enable/disable RSI
use_vidya: Enable/disable VIDYA
use_hull: Enable/disable Hull Suite
use_trendcon: Enable/disable Trend Continuation
use_leonidas: Enable/disable Leonidas System
use_trama: Enable/disable TRAMA
Parameter Customization
Each indicator has its own parameter group where you can fine-tune:
val 1: Primary period/length parameter
val 2: Secondary parameter (multiplier, smoothing, etc.)
📈 Signal Interpretation
Output Line (Orange)
The main output oscillates between -1 and +1:
+1.0 to +0.5: Strong bullish consensus (all or most indicators agree on uptrend)
+0.5 to +0.2: Moderate bullish bias (bullish indicators outnumber bearish)
+0.2 to -0.2: Neutral zone (mixed signals or transition phase)
-0.2 to -0.5: Moderate bearish bias (bearish indicators outnumber bullish)
-0.5 to -1.0: Strong bearish consensus (all or most indicators agree on downtrend)
Reference Lines
Green line (+1): Maximum bullish consensus
Red line (-1): Maximum bearish consensus
Gray line (0): Neutral midpoint
💡 Trading Strategies
Strategy 1: Consensus Threshold Trading
Entry Rules:
- Long: Output crosses above +0.5 (strong bullish consensus)
- Short: Output crosses below -0.5 (strong bearish consensus)
Exit Rules:
- Exit Long: Output crosses below 0 (consensus lost)
- Exit Short: Output crosses above 0 (consensus lost)
Strategy 2: Zero-Line Crossover
Entry Rules:
- Long: Output crosses above 0 (bullish shift in consensus)
- Short: Output crosses below 0 (bearish shift in consensus)
Exit Rules:
- Exit on opposite crossover
Strategy 3: Divergence Trading
Look for divergences between:
- Price making higher highs while indicator makes lower highs (bearish divergence)
- Price making lower lows while indicator makes higher lows (bullish divergence)
Strategy 4: Extreme Reading Reversal
Entry Rules:
- Long: Output reaches -0.8 or below (extreme bearish consensus = potential reversal)
- Short: Output reaches +0.8 or above (extreme bullish consensus = potential reversal)
Use with caution - best combined with other reversal signals
🔧 Optimization Tips
For Trending Markets
Enable trend-following indicators: Noro's, VIDYA, Hull Suite, Leonidas
Use higher threshold levels (±0.6) to filter out minor retracements
Increase indicator periods for smoother signals
For Range-Bound Markets
Enable oscillators: BBPct, RSI
Use zero-line crossovers for entries
Decrease indicator periods for faster response
For Volatile Markets
Enable adaptive indicators: VIDYA, TRAMA
Use wider threshold levels to avoid whipsaws
Consider disabling fast indicators that may overreact
Custom Calibration Process
Start with all indicators enabled using default parameters
Backtest on your chosen timeframe and asset
Identify which indicators produce the most false signals
Disable or adjust parameters for problematic indicators
Test different threshold levels for entry/exit
Validate on out-of-sample data
📊 Visual Guide
Color Scheme
Orange Line: Main consensus output
Green Horizontal: Bullish extreme (+1)
Red Horizontal: Bearish extreme (-1)
Gray Horizontal: Neutral zone (0)
Reading the Chart
Line above 0: Net bullish sentiment
Line below 0: Net bearish sentiment
Line near extremes: Strong consensus
Line fluctuating near 0: Indecision or transition
Smooth line movement: Stable consensus
Erratic line movement: Conflicting signals
⚠️ Important Considerations
Lag Characteristics
This is a lagging indicator by design (consensus takes time to form)
Best used for trend confirmation rather than early entry
May miss the first portion of strong moves
Reduces false entries at the cost of delayed entries
Number of Active Indicators
More indicators = smoother but slower signals
Fewer indicators = faster but potentially noisier signals
Minimum recommended: 4 indicators for reliable consensus
Optimal: 6-8 indicators for balanced performance
Market Conditions
Best: Strong trending markets (up or down)
Good: Volatile markets with clear directional moves
Poor: Choppy, sideways markets with no clear trend
Worst: Low-volume, range-bound conditions
Complementary Tools
Consider combining with:
Volume analysis for confirmation
Support/resistance levels for entry/exit points
Market structure analysis (higher timeframe trends)
Risk management tools (ATR-based stops)
🎓 Example Use Cases
Swing Trading
Timeframe: Daily or 4H
Enable: All 8 indicators with default parameters
Entry: Consensus > +0.5 or < -0.5
Hold: Until consensus reverses to opposite extreme
Day Trading
Timeframe: 15m or 1H
Enable: Faster indicators (RSI, BBPct, Noro's, Hull Suite)
Entry: Zero-line crossover with volume confirmation
Exit: Opposite crossover or profit target
Position Trading
Timeframe: Weekly or Daily
Enable: Slower indicators (TRAMA, VIDYA, Trend Continuation)
Entry: Strong consensus (±0.7) with higher timeframe confirmation
Hold: Months until consensus weakens significantly
🔬 Technical Details
Calculation Method
1. Each enabled indicator calculates its normalized signal (-1, 0, or +1)
2. All active signals are stored in an array
3. Array.avg() computes the arithmetic mean
4. Result is plotted as a continuous line
Output Range
Theoretical: -1.0 to +1.0
Practical: Typically ranges between -0.8 to +0.8
Rare: All indicators perfectly aligned at ±1.0
Performance
Lightweight calculation (simple averaging)
No repainting (all indicators are non-repainting)
Compatible with all Pine Script features
Works on all TradingView plans
📋 License
This code is subject to the Mozilla Public License 2.0 at mozilla.org
🚀 Quick Start Guide
Add to Chart: Apply indicator to your chart
Choose Timeframe: Select appropriate timeframe for your trading style
Enable Indicators: Start with all 8 enabled
Observe Behavior: Watch how consensus forms during different market conditions
Calibrate: Adjust parameters and indicator selection based on observations
Backtest: Validate your settings on historical data
Trade: Apply with proper risk management
🎯 Key Takeaways
✅ Consensus beats individual indicators - Multiple perspectives reduce errors
✅ Customizable to your style - Enable/disable and tune to preference
✅ Simple interpretation - One line tells the story
✅ Works across markets - Stocks, crypto, forex, commodities
✅ Reduces emotional trading - Clear, objective signal generation
✅ Professional-grade - Built on proven technical analysis principles
Indicator Calibration transforms complex multi-indicator analysis into a single, actionable signal. By harnessing the collective wisdom of multiple proven trend-following systems, traders gain a powerful edge in identifying high-probability trade setups while filtering out market noise.
