Dual SMA/EMA BandsThe Dual SMA/EMA Bands indicator provides a clear view of market trends, combining Simple Moving Averages (SMA) and Exponential Moving Averages (EMA) in one customizable tool. Designed for any timeframe, it features Aqua and Purple Bands for 50-period and 200-period averages , respectively, aiding in trend analysis and volatility insights.
Features:
Adaptive Timeframes : Automatically aligns with the chart’s timeframe or can be manually set for cross-timeframe analysis.
Customization : Offers easy adjustments for colors, line thickness, and opacity to suit personal preferences and enhance readability.
Insights : Facilitates trend confirmation and volatility assessment, essential for informed trading decisions.
Usage Tips:
Use the bands to gauge market direction; above the bands suggests bullish conditions, below them indicates bearish trends.
The gap between EMA and SMA within each band can signal market volatility.
Apply customizable timeframes for a comprehensive market overview.
Conclusion:
With its straightforward setup and versatile application, the Dual SMA/EMA Bands indicator is a valuable tool for traders looking to deepen their market analysis and uncover trading opportunities.
Recherche dans les scripts pour "bands"

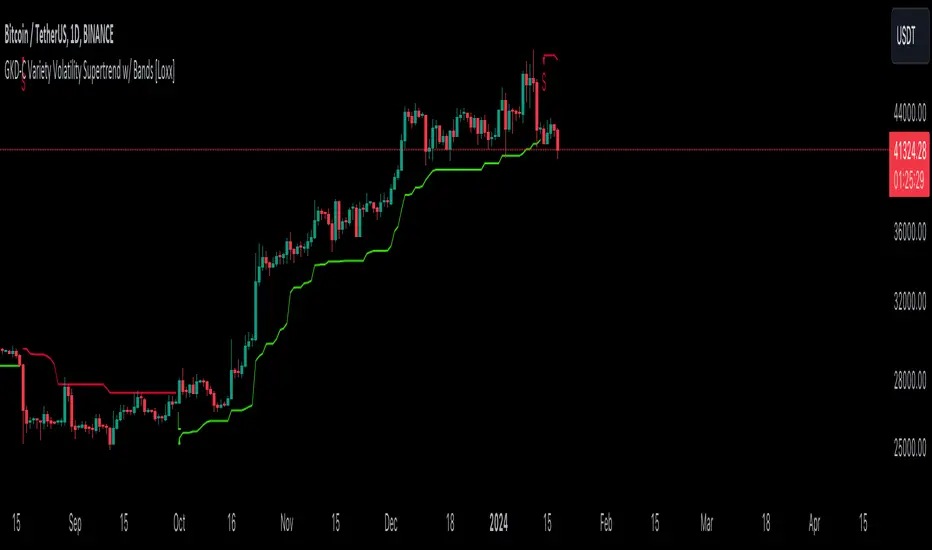
GKD-C Variety Volatility Supertrend w/ Bands [Loxx]The Giga Kaleidoscope GKD-C Variety Volatility Supertrend w/ Bands is a confirmation module included in Loxx's "Giga Kaleidoscope Modularized Trading System."
█ GKD-C Variety Volatility Supertrend w/ Bands
Variety Volatility Supertrend w/ Bands indicator is a powerful and highly customizable tool for traders. Building upon the foundational concept of the classic Supertrend indicator, this variant adds a plethora of user-driven options and features that can cater to diverse trading styles and market scenarios.
The Supertrend indicator is traditionally used to identify market trends by overlaying a line on the price chart, which changes color and position in relation to the price based on the trend direction. The Variety Volatility Supertrend w/ Bands takes this a step further by offering various volatility calculations, visual enhancements, explicit trading signals, and alert conditions.
It provides five options for volatility calculations, enabling users to select the most suitable measure for their strategy. This indicator also allows users to control the display of the upper, lower, and mid bands, which can serve as dynamic support and resistance levels. Further, it can display explicit trading signals when the trend changes direction and set up alerts for these signals.
█ Giga Kaleidoscope Modularized Trading System
Core components of an NNFX algorithmic trading strategy
The NNFX algorithm is built on the principles of trend, momentum, and volatility. There are six core components in the NNFX trading algorithm:
1. Volatility - price volatility; e.g., Average True Range, True Range Double, Close-to-Close, etc.
2. Baseline - a moving average to identify price trend
3. Confirmation 1 - a technical indicator used to identify trends
4. Confirmation 2 - a technical indicator used to identify trends
5. Continuation - a technical indicator used to identify trends
6. Volatility/Volume - a technical indicator used to identify volatility/volume breakouts/breakdown
7. Exit - a technical indicator used to determine when a trend is exhausted
8. Metamorphosis - a technical indicator that produces a compound signal from the combination of other GKD indicators*
*(not part of the NNFX algorithm)
What is Volatility in the NNFX trading system?
In the NNFX (No Nonsense Forex) trading system, ATR (Average True Range) is typically used to measure the volatility of an asset. It is used as a part of the system to help determine the appropriate stop loss and take profit levels for a trade. ATR is calculated by taking the average of the true range values over a specified period.
True range is calculated as the maximum of the following values:
-Current high minus the current low
-Absolute value of the current high minus the previous close
-Absolute value of the current low minus the previous close
ATR is a dynamic indicator that changes with changes in volatility. As volatility increases, the value of ATR increases, and as volatility decreases, the value of ATR decreases. By using ATR in NNFX system, traders can adjust their stop loss and take profit levels according to the volatility of the asset being traded. This helps to ensure that the trade is given enough room to move, while also minimizing potential losses.
Other types of volatility include True Range Double (TRD), Close-to-Close, and Garman-Klass
What is a Baseline indicator?
The baseline is essentially a moving average, and is used to determine the overall direction of the market.
The baseline in the NNFX system is used to filter out trades that are not in line with the long-term trend of the market. The baseline is plotted on the chart along with other indicators, such as the Moving Average (MA), the Relative Strength Index (RSI), and the Average True Range (ATR).
Trades are only taken when the price is in the same direction as the baseline. For example, if the baseline is sloping upwards, only long trades are taken, and if the baseline is sloping downwards, only short trades are taken. This approach helps to ensure that trades are in line with the overall trend of the market, and reduces the risk of entering trades that are likely to fail.
By using a baseline in the NNFX system, traders can have a clear reference point for determining the overall trend of the market, and can make more informed trading decisions. The baseline helps to filter out noise and false signals, and ensures that trades are taken in the direction of the long-term trend.
What is a Confirmation indicator?
Confirmation indicators are technical indicators that are used to confirm the signals generated by primary indicators. Primary indicators are the core indicators used in the NNFX system, such as the Average True Range (ATR), the Moving Average (MA), and the Relative Strength Index (RSI).
The purpose of the confirmation indicators is to reduce false signals and improve the accuracy of the trading system. They are designed to confirm the signals generated by the primary indicators by providing additional information about the strength and direction of the trend.
Some examples of confirmation indicators that may be used in the NNFX system include the Bollinger Bands, the MACD (Moving Average Convergence Divergence), and the MACD Oscillator. These indicators can provide information about the volatility, momentum, and trend strength of the market, and can be used to confirm the signals generated by the primary indicators.
In the NNFX system, confirmation indicators are used in combination with primary indicators and other filters to create a trading system that is robust and reliable. By using multiple indicators to confirm trading signals, the system aims to reduce the risk of false signals and improve the overall profitability of the trades.
What is a Continuation indicator?
In the NNFX (No Nonsense Forex) trading system, a continuation indicator is a technical indicator that is used to confirm a current trend and predict that the trend is likely to continue in the same direction. A continuation indicator is typically used in conjunction with other indicators in the system, such as a baseline indicator, to provide a comprehensive trading strategy.
What is a Volatility/Volume indicator?
Volume indicators, such as the On Balance Volume (OBV), the Chaikin Money Flow (CMF), or the Volume Price Trend (VPT), are used to measure the amount of buying and selling activity in a market. They are based on the trading volume of the market, and can provide information about the strength of the trend. In the NNFX system, volume indicators are used to confirm trading signals generated by the Moving Average and the Relative Strength Index. Volatility indicators include Average Direction Index, Waddah Attar, and Volatility Ratio. In the NNFX trading system, volatility is a proxy for volume and vice versa.
By using volume indicators as confirmation tools, the NNFX trading system aims to reduce the risk of false signals and improve the overall profitability of trades. These indicators can provide additional information about the market that is not captured by the primary indicators, and can help traders to make more informed trading decisions. In addition, volume indicators can be used to identify potential changes in market trends and to confirm the strength of price movements.
What is an Exit indicator?
The exit indicator is used in conjunction with other indicators in the system, such as the Moving Average (MA), the Relative Strength Index (RSI), and the Average True Range (ATR), to provide a comprehensive trading strategy.
The exit indicator in the NNFX system can be any technical indicator that is deemed effective at identifying optimal exit points. Examples of exit indicators that are commonly used include the Parabolic SAR, and the Average Directional Index (ADX).
The purpose of the exit indicator is to identify when a trend is likely to reverse or when the market conditions have changed, signaling the need to exit a trade. By using an exit indicator, traders can manage their risk and prevent significant losses.
In the NNFX system, the exit indicator is used in conjunction with a stop loss and a take profit order to maximize profits and minimize losses. The stop loss order is used to limit the amount of loss that can be incurred if the trade goes against the trader, while the take profit order is used to lock in profits when the trade is moving in the trader's favor.
Overall, the use of an exit indicator in the NNFX trading system is an important component of a comprehensive trading strategy. It allows traders to manage their risk effectively and improve the profitability of their trades by exiting at the right time.
What is an Metamorphosis indicator?
The concept of a metamorphosis indicator involves the integration of two or more GKD indicators to generate a compound signal. This is achieved by evaluating the accuracy of each indicator and selecting the signal from the indicator with the highest accuracy. As an illustration, let's consider a scenario where we calculate the accuracy of 10 indicators and choose the signal from the indicator that demonstrates the highest accuracy.
The resulting output from the metamorphosis indicator can then be utilized in a GKD-BT backtest by occupying a slot that aligns with the purpose of the metamorphosis indicator. The slot can be a GKD-B, GKD-C, or GKD-E slot, depending on the specific requirements and objectives of the indicator. This allows for seamless integration and utilization of the compound signal within the GKD-BT framework.
How does Loxx's GKD (Giga Kaleidoscope Modularized Trading System) implement the NNFX algorithm outlined above?
Loxx's GKD v2.0 system has five types of modules (indicators/strategies). These modules are:
1. GKD-BT - Backtesting module (Volatility, Number 1 in the NNFX algorithm)
2. GKD-B - Baseline module (Baseline and Volatility/Volume, Numbers 1 and 2 in the NNFX algorithm)
3. GKD-C - Confirmation 1/2 and Continuation module (Confirmation 1/2 and Continuation, Numbers 3, 4, and 5 in the NNFX algorithm)
4. GKD-V - Volatility/Volume module (Confirmation 1/2, Number 6 in the NNFX algorithm)
5. GKD-E - Exit module (Exit, Number 7 in the NNFX algorithm)
6. GKD-M - Metamorphosis module (Metamorphosis, Number 8 in the NNFX algorithm, but not part of the NNFX algorithm)
(additional module types will added in future releases)
Each module interacts with every module by passing data to A backtest module wherein the various components of the GKD system are combined to create a trading signal.
That is, the Baseline indicator passes its data to Volatility/Volume. The Volatility/Volume indicator passes its values to the Confirmation 1 indicator. The Confirmation 1 indicator passes its values to the Confirmation 2 indicator. The Confirmation 2 indicator passes its values to the Continuation indicator. The Continuation indicator passes its values to the Exit indicator, and finally, the Exit indicator passes its values to the Backtest strategy.
This chaining of indicators requires that each module conform to Loxx's GKD protocol, therefore allowing for the testing of every possible combination of technical indicators that make up the six components of the NNFX algorithm.
What does the application of the GKD trading system look like?
Example trading system:
Backtest: Multi-Ticker CC Backtest
Baseline: Hull Moving Average
Volatility/Volume: Hurst Exponent
Confirmation 1: Advance Trend Pressure as shown on the chart above
Confirmation 2: uf2018
Continuation: Coppock Curve
Exit: Rex Oscillator
Metamorphosis: Baseline Optimizer
Each GKD indicator is denoted with a module identifier of either: GKD-BT, GKD-B, GKD-C, GKD-V, GKD-M, or GKD-E. This allows traders to understand to which module each indicator belongs and where each indicator fits into the GKD system.
? Giga Kaleidoscope Modularized Trading System Signals
Standard Entry
1. GKD-C Confirmation gives signal
2. Baseline agrees
3. Price inside Goldie Locks Zone Minimum
4. Price inside Goldie Locks Zone Maximum
5. Confirmation 2 agrees
6. Volatility/Volume agrees
1-Candle Standard Entry
1a. GKD-C Confirmation gives signal
2a. Baseline agrees
3a. Price inside Goldie Locks Zone Minimum
4a. Price inside Goldie Locks Zone Maximum
Next Candle
1b. Price retraced
2b. Baseline agrees
3b. Confirmation 1 agrees
4b. Confirmation 2 agrees
5b. Volatility/Volume agrees
Baseline Entry
1. GKD-B Baseline gives signal
2. Confirmation 1 agrees
3. Price inside Goldie Locks Zone Minimum
4. Price inside Goldie Locks Zone Maximum
5. Confirmation 2 agrees
6. Volatility/Volume agrees
7. Confirmation 1 signal was less than 'Maximum Allowable PSBC Bars Back' prior
1-Candle Baseline Entry
1a. GKD-B Baseline gives signal
2a. Confirmation 1 agrees
3a. Price inside Goldie Locks Zone Minimum
4a. Price inside Goldie Locks Zone Maximum
5a. Confirmation 1 signal was less than 'Maximum Allowable PSBC Bars Back' prior
Next Candle
1b. Price retraced
2b. Baseline agrees
3b. Confirmation 1 agrees
4b. Confirmation 2 agrees
5b. Volatility/Volume agrees
Volatility/Volume Entry
1. GKD-V Volatility/Volume gives signal
2. Confirmation 1 agrees
3. Price inside Goldie Locks Zone Minimum
4. Price inside Goldie Locks Zone Maximum
5. Confirmation 2 agrees
6. Baseline agrees
7. Confirmation 1 signal was less than 7 candles prior
1-Candle Volatility/Volume Entry
1a. GKD-V Volatility/Volume gives signal
2a. Confirmation 1 agrees
3a. Price inside Goldie Locks Zone Minimum
4a. Price inside Goldie Locks Zone Maximum
5a. Confirmation 1 signal was less than 'Maximum Allowable PSVVC Bars Back' prior
Next Candle
1b. Price retraced
2b. Volatility/Volume agrees
3b. Confirmation 1 agrees
4b. Confirmation 2 agrees
5b. Baseline agrees
Confirmation 2 Entry
1. GKD-C Confirmation 2 gives signal
2. Confirmation 1 agrees
3. Price inside Goldie Locks Zone Minimum
4. Price inside Goldie Locks Zone Maximum
5. Volatility/Volume agrees
6. Baseline agrees
7. Confirmation 1 signal was less than 7 candles prior
1-Candle Confirmation 2 Entry
1a. GKD-C Confirmation 2 gives signal
2a. Confirmation 1 agrees
3a. Price inside Goldie Locks Zone Minimum
4a. Price inside Goldie Locks Zone Maximum
5a. Confirmation 1 signal was less than 'Maximum Allowable PSC2C Bars Back' prior
Next Candle
1b. Price retraced
2b. Confirmation 2 agrees
3b. Confirmation 1 agrees
4b. Volatility/Volume agrees
5b. Baseline agrees
PullBack Entry
1a. GKD-B Baseline gives signal
2a. Confirmation 1 agrees
3a. Price is beyond 1.0x Volatility of Baseline
Next Candle
1b. Price inside Goldie Locks Zone Minimum
2b. Price inside Goldie Locks Zone Maximum
3b. Confirmation 1 agrees
4b. Confirmation 2 agrees
5b. Volatility/Volume agrees
Continuation Entry
1. Standard Entry, 1-Candle Standard Entry, Baseline Entry, 1-Candle Baseline Entry, Volatility/Volume Entry, 1-Candle Volatility/Volume Entry, Confirmation 2 Entry, 1-Candle Confirmation 2 Entry, or Pullback entry triggered previously
2. Baseline hasn't crossed since entry signal trigger
4. Confirmation 1 agrees
5. Baseline agrees
6. Confirmation 2 agrees
Average Trend with Deviation Bands v2TL;DR: An average based trend incl. micro trend spotting and multiple display options.
This script is basically an update of my "Average Trend with Deviation Bands" script. I made the following changes:
Not an overlay anymore - The amount of drawn lines makes the chart pretty messy. That's why I moved it to a pane. If you preferred the overlay you can use my "Average Trend with Deviation Bands" script. *This is also the reason why I publish this script instead of updating the existing one.
I added an EMA to represent the price movement instead of candles
I added a signal (SMA) to spot micro trends and early entry/exit signals
I added the option to switch between a "line view" which shows the average trend and deviation bands and an "oscillator view" which shows an oscillator and histogram (MACD style)
General usage:
1. The white line is the average trend (which is an average of the last N bars open, close, high, low price).
2. Bands around the average trend are standard deviations which can be adjusted in the options menu and are only visible in "lines view". Basically they are like the clouds in the Ichimoku Cloud indicator - In big deviation bands the price movement needs more "power" to break through the average trend and vice versa.
3. Indicator line (blue line) - This is the EMA which represents the price. Crossing the average trend from below indicates an uptrend and vice versa (crossing from above indicates a down trend).
4. Signal line (red line) - This is a smoothed version of the indicator line which can be used to predict the movement of the price when crossed by the indicator line (like at MACD and many other indicators).
Oscillator usage:
When switched to "oscillator view" the indicator line oscillates around a zero line which can be seen as the average trend. The usage is basically the same as described above. However there is also the histogram which shows the difference between the indicator and signal. Of course the histogram can be deactivated. Additionally a color filling can be added to easily spot entry/exit signals.
As always: Code is free do whatever you like. If you have any questions/comments/etc. just drop it in the comment section.

Galactic Bollinger Bands Envelope (GBBE)The Galactic Bollinger Bands Envelope (GBBE) is a technical indicator that is used to identify potential areas of support and resistance in a trading instrument's price. The GBBE indicator is similar to the traditional Bollinger Bands (BB) indicator but offers certain advantages and improvements over the standard BB indicator.
The GBBE indicator is based on a similar concept to the BB indicator, where the bands are plotted around a moving average of the price. However, the GBBE indicator uses a more sophisticated calculation that accounts for the volatility of the instrument being analyzed. The GBBE indicator is designed to adjust to changing market conditions and provide more accurate signals.
One of the key strengths of the GBBE indicator is that it offers a clearer signal for traders to identify potential buy and sell opportunities. This is because the GBBE indicator has a tighter range compared to the standard BB indicator, which can sometimes generate false signals due to the wider range.
The GBBE indicator also has the advantage of being more responsive to sudden price movements, which makes it particularly useful for short-term traders who need to make quick decisions. The GBBE indicator is able to adjust to sudden market changes, which means that traders are less likely to miss out on trading opportunities.
Another advantage of the GBBE indicator is that it can be customized to suit individual trading styles and preferences. Traders can adjust the input parameters of the GBBE indicator, such as the length of the moving average and the multiplier, to optimize the indicator for different market conditions.
In conclusion, the Galactic Bollinger Bands Envelope (GBBE) is a powerful technical indicator that offers several advantages over the standard Bollinger Bands (BB) indicator. The GBBE indicator is designed to be more responsive and accurate, which makes it particularly useful for short-term traders. The GBBE indicator also offers traders more flexibility to customize the indicator to suit individual trading styles and preferences. Overall, the GBBE indicator is a valuable tool for traders looking to identify potential buy and sell opportunities in the markets.

Keltner Channels Bands (RMA)Keltner Channel Bands
These normally consist of:
Keltner Channel Upper Band = EMA + Multiplier ∗ ATR
Keltner Channel Lower Band = EMA − Multiplier ∗ ATR
However instead of using ATR we are using RMA
This gives us a much smoother take of the KCB
We are also using 2 sets of bands built on 1 Moving average, this is a common set up for mean reversion strategies.
This can often be paired with RSI for lower timeframe divergences
Divergence
This is using the RSI to calculate when price sets new lows/highs whilst the RSI movement is in the opposite direction.
The way this is calculated is slightly different to traditional divergence scripts. instead of looking for pivot highs/lows in the RSI we are logging the RSI value when price makes it pivot highs/lows.
Gradient Bands
The Gradient Colouring on the bands is measuring how long price has been either side of the MA.
As Keltner bands are commonly used as a mean reversion strategy, I thought it would be useful to see how long price has been trending in a certain direction, the stronger the colours get,
the longer price has been trending that direction which could suggest we are looking for a retrace soon.
Alerts
Alerts included let you choose whether you want to receive an alert for the inside, outside or both band touches.
To set up these alerts, simply toggle them on in the settings, then click on the 3 dots next to the indicators name, from there you click 'Add Alert'.
From there you can customise the alert settings but make sure to leave the 2 top boxes which control the alert conditions. They will be default selected onto your correct settings, the rest you may want to change.
Once you create the alert, it will then trigger as soon as price touches your chosen inside/outside band.
Suggestions
Please feel free to offer any suggestions which you think could improve the script
Disclaimer
The default settings/parameters were shared by Jimtalbott, feel free to play about with the and use this code to make your own strategies.

Squeeze Range: Bollinger Bands / Keltner Channels [Whvntr]Presenting Squeeze Range: Bollinger Bands / Keltner Channels
TTMSqueeze method is a volatility and momentum indicator introduced by John Carter of Simpler Trading, which capitalizes on the tendency for price to break out strongly after consolidating in a tight trading range.
How did I make this indicator? The Bollinger Bands & Keltner Channels base scripts are from the standard indicators of their class in the Technicals section... I made this indicator first then noticed there were 3 others with a similar concept, but this differs in it's unique features and application of the TTMSqueeze strategy. This indicator plots the True Range of the Keltner Channel (Customizable in 'Bands Style" in the Inputs Menu) the instances the Bollinger Bands are within the range of the Keltner channel (the market just entered a squeeze).
Featuring: customizable Moving Averages
1. Exponential (Default for both BB & KC)
2. Simple
3. RMA (MA used in RSI )
Keltner channels have a multiplier of 2 & 3 on the Chart (3 being the outer).
How do I use this indicator? Once the teal dots are inside the solid red lines this would indicate that TTMperiod of low market volatility (the market is preparing itself for an explosive move up or down). Do some research and study how to use the TTMSqueeze method by John Carter. Disclaimer: not a guarantee of future favorable results.

Cuban's Reversion Bands V2Cuban's Reversion Bands V2
Cubans Reversion Bands, are a great indication of price overextension by using specified standard deviations, extended from a moving average basis line, the Volume Weighted Average Trend.
Reversion Bands V2 builds off the original foundation in a big way but utilizes completely new band logic and a more stable basis line, the stability leads to a more consistent band reversion zones.
The basis line is calculated with volatility metrics and long term range determinants.
The band extension points are then weighted on this basis line with the asset's average extensions taken into consideration to fit each asset individually.
Users gain the ability to customize:
EQ Sensitivity
Band Sensitivity
EQ sensitivity will control the reaction time of the basis line e.g. a comparison of the default 1, and below an increase EQ to 100:
1 EQ Sensitivity (Default)
100 EQ Sensitivity
Band Sensitivity will control the distance of deviation from the basis point, this can be used to fine tune the reversion location which could be useful in higher beta environments.
1 Band Sensitivity
100 Band Sensitivity
As a result of overextension we can take this as a means for a potential market shift, for example, in range bound conditions we expect the market to revert at the given reversion zones in the Cuban Reversion Bands V2.
Failure to revert at a band level, and extension above could signify a change in market structure and lead to a trending environment thus giving us the ability to determine a trending environment.
To Do:
alerts
implement additional confluence via other proprietary tools to increase the signal ratio
Volume Weighted Reversal BandsThis is a vwap & vwma hybrid with upper & lower deviation bands that provide excellent price channels and reversal areas. It can be used on lower & higher timeframes, just increase the deviation % for higher timeframes. Try out the 1 minute timeframe with .5% deviation for great scalping levels.
Here is the calculation used for the main line.
(VWMA100 + VWMA500 + VWMA1000 + VWAP) / 4
So it combines 3 VWMAs with the VWAP and divides that number by 4 to give us a moving average. Then we add new levels above and below that moving average to get our channels. The channels are separated by the % deviation you choose in the settings. For tighter bands, lower the percentage deviation and for wider bands, increase the percentage deviation.
The fattest line in the middle is the main moving average and you can expect price to regularly return to this level. The thick lines are the main moving average plus or minus the percentage deviation you have set. There are 10 levels in each direction from the main moving average. The is also a thin short term moving average as well with a custom calculation. It takes 4 different length moving averages that are weighted and 4 more that are volume weighted and divides the total by 8.The lines will be green when price is above the line and red when price is below the line. The thin white line is the VWAP on its own.
These lines will act as dynamic support and resistance so you can scalp them back and forth. These levels work so well because they are volume weighted and the algos hedge their positions back and forth constantly.
For best results, use this indicator on tickers with the highest volume and trading action as the price will stick to these levels better when the big money players are hedging. Some great tickers for this indicator are APPL, SPY, BTC, ETH.
All colors and linewidths can be customized in the settings easily as well as turning off the VWAP or short moving average and adjusting the percentage deviation for the channels.
***MARKETS***
This indicator can be used on all markets, including stocks, crypto, futures and forex.
***TIMEFRAMES***
This indicator can be used on all timeframes.
***TIPS***
Try using numerous indicators of ours on your chart for extra confirmation. Our favorites to pair with these bands are the Scalper Ribbon and Trend Friend Signals. The 3 combined give you a lot of extra confirmation on whether the market is going to reverse at these levels.

Roger & Satchell Estimator Historical Volatility Bands [Loxx]Roger & Satchell Estimator Historical Volatility Bands are constructed using:
Average as the middle line.
Upper and lower bands using theRoger & Satchell Estimator Historical Volatility Bands for bands calculation.
What is Roger & Satchell Estimator Historical Volatility?
The Rogers–Satchell estimator does not handle opening jumps; therefore, it underestimates the volatility. It accurately explains the volatility portion that can be attributed entirely to a trend in the price evolution. Rogers and Satchell try to embody the frequency of price observations in the model in order to overcome the drawback. They claim that the corrected estimator outperforms the uncorrected one in a study based on simulated data.
RSEHV = sqrt((Z/n) * sum((log(high/close)*log(high/open)) + (log(low/close)*log(low/open))))
The color of the middle line, unlike the bands colors, has 3 colors. When colors of the bands are the same, then the middle line has the same color, otherwise it's white.
Included
Alerts
Signals
Loxx's Expanded Source Types
Bar coloring
Parkinson's Historical Volatility Bands [Loxx]Parkinson's Historical Volatility Bands are constructed using:
Average as the middle line.
Upper and lower bands using the Parkinson's historical volatility (instead of "regular" Historical Volatility) for bands calculation.
What is Parkinson's Historical Volatility?
The Parkinson's number, or High Low Range Volatility developed by the physicist, Michael Parkinson in 1980, aims to estimate the Volatility of returns for a random walk using the High and Low in any particular period. IVolatility.com calculates daily Parkinson values. Prices are observed on a fixed time interval: n = 10, 20, 30, 60, 90, 120, 150, 180 days.
SH is stock's High price in t day.
SL is stock's Low price in t day.
High/Low Return (xt^HL) is calculated as the natural logarithm of the ratio of a stock's High price to stock's Low price.
Return:
And Parkinson's number: 1 / (4 * math.log(2)) * 252 / n * Σ (n, t =1) {math.log(Ht/Lt)^2}
An important use of the Parkinson's number is the assessment of the distribution prices during the day as well as a better understanding of the market dynamics. Comparing the Parkinson's number and periodically sampled volatility helps traders understand the tendency towards mean reversion in the market as well as the distribution of stop-losses.
The color of the middle line, unlike the bands colors, has 3 colors. When colors of the bands are the same, then the middle line has the same color, otherwise it's white.
Included
Alerts
Signals
Loxx's Expanded Source Types
Bar coloring

Bermaui Variety Averages Bands [Loxx]Bermaui Variety Averages Bands is a reverse Bollinger Bands indicator with Loxx's Variety Moving Averages and Loxx's Expanded Source Types.
What are Bermaui Bands?
Bermaui Bands (BB) is a technical analysis tool that help filter between ranging and trending price movements. A buy signal is made when price crosses above the upper band, a sell signal is made when price crosses below the bottom band. The idea is when the bands are far apart, this is low volatility; when the bands are close together, this is high volatility.
Included
Loxx's Expanded Source Types
Loxx's Moving Averages
Alerts
Signals

Bollinger Bands Breakout Oscillator [LuxAlgo]The Bollinger Bands Breakout Oscillator is an oscillator returning two series quantifying the significance of breakouts between the price and the extremities of the Bollinger Bands indicator.
Settings
Length: Period of the Bollinger Bands indicator
Mult: Controls the width of the Bollinger Bands
Src: Input source of the indicator
Usage
Each series is calculated by summing the distance between price and a respective Bollinger Bands extremity in the case price is outside this extremity and divided by the sum of the absolute distance between price and a respective extremity. This sum is done over the most recent Length bars.
Bullish breakouts are represented by the green areas of the indicator, while bearish breakouts are represented by the red areas of the indicator.
The oscillator can determine the presence of an uptrend when the bullish area is superior to the bearish area, while a downtrend is indicated by a bearish area being superior to the bullish one. The significance of the breakout is determined by the amplitude of each area, with higher amplitudes indicating more significant breakouts or strong trends.
Using higher Mult values would naturally return wider bands, which would induce less frequent breakouts, this would be highlighted by the oscillator.
In the chart above we can see the oscillator using a multiplicative factor of 2.

Oasis Trading Group Market Making Bot - Mean Reversion BandsThe OTG Market Making Bot was designed with mean reversion trading in mind. It uses advanced ATR and other volatility formulas to create a set of bands that price should stay within. If price is testing the upper or lower bands then it is "extended" and a mean reversion back to the midline is likely.
The indicator comes with two sets of reversion bands, by default they are set to two and three standard deviations away from the midline, these can be changed to your preference. The indicator will give you Buy and Sell arrows if the conditions are being met. The conditions can be as simple as price hitting the bands or with certain filters, the filters are as follows:
Volatility Filter: Based on your settings it will look at the Current ATR vs Historic ATR Average if the Current ATR is higher than the average it will not show the mean reversion Buy/Sell signals because the volatility is too high. This filter can be turned on and off in the settings.
Trend Filter: Based on your settings it will lookback a certain amount of candles to see if the current price action is ranging or trending. If the current price action is determined to be trending it will not show the mean reversion Buy/Sell signals because it wants to trade within a range. This filter cannot be turned off in the settings, but if you wish to see all the Mean Reversion Buy/Sell signals without any filters you can turn them on in the style settings.
Midline: The midline is color coded based on your Trend Lookback settings. If it determines that the market is ranging it will be colored Green, if it determines that the market is trending it will be colored Red. Green means you are safe to take Mean Reversion trades.
The indicator comes with multiple alerts for all the different Buy/Sell signals. These signals can come from the first set of bands, second set, or unfiltered.
This indicator is designed to be paired with the ATR Improved Indicator I have created which is open source, it can be found here.
Also, paired with the OTG Automated Trading Bot. The OTG Trading Bot is a trend following bot, it excels in trend trading but fails in range trading. This Mean Reversion bot was designed to compliment the OTG Bot perfectly.
The Oasis Trading Group Market Making Bot will be available as a free add-on to all OTG Trading Bot users.
If you have any questions feel free to let me know in the comments or DM me.

[iQ]PRO Grand Unified Theory Bands+PRO Grand Unified Theory Bands+ (GUT+)
Welcome to the pinnacle of market state analysis. The PRO Grand Unified Theory Bands+ is not just an indicator; it is a multi-dimensional analytical engine designed to synthesize complex mathematical disciplines into a singular, actionable visual interface.
By merging Quantum Signal Processing, Chaos Theory, and Adaptive Cycles, this tool provides a high-fidelity view of market structure that remains invisible to standard retail indicators.
### The Science of Precision
The GUT+ framework operates on a proprietary sequence of six specialized computational layers, ensuring that every signal is filtered for noise and synchronized with the current market rhythm.
Non-Linear Time Warping: Utilizing advanced Laguerre geometry to smooth price action without the catastrophic lag associated with traditional moving averages.
Haar Wavelet Decomposition: We strip away the "market noise" using multi-level wavelet transforms, isolating the core trend from chaotic price fluctuations.
Discrete Fourier Analysis (DFT): The system continuously scans for the dominant market cycle, ensuring the bands expand and contract based on real-time frequency rather than static lookback periods.
State Estimation (Kalman Physics): An adaptive tracking algorithm that predicts the most likely "true" price position by minimizing the recursive variance between signal and noise.
Feigenbaum Bifurcation Logic: Derived from Chaos Theory, our volatility bands use universal constants to identify "bifurcation points"—critical levels where price is mathematically forced to make a directional decision.
MESA Adaptive Engine: Incorporating Hilbert Transforms and MAMA/FAMA logic to track phase transitions, allowing the tool to distinguish between trending and cyclical market environments.
### Key Features & Visual Intelligence
PRO GUT+ translates complex data into a simplified color-coded system, allowing you to read the market state at a glance:
Visual Element Market Interpretation
Golden Yellow Zone Strong Bullish Expansion: Momentum and Trend are perfectly aligned.
Electric Fuchsia Zone Strong Bearish Contraction: Aggressive selling pressure is dominant.
Deep Sea Blue Reversal/Retracement Warning: Systems are diverging; a trend shift is imminent.
Neon Green Flash Breakout Pending: Volatility is compressed to a critical threshold (The "Squeeze").
Circles (Bifurcation) Mathematical Extremes: High-probability exhaustion points.
⚡ Unified Signal Logic
The "Unified Buy/Sell" labels represent the rare alignment of the Laguerre Smoothing, MESA Phase Analysis, and Fourier Cycle Alignment. When these systems reach confluence, the indicator identifies high-conviction entry and exit zones.
### The PRO Data Suite
The real-time dashboard (top right) provides a deep-dive into the current "DNA" of the asset, including:
Dominant Fourier Cycle: The current rhythmic heartbeat of the market.
MESA/Hilbert Periods: Real-time cycle length for adaptive precision.
Market State Engine: A proprietary classification (Neutral, Strong Bull, Breakout Ready, etc.) powered by our internal logic.
### Usage & Access
This tool is part of the MarketMakerIQ Professional Suite. It is designed for traders who require institutional-grade data processing to stay ahead of retail lag.
Optimized For: All timeframes (Scalping to Position Trading).
Asset Classes: Forex, Crypto, Indices, and Equities.
Access: This is a Closed-Source, Invite-Only script.
Note: To maintain the integrity of our proprietary models and prevent market saturation, access is restricted to authorized members of MarketMakerIQ.

Adaptive 2-Pole Trend Bands [supfabio]Adaptive 2-Pole Trend Bands is a volatility-aware trend filtering indicator designed to identify the dominant market direction while providing dynamic reference zones around price.
Instead of relying on traditional moving averages, this indicator uses a two-pole digital filter to smooth price action while maintaining responsiveness. Around this central trend line, a multi-band structure based on ATR is applied to help traders evaluate pullbacks, extensions, and potential exhaustion areas within a trend.
Core Concept
The indicator is built around three key ideas:
Digital Trend Filtering
Volatility-Adjusted Bands
Trend Persistence Measurement
These components work together to separate meaningful price movement from noise and to provide context for how far price has moved relative to recent volatility.
Two-Pole Trend Filter
At its core, the indicator uses a two-pole smoothing filter, which produces a cleaner trend curve than common moving averages.
Compared to standard averages, this approach:
Reduces market noise
Produces smoother transitions
Responds faster to genuine trend changes
Avoids excessive lag in trending markets
The result is a trend line that represents the structural direction of price, rather than short-term fluctuations.
Adaptive Multi-Band System
Around the central trend filter, the indicator plots four independent volatility-based bands, each derived from the Average True Range (ATR).
Each band represents a different degree of price extension:
Band 1: Shallow pullbacks and minor reactions
Band 2: Moderate extensions within a trend
Band 3: Strong directional moves
Band 4: Extreme extensions relative to recent volatility
Because the bands are ATR-based, they automatically adapt to changing market conditions, expanding during high volatility and contracting during calmer periods.
This makes the indicator suitable for both slow and fast markets without manual recalibration.
Trend State Detection
The color of the central filter dynamically reflects trend persistence, not just direction:
Sustained upward movement highlights bullish conditions
Sustained downward movement highlights bearish conditions
Transitional phases are visually distinct, helping identify regime changes
This logic is based on how long price has maintained directional behavior, reducing sensitivity to isolated candles or short-lived spikes.
Practical Applications
This indicator can be used as:
A trend filter for discretionary or systematic strategies
A context tool to evaluate pullbacks versus overextension
A risk reference to avoid entries in extreme price zones
A confirmation layer when combined with price action or momentum tools
It performs consistently across different asset classes, including futures, cryptocurrencies, forex, indices, and equities.
Configuration
Key parameters such as filter length, damping factor, and band multipliers are fully configurable, allowing traders to adapt the indicator to different timeframes and trading styles.
Important Notes
This indicator does not predict future price movement
It does not generate guaranteed buy or sell signals
Best results are achieved when used in combination with sound risk management and additional confirmation tools
Past behavior does not imply future performance
Disclaimer
This indicator is provided for educational and analytical purposes only and should not be considered financial advice.
Se quiser, posso:
Criar uma versão resumida para a primeira linha da publicação
Ajustar o texto para um tom mais técnico ou mais comercial
Traduzir para português mantendo o inglês como idioma principal
Revisar o título para SEO dentro da Biblioteca Pública

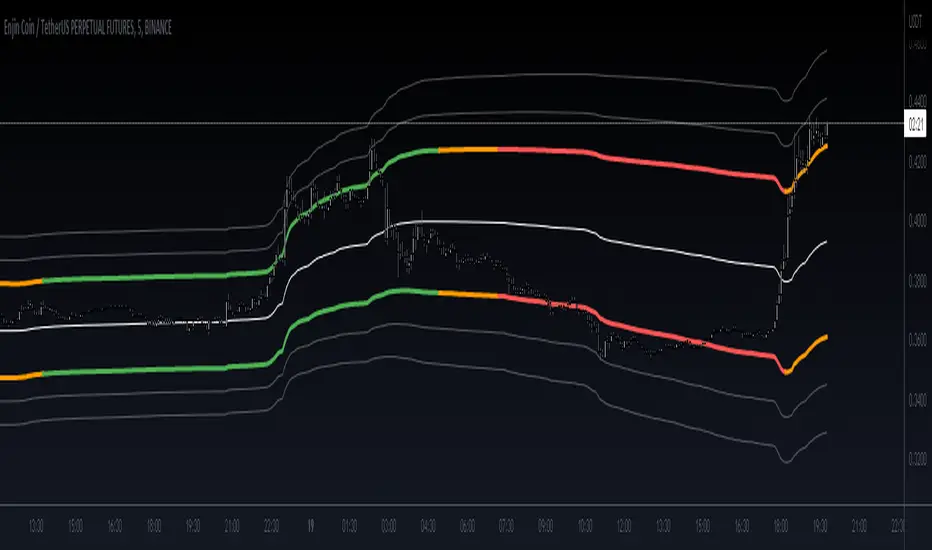
Setup Keltner BandS MMS + RSI SIGNALS
📊 Keltner Bands with RSI Confirmation – TradingView Script
Introduction
This script combines Keltner Channel logic with Relative Strength Index (RSI) confirmation to provide traders with visual signals and alerts for potential reversals. It is designed for scalping and short-term trading strategies, where precision and quick decision-making are essential.
🔧 How It Works
• Keltner Bands (ATR-based):
• Two sets of bands are plotted around a moving average:
• Band 3 (ATR × 3) – more sensitive, suitable for aggressive entries.
• Band 5 (ATR × 5) – wider, used as a filter or confirmation zone.
• Signals are generated when the price crosses back inside the bands from outside.
• RSI Confirmation:
• RSI is calculated with a customizable period (default: 14).
• Overbought and oversold levels (default: 70/30) are used to filter signals.
• A bearish reversal is confirmed only if RSI is above the overbought level.
• A bullish reversal is confirmed only if RSI is below the oversold level.
📌 Functions and Features
• Visual Signals:
• Triangles plotted above/below candles for Keltner-only signals.
• Additional colored triangles for Keltner + RSI confirmed signals.
• Alerts:
• Configurable alerts for both Keltner-only and RSI-confirmed conditions.
• Messages include the type of reversal and the band level.
• Customizable Parameters:
• Moving average length.
• ATR multipliers (3 and 5).
• RSI length and thresholds.
• Colors for band fills and signals.
🎯 Usage
1. Apply the script to your chart in TradingView.
2. Adjust parameters to fit your trading style (scalping, intraday, swing).
3. Watch for signals:
• Red/green/orange/teal triangles → Keltner-only reversals.
• Maroon/lime/purple/blue triangles → RSI-confirmed reversals.
4. Set alerts to receive notifications when conditions are met.
5. Use RSI confirmation to filter out false signals and increase accuracy.
✅ Benefits
• Clear visualization of reversal zones.
• Dual-layer confirmation (Keltner + RSI).
• Flexible for different timeframes and trading styles.
• Ready-to-use alerts for automation or manual trading.

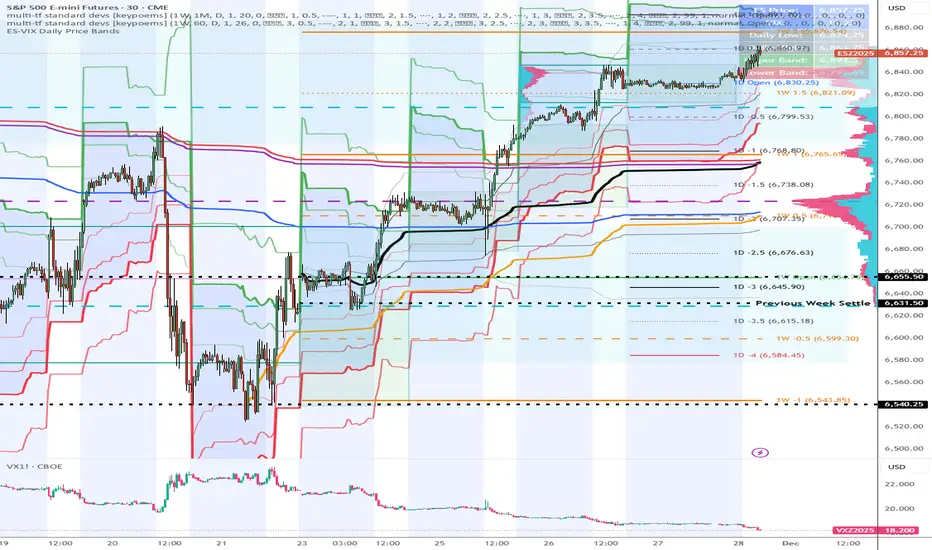
ES-VIX Daily Price Bands - Inner and OuterES-VIX Daily Price Bands
This indicator plots dynamic intraday price bands for ES futures based on real-time volatility levels measured by the VIX (CBOE Volatility Index). The bands evolve throughout the trading day, providing volatility-adjusted price targets.
Formulas:
Upper Band = Daily Low + (ES Price × VIX ÷ √252 ÷ 100)
Lower Band = Daily High - (ES Price × VIX ÷ √252 ÷ 100)
The calculation uses the square root of 252 (trading days per year) to convert annualized VIX volatility into an expected daily move, then scales it as a percentage adjustment from the current day's extremes.
Features:
Real-time band calculation that updates throughout the trading session
Upper band (green) extends from the current day's low
Lower band (red) contracts from the current day's high
Inner upper band (green) at 50% of expected move
Inner lower band (red) at 50% of expected move
Middle Inner upper band (green) at 80% of expected move
Middle Inner lower band (red) at 80% of expected move
Outer upper band (green) at 150% of expected move
Outer lower band (red) at 150% of expected move
Shaded zone between bands for visual clarity
Information table displaying:
Current ES price and VIX level
Running daily high and low
Current upper and lower band values
ES-VIX Daily Price BandsES-VIX Daily Price Bands
This indicator plots dynamic intraday price bands for ES futures based on real-time volatility levels measured by the VIX (CBOE Volatility Index). The bands evolve throughout the trading day, providing volatility-adjusted price targets.
Formulas:
Upper Band = Daily Low + (ES Price × VIX ÷ √252 ÷ 100)
Lower Band = Daily High - (ES Price × VIX ÷ √252 ÷ 100)
The calculation uses the square root of 252 (trading days per year) to convert annualized VIX volatility into an expected daily move, then scales it as a percentage adjustment from the current day's extremes.
Features:
Real-time band calculation that updates throughout the trading session
Upper band (green) extends from the current day's low
Lower band (red) contracts from the current day's high
Shaded zone between bands for visual clarity
Information table displaying:
Current ES price and VIX level
Running daily high and low
Current upper and lower band values

CandleFlow — Adaptive-Colored Bollinger BandsEN — What it is
Classic Bollinger Bands with adaptive color. Bands turn green when the basis slope is rising and red when it is falling. Same BB math; only visuals adapt. Two-state only.
Features
• Works on any timeframe; built with daily crypto in mind
• Inputs: Length 20, Multiplier 2.0, MA Type (SMA/EMA/WMA), Slope Length, Up/Down thresholds, Band fill
• Alerts: Trend state turns Up / turns Down
Notes
• Invite-only access. Source code not provided.
• No profit guarantee; this is not financial advice.
KR — 요약
표준 볼린저 계산은 그대로, 기준선이 상승하면 초록/하락하면 빨강으로 자동 색상 전환. 일봉 크립토에 최적화. 입력값(기간 20, 배수 2.0, MA 타입, 기울기 길이, 상/하 임계값, 밴드 채우기), 알림(상승/하락 전환) 제공. 초대전용, 코드 비공개. 수익 보장 없음.
Trademark
Bollinger Bands® is a registered trademark of John Bollinger. Not affiliated or endorsed.
Bridge Bands ATR (Overlay) ShaneHurst-Adaptive Volatility Bands
A fractal-inspired evolution of Bollinger and Keltner bands that adapts dynamically to both volatility and trend persistence.
This indicator estimates the Hurst exponent (H) — a measure of market memory — and adjusts a standard volatility band to lean in the direction of the prevailing trend.
When H > 0.5, markets exhibit persistence (trending behavior); the bands shift in the trend’s direction.
When H < 0.5, markets are mean-reverting; the bands flatten and recent extremes become potential fade zones.
Band width scales with recent volatility (σ), expanding in turbulent conditions and contracting during calm periods.
Key Features:
Adaptive offset using the Hurst exponent
Volatility-sensitive width for dynamic market regimes
EMA baseline with directional bias
Clear visual separation between trending and choppy phases
Inspired by Benoit Mandelbrot’s The Misbehavior of Markets and H.E. Hurst’s original work on long-term memory in time series.
Use it to identify regime shifts, trend-following entries, and volatility-adjusted stop levels.
Credit for this script goes to a number of people including Steve B, MichaalAngle, doc and joecat808. 500 day DEMA (double EMA) can be used as a longer term momentum line.

Outside the Bollinger Bands Alerting Indicator Overview
The Outside the Bollinger Bands Alerting Indicator is a comprehensive technical analysis tool that combines multiple proven
indicators into a single, powerful system designed to identify high-probability reversal patterns at Bollinger Band extremes. This
indicator goes beyond simple band touches to detect sophisticated pattern formations that often signal strong directional moves.
Key Features & Capabilities
🎯 Advanced Pattern Recognition
Bollinger Band Breakout Patterns
- Detects "pierce-and-reject" formations where price breaks through a Bollinger Band but immediately reverses back inside
- Identifies failed breakouts that often lead to strong moves in the opposite direction
- Combines multiple confirmation signals: engulfing candle patterns, MACD momentum, and ATR volatility filters
- Visual alerts with symbols positioned below (bullish) or above (bearish) candles
Tweezer Top & Bottom Patterns
- Identifies consecutive candles with nearly identical highs (tweezer tops) or lows (tweezer bottoms)
- Requires at least one candle to breach the respective Bollinger Band
- Confirms reversal with directional close requirements
- Customizable tolerance settings for pattern sensitivity
- Visual alerts with ❙❙ symbols for easy identification
📊 Multi-Indicator Integration
Bollinger Bands Indicator
- Dual-band configuration with outer (2.0 std dev) and inner (1.5 std dev) bands that can be adjusted to suit your own parameters
- Configurable MA types: SMA, EMA, SMMA (RMA), WMA, VWMA
- Customizable length, source, and offset parameters
- Color-coded band fills for visual clarity
Moving Average Suite
- EMA 9, 21, 50, and 200 (individually toggleable)
- Special "SMA 3 High" for help visualizing and detecting Bollinger Band break-outs
- Dynamic color coding based on price relationship
Optional Ichimoku Cloud overlay
- Complete Ichimoku implementation with customizable periods
- Dynamic cloud coloring based on trend direction
- Toggleable overlay that doesn't interfere with other indicators
🚨 Comprehensive Alert System
Real-Time JSON Alerts
- Sends structured data on every confirmed bar close
- Includes all indicator values: BB levels, EMAs, MACD, RSI
- Contains signal states and crossover conditions
- Perfect for automated trading systems and webhooks
{"timestamp":1753118700000,"symbol":"ETHUSD","timeframe":"5","price":3773.3,"bollinger_bands":{"upper":3826.95,"basis":3788.32,"lower":3749.68},"emas":{"ema_9":3780.45,"ema_21":3788.92,"ema_50":3800.79,"ema_200":3787.74,"sma_3_high":3789.45},"macd":{"macd":-10.1932,"signal":-11.3266,"histogram":1.1334},"rsi":{"rsi":40.5,"rsi_ma":39.32,"level":"neutral"}}
Specific Alert Conditions
- MACD histogram state changes (rising to falling, falling to rising)
- RSI overbought/oversold crossovers
- All pattern detections (BB Bounce, Tweezer patterns)
- Bollinger Band breakout alerts
🎨 Visual Elements
Pattern Identification
- ♻ symbols for Bollinger Band breakout patterns (green for bullish, red for bearish)
- ❙❙ symbols for tweezer patterns (green below for bottoms, red above for tops)
- Color-coded band fills for trend visualization
Chart Overlay Options
- All moving averages with distinct colors
- Bollinger Bands with inner and outer boundaries
- Optional Ichimoku cloud with trend-based coloring
Trading Applications
Reversal Trading
- Identify high-probability reversal points at extreme price levels
- Use failed breakout patterns for entry signals
- Combine multiple timeframes for enhanced accuracy
Trend Analysis
- Monitor moving average relationships for trend direction
- Use Ichimoku cloud for trend strength assessment
- Track momentum with MACD and RSI integration
Risk Management
- ATR-based volatility filtering reduces false signals
- Multiple confirmation requirements improve signal quality
- Real-time alerts enable prompt decision making
Suggested Use
- Use on multiple timeframes for confluence
- Combine with support/resistance levels for enhanced accuracy
- Set up alerts for hands-free monitoring
- Customize settings based on market volatility and trading style
- Consider volume confirmation for stronger signals

Snapfront WCTφ Coherence BandsSnapfront Coherence Bands — WCTφ (v6)
The Snapfront Coherence Bands (SCB) extend classic ATR-style bands with a coherence-driven engine. Instead of simple volatility envelopes, SCB adapt dynamically to market entropy, trend stability, and regime detection.
Core Features:
📊 WCTφ (Weighted Coherence Tracking) to measure entropy & disorder
🔍 Adaptive band width scaling with chaos factor (ATR × coherence)
🎯 Regime coloring:
Trend (lime)
Breakout (aqua)
Mean reversion (yellow)
Exhaustion (orange)
⚡ Squeeze detector with percentile-based compression zones
🟢/🔴 Entry/exit arrows on crossovers (optional)
Use Cases:
Spot high-clarity trend moves vs. noisy ranges
Anticipate volatility squeezes & breakout setups
Filter trades by regime classification
Visualize price stability with adaptive banding
⚠️ Invite-Only Access:
Available exclusively via SnapfrontTech. Subscription required.
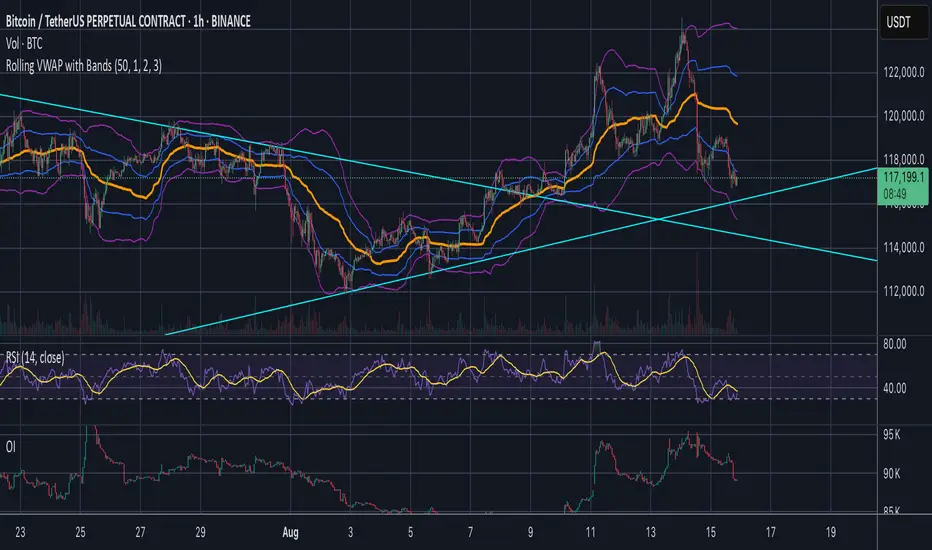
Jose's Rolling VWAP with BandsRolling VWAP with Customizable Deviation Bands
This indicator plots a rolling Volume Weighted Average Price (VWAP) over a user-defined lookback period, rather than resetting each day or from a fixed anchor point. The rolling calculation makes it act more like a moving average — but weighted by volume — providing a smoother, more adaptive central price line.
It also includes up to three optional deviation bands, which can be independently toggled on/off and assigned their own multipliers. These bands are calculated using the chosen lookback’s standard deviation, giving traders a quick visual of price dispersion around VWAP.
Features:
Adjustable rolling VWAP lookback length
Up to 3 customizable standard deviation bands
Individual checkboxes for enabling/disabling each band
Independent multiplier control for each band
Works on any timeframe and symbol
Uses:
Identify overextended price moves relative to VWAP
Spot dynamic support/resistance zones
Gauge mean reversion opportunities
Confirm trend strength when price hugs or breaks away from VWAP