Entropy Bands (TechnoBlooms)Entropy Bands — A New Era of Volatility and Trend Analysis
Entropy Bands is our next indicator as a part of the Quantum Price Theory (QPT) Series of indicators.
🧠 Overview
Entropy Bands are an advanced volatility-based indicator that reimagines traditional banded systems like Bollinger Bands.
Built on entropy theory, adaptive moving averages, and dynamic volatility measurement, Entropy Bands provide deeper insights into market randomness, trend strength, and breakout potential.
Instead of only relying on price deviation (like Bollinger Bands), Entropy Bands integrate chaos theory principles to create smarter, more responsive dynamic bands that adapt to real market behavior.
🚀Why is Entropy Bands Different — and Better
Dynamic Band Width : Adjusts using both entropy and ATR, creating smarter expansion/contraction.
Multi-Moving Average Core : Choose between SMA, EMA, or WMA for optimal centerline behavior.
Noise and Breakout Filtering : Filters fake breakouts by analyzing candle body size and entropy conditions.
Visual Clarity : Background and candle coloring highlight chaotic/noisy zones, trend zones, and breakout moments.
Entropy Bands don't just react to price — they analyze the underlying market behavior, offering superior decision-making signals.
📚 Watch Band Behavior:
Bands expand during volatility spikes or chaotic conditions.
Bands contract during low volatility or tight consolidation zones.
📚 Analyze Candle Coloring:
Green = Bullish breakout (closing above upper band).
Pink = Bearish breakout (closing below lower band).
Gray = Inside bands (neutral/random noise).
✨ Key Features of Entropy Bands:
Entropy-Based Band Width Calculation: A scientific edge over pure price deviation methods.
Dynamic Background Coloring: Highlights high entropy areas where randomness dominates.
Candle Breakout Coloring: Easy-to-spot trend breakouts and strength moves.
Multi-MA Flexibility: Adapt the bands’ core to trending, ranging, or volatile markets.
Body Size Filter: Protects against fake breakouts by requiring meaningful candle body moves.
Recherche dans les scripts pour "bands"

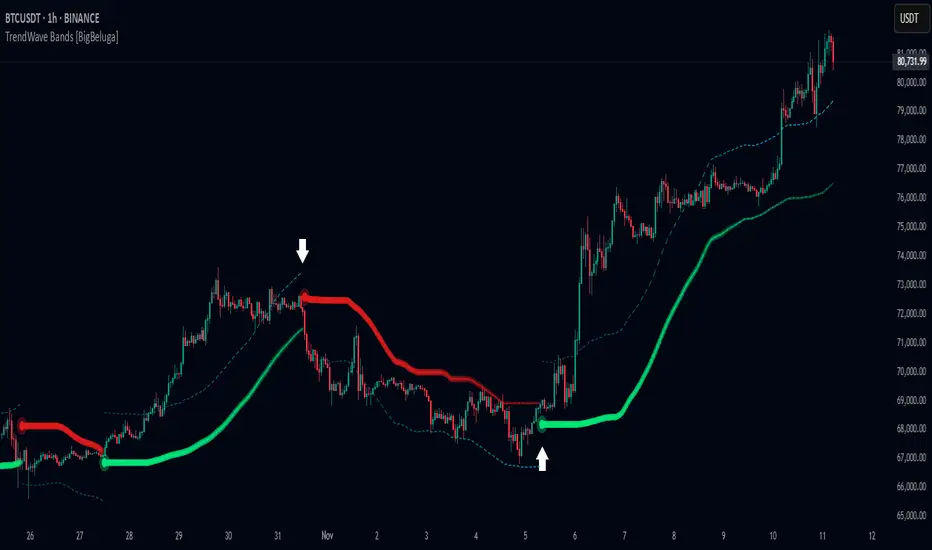
TrendWave Bands [BigBeluga]This is a trend-following indicator that dynamically adapts to market trends using upper and lower bands. It visually highlights trend strength and duration through color intensity while providing additional wave bands for deeper trend analysis.
🔵Key Features:
Adaptive Trend Bands:
➣ Displays a lower band in uptrends and an upper band in downtrends to indicate trend direction.
➣ The bands act as dynamic support and resistance levels, helping traders identify potential entry and exit points.
Wave Bands for Additional Analysis:
➣ A dashed wave band appears opposite the main trend band for deeper trend confirmation.
➣ In an uptrend, the upper dashed wave band helps analyze momentum, while in a downtrend, the lower dashed wave band serves the same purpose.
Gradient Color Intensity:
➣ The trend bands have a color gradient that fades as the trend continues, helping traders visualize trend duration.
➣ The wave bands have an inverse gradient effect—starting with low intensity at the trend's beginning and increasing in intensity as the trend progresses.
Trend Change Signals:
➣ Circular markers appear at trend reversals, providing clear entry and exit points.
➣ These signals mark transitions between bullish and bearish phases based on price action.
🔵Usage:
Trend Following: Use the lower band for confirmation in uptrends and the upper band in downtrends to stay on the right side of the market.
Trend Duration Analysis: Gradient wavebands give an idea of the duration of the current trend — new trends will have high-intensity colored wavebands and as time goes on, trends will fade.
Trend Reversal Detection: Circular markers highlight trend shifts, making it easier to spot entry and exit opportunities.
Volatility Awareness: Volatility-based bands help traders adjust their strategies based on market volatility, ensuring better risk management.
TrendWave Bands is a powerful tool for traders seeking to follow market trends with enhanced visual clarity. By combining trend bands, wave bands, and gradient-based color scaling, it provides a detailed view of market dynamics and trend evolution.
Holt-Winters Forecast BandsDescription:
The Holt-Winters Adaptive Bands indicator combines seasonal trend forecasting with adaptive volatility bands. It uses the Holt-Winters triple exponential smoothing model to project future price trends, while Nadaraya-Watson smoothed bands highlight dynamic support and resistance zones.
This indicator is ideal for traders seeking to predict future price movements and visualize potential market turning points. By focusing on broader seasonal and trend data, it provides insight into both short- and long-term market directions. It’s particularly effective for swing trading and medium-to-long-term trend analysis on timeframes like daily and 4-hour charts, although it can be adjusted for other timeframes.
Key Features:
Holt-Winters Forecast Line: The core of this indicator is the Holt-Winters model, which uses three components — level, trend, and seasonality — to project future prices. This model is widely used for time-series forecasting, and in this script, it provides a dynamic forecast line that predicts where price might move based on historical patterns.
Adaptive Volatility Bands: The shaded areas around the forecast line are based on Nadaraya-Watson smoothing of historical price data. These bands provide a visual representation of potential support and resistance levels, adapting to recent volatility in the market. The bands' fill colors (red for upper and green for lower) allow traders to identify potential reversal zones without cluttering the chart.
Dynamic Confidence Levels: The indicator adapts its forecast based on market volatility, using inputs such as average true range (ATR) and price deviations. This means that in high-volatility conditions, the bands may widen to account for increased price movements, helping traders gauge the current market environment.
How to Use:
Forecasting: Use the forecast line to gain insight into potential future price direction. This line provides a directional bias, helping traders anticipate whether the price may continue along a trend or reverse.
Support and Resistance Zones: The shaded bands act as dynamic support and resistance zones. When price enters the upper (red) band, it may be in an overbought area, while the lower (green) band may indicate oversold conditions. These bands adjust with volatility, so they reflect the current market conditions rather than fixed levels.
Timeframe Recommendations:
This indicator performs best on daily and 4-hour charts due to its reliance on trend and seasonality. It can be used on lower timeframes, but accuracy may vary due to increased price noise.
For traders looking to capture swing trades, the daily and 4-hour timeframes provide a balance of trend stability and signal reliability.
Adjustable Settings:
Alpha, Beta, and Gamma: These settings control the level, trend, and seasonality components of the forecast. Alpha is generally the most sensitive setting for adjusting responsiveness to recent price movements, while Beta and Gamma help fine-tune the trend and seasonal adjustments.
Band Smoothing and Deviation: These settings control the lookback period and width of the volatility bands, allowing users to customize how closely the bands follow price action.
Parameters:
Prediction Length: Sets the length of the forecast, determining how far into the future the prediction line extends.
Season Length: Defines the seasonality cycle. A setting of 14 is typical for bi-weekly cycles, but this can be adjusted based on observed market cycles.
Alpha, Beta, Gamma: These parameters adjust the Holt-Winters model's sensitivity to recent prices, trends, and seasonal patterns.
Band Smoothing: Determines the smoothing applied to the bands, making them either more reactive or smoother.
Ideal Use Cases:
Swing Trading and Trend Following: The Holt-Winters model is particularly suited for capturing larger market trends. Use the forecast line to determine trend direction and the bands to gauge support/resistance levels for potential entries or exits.
Identifying Reversal Zones: The adaptive bands act as dynamic overbought and oversold zones, giving traders potential reversal areas when price reaches these levels.
Important Notes:
No Buy/Sell Signals: This indicator does not produce direct buy or sell signals. It’s intended for visual trend analysis and support/resistance identification, leaving trade decisions to the user.
Not for High-Frequency Trading: Due to the nature of the Holt-Winters model, this indicator is optimized for higher timeframes like the daily and 4-hour charts. It may not be suitable for high-frequency or scalping strategies on very short timeframes.
Adjust for Volatility: If using the indicator on lower timeframes or more volatile assets, consider adjusting the band smoothing and prediction length settings for better responsiveness.

Volatility Trend Bands [UAlgo]The Volatility Trend Bands is a trend-following indicator that combines the concepts of volatility and trend detection. Built using the Average True Range (ATR) to measure volatility, this indicator dynamically adjusts upper and lower bands around price movements. The bands act as dynamic support and resistance levels, making it easier to identify trend shifts and potential entry and exit points.
With the ATR multiplier, this indicator effectively captures volatility-based shifts in the market. The use of midline values allows for accurate trend detection, which is displayed through color-coded signals on the chart. Additionally, this tool provides clear buy and sell signals, accompanied by intuitive graphical markers for ease of use.
The Volatility Trend Bands is ideal for traders seeking an adaptive trend-following method that responds to changing market conditions while maintaining robust volatility control.
🔶 Key Features
Dynamic Support and Resistance: The indicator utilizes volatility to create dynamic bands. The upper band acts as resistance, and the lower band acts as support for the price. Wider bands indicate higher volatility, while narrower bands indicate lower volatility.
Customizable Inputs
You can tailor the indicator to your strategy by adjusting the:
Price Source: Select the price data (e.g., closing price) used for calculations.
ATR Length: Define the lookback period for the Average True Range (ATR) volatility measure.
ATR Multiplier: This factor controls the width of the volatility bands relative to the ATR value.
Color Options: Choose colors for the bands and signal arrows for better visualization.
Visual Signals: Arrows ("▲" for buy, "▼" for sell) appear on the chart when the trend changes, providing clear entry point indications.
Alerts: Integrated alerts for both buy and sell conditions, allowing you to receive notifications for potential trade opportunities.
🔶 Interpreting Indicator
Upper and Lower Bands: The upper and lower bands are dynamic, adjusting based on market volatility using the ATR. These bands serve as adaptive support and resistance levels. When price breaks above the upper band, it indicates a potential bullish breakout, signaling a strong uptrend. Conversely, a break below the lower band signals a bearish breakout, indicating a downtrend.
Buy/Sell Signals: The indicator provides clear buy and sell signals at breakout points. A buy signal ("▲") is generated when the price breaks above the upper band, suggesting the start of a bullish trend. A sell signal ("▼") is triggered when the price breaks below the lower band, indicating the beginning of a bearish trend. These signals help traders identify potential entry and exit points at key breakout levels.
Color-Coded Bars: The bars on the chart change color based on the trend direction. Teal bars represent bullish momentum, while purple bars signify bearish momentum. This color coding provides a quick visual cue about the market's current direction.
🔶 Disclaimer
Use with Caution: This indicator is provided for educational and informational purposes only and should not be considered as financial advice. Users should exercise caution and perform their own analysis before making trading decisions based on the indicator's signals.
Not Financial Advice: The information provided by this indicator does not constitute financial advice, and the creator (UAlgo) shall not be held responsible for any trading losses incurred as a result of using this indicator.
Backtesting Recommended: Traders are encouraged to backtest the indicator thoroughly on historical data before using it in live trading to assess its performance and suitability for their trading strategies.
Risk Management: Trading involves inherent risks, and users should implement proper risk management strategies, including but not limited to stop-loss orders and position sizing, to mitigate potential losses.
No Guarantees: The accuracy and reliability of the indicator's signals cannot be guaranteed, as they are based on historical price data and past performance may not be indicative of future results.

RSI with Bollinger Bands Scalp Startegy (1min)
------------------------------------------------------------------------------
The "RSI with Bollinger Bands Scalp Strategy (1min)" is a highly effective tool designed for traders who engage in short-term scalping on the 1-minute chart. This indicator combines the strengths of the RSI (Relative Strength Index) and Bollinger Bands to generate precise buy signals, helping traders make quick and informed decisions in fast-moving markets.
How It Works:
RSI (Relative Strength Index):
The RSI is a widely-used momentum oscillator that measures the speed and change of price movements. It operates on a scale of 0 to 100 and helps identify overbought and oversold conditions in the market.
This strategy allows customization of the RSI's lower and upper bands (default settings: 30 for the lower band and 70 for the upper band) and the RSI length (default: 14).
Bollinger Bands:
Bollinger Bands consist of a central moving average (the basis) and two bands that represent standard deviations above and below the basis. These bands expand and contract based on market volatility.
In this strategy, the Bollinger Bands are used to identify potential buy and sell signals based on the price's relationship to the upper and lower bands.
Signal Generation:
Buy Signal: A buy signal is triggered when two conditions are met:
The RSI value falls below the specified lower band, indicating an oversold condition.
The price crosses below the lower Bollinger Band.
The buy signal is then issued on the first positive candle (where the closing price is greater than or equal to the opening price) after these conditions are met.
Sell Signal: In this version of the strategy, the sell signal is currently disabled to focus solely on generating and optimizing the buy signals for scalping.
Strategy Highlights:
This indicator is particularly effective for traders who focus on 1-minute charts and want to capitalize on rapid price movements.
The combination of RSI and Bollinger Bands ensures that buy signals are only generated during significant oversold conditions, helping to filter out false signals.
Customization:
Users can adjust the RSI length, Bollinger Bands length, and the standard deviation multiplier to better fit their specific trading style and the asset they are trading.
The moving average type for Bollinger Bands can be selected from various options, including SMA, EMA, SMMA, WMA, and VWMA, allowing further customization based on individual preferences.
Usage:
Use this indicator on a 1-minute chart to identify potential buy opportunities during short-term price dips.
Since the sell signals are disabled, this strategy is best used in conjunction with other indicators or strategies to manage exit points effectively.
This "RSI with Bollinger Bands Scalp Strategy (1min)" indicator is a valuable tool for traders looking to enhance their short-term trading performance by focusing on high-probability entry points in volatile market conditions.

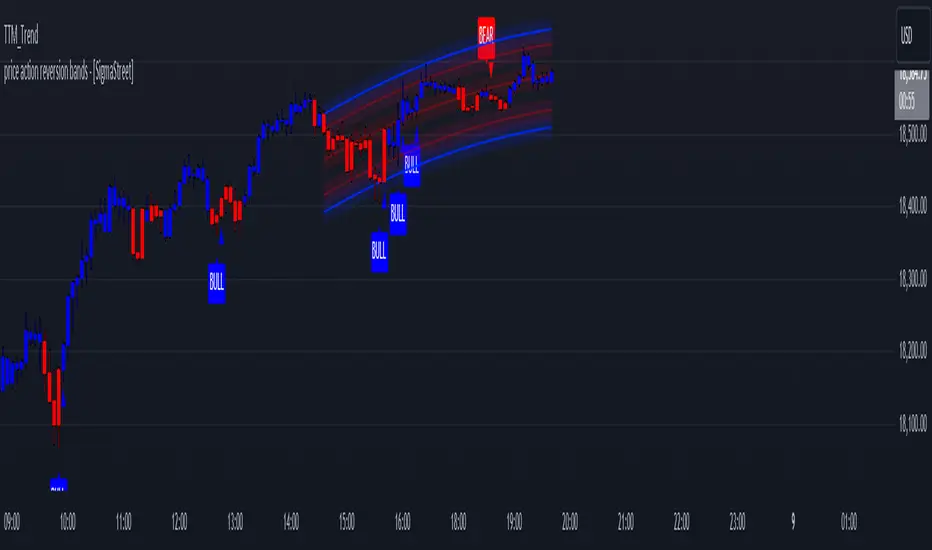
price action reversion bands - [SigmaStreet]█ OVERVIEW
The "Price Action Reversion Bands" is designed to help traders identify potential reversal zones through the integration of polynomial regression, fractal analysis, and pinbar detection. This tool overlays directly onto the price chart, providing dynamic visual cues and signals for market reversals. Its unique synthesis of these methodologies offers traders a powerful, multifaceted approach to market analysis.
█ CONCEPTS
Polynomial Regression Bands:
What It Does:
Models the main trend using a polynomial equation to create a middle trend line with dynamic support and resistance bands.
How It Works:
Calculates polynomial coefficients to plot a regression line and adjusts the bands according to market volatility and conditions.
Fibonacci Retracement Levels:
What It Does:
Provides additional lines inside the regression bands at key Fibonacci ratios to identify potential support and resistance areas.
How It Works:
Calculates retracement levels by identifying high and low points over the same period used to calculate the regression bands, applying Fibonacci ratios to these points.
Fractal Analysis:
What It Does: Identifies natural resistance and support levels, indicating potential reversal zones.
How It Works: Detects fractals based on a specific pattern of price action, using Williams Fractal methodology.
Pinbar Detection:
What It Does: Signals potential price reversals through pinbar candlestick patterns.
How It Works: Analyzes
candlesticks to identify pinbars which show a rejection of prices, suggesting possible reversals.
█ ORIGINALITY AND USEFULNESS
The price action reversion bands distinguishes itself through its innovative integration of several advanced analytical methods, providing traders with a holistic view of potential market reversals:
Unique Combination:
While many tools use these techniques in isolation, this indicator synergistically combines polynomial regression, Fibonacci retracement levels, fractal analysis, and pinbar detection. This multi-faceted approach allows traders to assess strength, potential reversal zones, and price rejection more effectively than using traditional single-method indicators.
Advanced Polynomial Regression Application:
Unlike standard regression tools that offer static insights, this indicator dynamically adjusts its regression bands based on real-time market volatility, providing a more accurate reflection of market conditions.
Enhanced Signal Reliability:
By using fractals and pinbars in conjunction to validate each other, the indicator significantly increases the reliability of its reversal signals. This dual-validation method filters out less probable signals, focusing on high-probability trading opportunities.
Customization and Flexibility:
It offers unprecedented customization options, allowing traders to fine-tune the tool according to their trading style and market conditions. Traders can adjust the polynomial degree, the sensitivity of the Fibonacci retracements, and even the definition of what constitutes a significant pinbar, making it highly adaptable to various trading scenarios.
Educational Value:
The indicator not only aids in trading but also serves as an educational tool that helps traders understand the interaction between different types of market analysis techniques. This contributes to a deeper knowledge base and better trading decisions over time.
These distinctive features make the "Price Action Reversion Bands - " not just another indicator but a comprehensive trading tool that enhances decision-making through a well-rounded analysis of market dynamics.
█ HOW TO USE
Installation and Setup:
Apply the indicator to your TradingView chart from the "Indicators" menu.
Select either polynomial regression or Fibonacci retracement as the basis for the bands through the indicator settings.
Reading the Indicator:
Monitor the approach of price to the upper and lower bands which indicate potential reversal zones.
Look for fractal and pinbar formations near these bands for additional signal confirmation.
Customization:
Adjust settings such as the polynomial degree, data window length, and engagement zones to tailor the bands to your trading style.
Modify visual aspects like color and line type for better clarity and personal preference.
█ FEATURES
Dynamic Adjustment:
Bands adjust in real-time based on incoming price data and selected settings.
Multiple Analysis Techniques: Combines several analytical techniques to provide a comprehensive view of potential market movements. The integration of polynomial regression with Fibonacci levels, supplemented by fractal and pinbar analysis, marks this tool as particularly innovative, offering a level of synthesis that enhances predictive accuracy and usability.
User-Friendly Customization: Allows for extensive customization to suit individual trading strategies and preferences.
█ LIMITATIONS
Market Dependency:
Performance may vary significantly across different markets and conditions.
Parameter Sensitivity: Requires fine-tuning of parameters to ensure optimal performance, which might demand a steep learning curve for new users.
█ NOTES
For best results, combine this tool with other forms of analysis, such as fundamental analysis and other technical indicators, to confirm signals and enhance decision-making.
█ THANKS
Special thanks to the PineCoders community the Pine Coders themselves for their foundational contributions to the concepts used in this script. Their pioneering work in the fields of technical analysis and Pine Script development has been invaluable. This script is a testament to the collaborative spirit of the TradingView developer community, integrating analytical techniques with innovative approaches to offer a tool that is both modern and cutting-edge.
EMA Power BandsHello!
Today, I am delighted to introduce you to the "EMA Power Bands" indicator, designed to assist in identifying buying and selling points for assets moving in the markets.
Key Features of the Indicator:
EMA Bands: "EMA Power Bands" utilizes Exponential Moving Average (EMA) to create trend lines. These bands automatically expand or contract based on the price trend, adapting to market conditions.
ATR-Based Volatility: The indicator measures price volatility using the Average True Range (ATR) indicator, adjusting the width of the EMA bands accordingly. As a result, wider bands form during periods of increased volatility, while they narrow during lower volatility.
RSI-Based Buy-Sell Signals: "EMA Power Bands" uses the Relative Strength Index (RSI) to identify overbought and oversold zones. Entering the overbought zone generates a sell signal, while entering the oversold zone produces a buy signal.
Trend Direction Identification: The indicator assists in determining the price trend direction by analyzing the slope of the EMA bands. This allows you to identify periods of uptrends and downtrends.
Visualization of Buy-Sell Signals: "EMA Power Bands" visually marks the buy and sell signals:
- When RSI enters the overbought zone, it displays a sell signal (🪫).
- When RSI enters the oversold zone, it indicates a buy signal (🔋).
- When a candle closes above the emaup line, it displays a bearish signal (🔨).
- When a candle closes below the emadw line, it indicates a bullish signal (🚀).
By using the "EMA Power Bands" (EMA Güç Bantları) indicator, especially in trend-following strategies and periods of volatility, you can make more informed and disciplined trading decisions. However, I recommend using it in conjunction with other technical analysis tools and fundamental data.
*You can also use it with CCI as an example.
With this indicator, you can identify potential trend reversals in advance and strengthen your risk management strategies.
So, go ahead and try the "EMA Power Bands" (EMA Güç Bantları) indicator to enhance your technical analysis skills and make more informed trading decisions!

OrangeCandle 4EMA 55 + Fib Bands + SignalsThe script is a TradingView indicator that combines three popular technical analysis tools: Exponential Moving Averages (EMAs), Fibonacci bands, and buy/sell signals based on these indicators. Here’s a breakdown of its features:
1. EMA Settings and Calculation:
The script calculates and plots several Exponential Moving Averages (EMAs) on the chart with different lengths:
Short-term EMAs: EMA 9, EMA 13, EMA 21, and EMA 55 (used for tracking short-term price trends).
Long-term EMAs: EMA 100 and EMA 200 (used to analyze longer-term trends).
These EMAs are plotted with different colors to visually distinguish between the short-term and long-term trends.
2. Fibonacci Bands:
The script calculates Fibonacci Bands based on the Average True Range (ATR) and a Simple Moving Average (SMA).
Fibonacci factors (1.618, 2.618, 4.236, 6.854, and 11.090) are used to determine the upper and lower bounds of five Fibonacci bands.
Upper Fibonacci Bands (e.g., fib1u, fib2u) represent resistance levels.
Lower Fibonacci Bands (e.g., fib1l, fib2l) represent support levels.
These bands are plotted with different colors for each level, helping traders identify potential price reversal zones.
3. Buy and Sell Signals:
Long Condition: A buy signal occurs when the price crosses above the EMA 55 (long-term trend indicator) and is above the lower Fibonacci band (support zone).
Short Condition: A sell signal occurs when the price crosses below the EMA 55 and is below the upper Fibonacci band (resistance zone).
These conditions trigger visual signals on the chart (green arrow for long, red arrow for short).
4. Alerts:
The script includes alert conditions to notify the trader when a long or short signal is triggered based on the crossover of price and EMA 55 near the Fibonacci support or resistance levels.
Long Entry Alert: Triggers when the price crosses above the EMA 55 and is near a Fibonacci support level.
Short Entry Alert: Triggers when the price crosses below the EMA 55 and is near a Fibonacci resistance level.
5. Visualization:
EMAs are plotted with distinct colors:
EMA 9 is aqua,
EMA 13 is purple,
EMA 21 is orange,
EMA 55 is blue (with thicker line width for emphasis),
EMA 100 is gray,
EMA 200 is black.
Fibonacci bands are plotted with different colors for each level:
Fib Band 1 (upper and lower) in white,
Fib Band 2 in green (upper) and red (lower),
Fib Band 3 in green (upper) and red (lower),
Fib Band 4 in blue (upper) and orange (lower),
Fib Band 5 in purple (upper) and yellow (lower).
Summary:
This script provides a comprehensive strategy for analyzing the market with multiple EMAs for trend detection, Fibonacci bands for support/resistance, and signals based on price action in relation to these indicators. The combination of these tools can assist traders in making more informed decisions by providing potential entry and exit points on the chart.

Averaged Moving Average Ribbon with Bollinger BandsThis indicator provides a visual representation of an averaged weighted moving average (WMA) ribbon (default setting) along with Bollinger Bands on a price chart. Pay attention to how the moving average and band expand and contract, as well as where price crosses the Bollinger bands (Green and red) or the basis line (blue). Look for patterns, and exploit them to your advantage to give you another edge in trading.
>> Feel free to suggest changes or other additions in the comments :)
Here's a brief explanation of how this indicator works:
1. **Moving Average Type:** You can select the type of moving average (MA) to use from the dropdown menu. The available options are Weighted Moving Average (WMA), Simple Moving Average (SMA), and Exponential Moving Average (EMA).
2. **Bollinger Bands Deviation:** This input allows you to adjust the deviation for the Bollinger Bands. Higher values increase the width of the bands, while lower values decrease it.
3. **Moving Average Lengths:** The script calculates various moving averages (WMA, SMA, or EMA) with different lengths, ranging from 5 to 100, in increments of 5. These moving averages are used to create the ribbon.
4. **Ribbon Calculation:** The indicator calculates the selected moving average (WMA, SMA, or EMA) for each of the specified lengths. It then averages these moving averages to create a ribbon of MAs. This ribbon represents a smoother and more encompassing view of the underlying price action.
5. **Bollinger Bands:** The script also calculates and plots Bollinger Bands based on the ribbon's average. The upper Bollinger Band (green) and lower Bollinger Band (red) are plotted around the ribbon average. These bands provide insights into potential overbought and oversold conditions.
In summary, this indicator allows traders and analysts to visualize a weighted moving average ribbon with Bollinger Bands to gain a better understanding of price trends, volatility, and potential reversal points in the market. The combination of different moving average lengths and Bollinger Bands can help in making informed trading decisions.

Elliptic bands
Why Elliptic?
Unlike traditional indicators (e.g., Bollinger Bands with constant standard deviation multiples), the elliptic model introduces a cyclical, non-linear variation in band width. This reflects the idea that price movements often follow rhythmic patterns, widening and narrowing in a predictable yet dynamic way, akin to natural market cycles.
Buy: When the price enters from below (green triangle).
Sell: When the price enters from above (red triangle).
Inputs
MA Length: 50 (This is the period for the central Simple Moving Average (SMA).)
Cycle Period: 50 (This is the elliptic cycle length.)
Volatility Multiplier: 2.0 (This value scales the band width.)
Mathematical Foundation
The indicator is based on the ellipse equation. The basic formula is:
Ellipse Equation:
(x^2) / (a^2) + (y^2) / (b^2) = 1
Solving for y:
y = b * sqrt(1 - (x^2) / (a^2))
Parameters Explained:
a: Set to 1 (normalized).
x: Varies from -1 to 1 over the period.
b: Calculated as:
ta.stdev(close, MA Length) * Volatility Multiplier
(This represents the standard deviation of the close prices over the MA period, scaled by the volatility multiplier.)
y (offset): Represents the band distance from the moving average, forming the elliptic cycle.
Behavior
Bands:
The bands are narrow at the cycle edges (when the offset is 0) and become widest at the midpoint (when the offset equals b).
Trend:
The central moving average (MA) shows the overall trend direction, while the bands adjust according to the volatility.
Signals:
Standard buy and sell signals are generated when the price interacts with the bands.
Practical Use
Trend Identification:
If the price is above the MA, it indicates an uptrend; if below, a downtrend.
Support and Resistance:
The elliptic bands act as dynamic support and resistance levels.
Narrowing bands may signal potential trend reversals.
Breakouts:

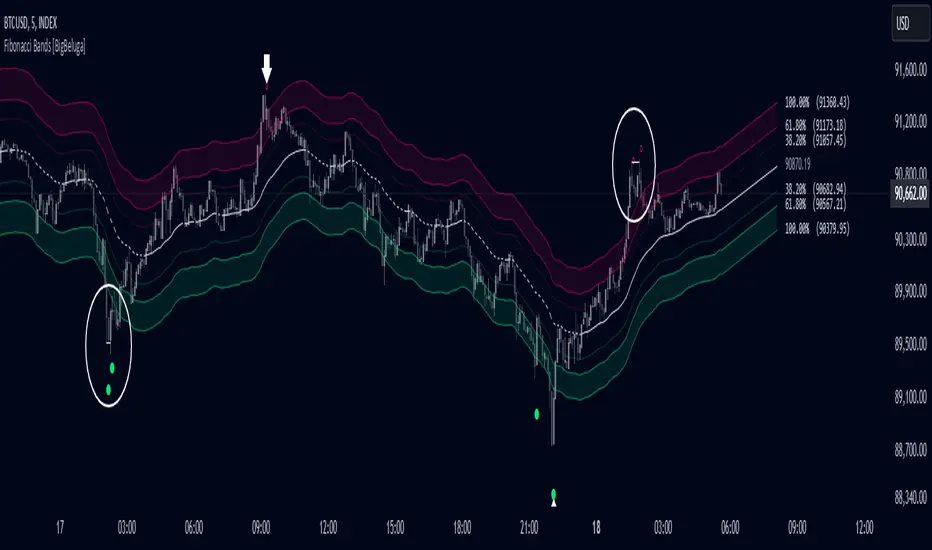
Fibonacci Bands [BigBeluga]The Fibonacci Band indicator is a powerful tool for identifying potential support, resistance, and mean reversion zones based on Fibonacci ratios. It overlays three sets of Fibonacci ratio bands (38.2%, 61.8%, and 100%) around a central trend line, dynamically adapting to price movements. This structure enables traders to track trends, visualize potential liquidity sweep areas, and spot reversal points for strategic entries and exits.
🔵 KEY FEATURES & USAGE
Fibonacci Bands for Support & Resistance:
The Fibonacci Band indicator applies three key Fibonacci ratios (38.2%, 61.8%, and 100%) to construct dynamic bands around a smoothed price. These levels often act as critical support and resistance areas, marked with labels displaying the percentage and corresponding price. The 100% band level is especially crucial, signaling potential liquidity sweep zones and reversal points.
Mean Reversion Signals at 100% Bands:
When price moves above or below the 100% band, the indicator generates mean reversion signals.
Trend Detection with Midline:
The central line acts as a trend-following tool: when solid, it indicates an uptrend, while a dashed line signals a downtrend. This adaptive midline helps traders assess the prevailing market direction while keeping the chart clean and intuitive.
Extended Price Projections:
All Fibonacci bands extend to future bars (default 30) to project potential price levels, providing a forward-looking perspective on where price may encounter support or resistance. This feature helps traders anticipate market structure in advance and set targets accordingly.
Liquidity Sweep:
--
-Liquidity Sweep at Previous Lows:
The price action moves below a previous low, capturing sell-side liquidity (stop-losses from long positions or entries for breakout traders).
The wick suggests that the price quickly reversed, leaving a failed breakout below support.
This is a classic liquidity grab, often indicating a bullish reversal .
-Liquidity Sweep at Previous Highs:
The price spikes above a prior high, sweeping buy-side liquidity (stop-losses from short positions or breakout entries).
The wick signifies rejection, suggesting a failed breakout above resistance.
This is a bearish liquidity sweep , often followed by a mean reversion or a downward move.
Display Customization:
To declutter the chart, traders can choose to hide Fibonacci levels and only display overbought/oversold zones along with the trend-following midline and mean reversion signals. This option enables a clearer focus on key reversal areas without additional distractions.
🔵 CUSTOMIZATION
Period Length: Adjust the length of the smoothed moving average for more reactive or smoother bands.
Channel Width: Customize the width of the Fibonacci channel.
Fibonacci Ratios: Customize the Fibonacci ratios to reflect personal preference or unique market behaviors.
Future Projection Extension: Set the number of bars to extend Fibonacci bands, allowing flexibility in projecting price levels.
Hide Fibonacci Levels: Toggle the visibility of Fibonacci levels for a cleaner chart focused on overbought/oversold regions and midline trend signals.
Liquidity Sweep: Toggle the visibility of Liquidity Sweep points
The Fibonacci Band indicator provides traders with an advanced framework for analyzing market structure, liquidity sweeps, and trend reversals. By integrating Fibonacci-based levels with trend detection and mean reversion signals, this tool offers a robust approach to navigating dynamic price action and finding high-probability trading opportunities.
Bollinger Bands with RSI Buy/Sell Signals (15 min) Bollinger Bands with RSI Buy/Sell Signals (15 Min)
Description:
The Bollinger Bands with RSI Buy/Sell Signals (15 Min) indicator is designed to help traders identify potential reversal points in the market using two popular technical indicators: Bollinger Bands and the Relative Strength Index (RSI).
How It Works:
Bollinger Bands:
Bollinger Bands consist of an upper band, lower band, and a middle line (Simple Moving Average). These bands adapt to market volatility, expanding during high volatility and contracting during low volatility.
This indicator monitors the 15-minute Bollinger Bands. If the price moves completely outside the bands, it signals that the market is potentially overextended.
Relative Strength Index (RSI):
RSI is a momentum indicator that measures the strength of price movements. RSI readings above 70 indicate an overbought condition, while readings below 30 suggest an oversold condition.
This indicator uses the RSI on the 15-minute time frame to further confirm overbought and oversold conditions.
Buy/Sell Signal Generation:
Buy Signal:
A buy signal is triggered when the market price crosses above the lower Bollinger Band on the 15-minute time frame, indicating that the market may be oversold.
Additionally, the RSI must be below 30, confirming an oversold condition.
A "Buy" label appears below the price when this condition is met.
Sell Signal:
A sell signal is triggered when the market price crosses below the upper Bollinger Band on the 15-minute time frame, indicating that the market may be overbought.
The RSI must be above 70, confirming an overbought condition.
A "Sell" label appears above the price when this condition is met.

RSI Bands With RSI - ATR Trend LineRSI Bands With RSI - ATR Trend Line (Smoothed Baseline)
Overview
A trend-following tool that fuses RSI-based regime detection with a smoothed baseline and ATR bands. Trend line aims to stay with the RSI move, cut random noise, and flip cleanly. The line draws green in bulls and red in bears; signals fire only on candle close confirmed flips.
Key Features
✅ Dynamic Trend Detection
RSI (>50 / <50) sets bullish/bearish regime
Smoothed baseline adapts to price while damping whipsaw
ATR-based bands expand/contract with volatility
✅ Precise Signal Generation
Buy when trend flips to bullish (close confirms above the upper band)
Sell when trend flips to bearish (close confirms below the lower band)
Flips require a real band break → fewer false transitions
✅ Visual Clarity
Green line = bullish trend, Red line = bearish trend
✅ Customizable Settings
RSI Length (default 14)
Baseline Smoothing (default 26)
ATR Length (default 14)
ATR Multiplier (default 1.4)
Toggles for Signals and Labels
✅ TradingView Alerts
Built-in Buy & Sell alerts (recommend Once per bar close)
How It Works
Algorithm Logic
RSI Regime: RSI above/below 50 sets bull/bear. At exactly 50, the prior target is carried forward.
Target & Smoothing: A per-bar target is built from the bar’s range and RSI, then smoothed with an EMA-style filter (Baseline Smoothing) to form the baseline.
ATR Bands: Upper/Lower = baseline ± (ATR × Multiplier).
Flip Rule (Supertrend-like):
Close above upper band → bullish flip; trend line tracks the lower band (green).
Close below lower band → bearish flip; trend line tracks the upper band (red).
Between bands → prior trend line persists.
Signals/Alerts: A flip event generates a Buy/Sell signal and alert.
Best Use Cases
Trending Markets – Built to ride sustained moves in either direction.
Multiple Timeframes – Works from intraday to higher TFs; higher TFs usually produce cleaner flips.
Various Asset Classes – Forex, Indices, Stocks, Crypto, Commodities; ATR adapts to volatility.
Recommended Settings
Conservative (Lower Frequency)
RSI 14–20 • Baseline 34 • ATR 14–21 • Multiplier 1.8–2.2
Use for swing/position trading; calmer signal stream.
Balanced (Default)
RSI 14 • Baseline 26 • ATR 14 • Multiplier 1.4
Good general-purpose setup for swing or active intraday.
Aggressive (Higher Frequency)
RSI 10–14 • Baseline 13–21 • ATR 10–14 • Multiplier 1.1–1.3
For scalping/day trading; earlier but noisier flips.
🎨 Visual Elements
RSI Smooth baseline (soft blue)
Upper/Lower ATR Bands (faint blue)
Trend Line (Bull/Bear) drawn only in the active regime (green/red)
Optional Buy/Sell arrows and labels
⚠️ Important Notes
Signals on Close
Flips confirm on bar close. Intrabar crosses can revert; wait for confirmation.
Risk Management
Size positions appropriately; many traders trail beyond the opposite band/line.
Factor in spread, slippage, sessions, and news.
Confirmation & Testing
Combine with structure/volume/HTF bias if desired.
Backtest and forward-test per instrument and timeframe.
For research/education only; not financial advice.
TMA Bands with Break Arrow @ClearTradingMind
The "TMA Bands with Break Arrow" indicator, developed by ClearTradingMind, is designed to provide traders with insights into potential trend reversals based on the movement of price within a channel defined by the Triangular Moving Average (TMA) and its bands. The TMA is a smoothed moving average, and this indicator adds upper and lower bands to visualize potential breakouts.
Key Components:
1. TMA Bands: The indicator plots the upper and lower bands of the TMA channel. These bands represent potential overbought (upper band) and oversold (lower band) conditions.
2. Break Arrows: The indicator generates buy (green triangle up) and sell (red triangle down) arrows when the closing price breaks above the upper band or below the lower band, indicating a potential trend reversal.
3. Background Color: The background color dynamically changes based on the last generated signal. A blue background suggests a recent buy signal, while a red background indicates a recent sell signal. This provides a quick visual reference for the prevailing market sentiment.
Usage:
1. Trend Reversals: Traders can use the buy and sell arrows as signals for potential trend reversals. A buy signal suggests a possible upward trend, while a sell signal suggests a potential downward trend.
2. Channel Breakouts: Watch for price breaking above the upper band (buy signal) or below the lower band (sell signal). These breakouts may indicate the start of a new trend.
3. Volatility Analysis: The width of the TMA channel represents volatility. A widening channel suggests increased volatility, while a narrowing channel suggests decreasing volatility.
4. Background Color: The background color provides additional context. A blue background indicates recent bullish sentiment, while a red background suggests recent bearish sentiment.
Parameters:
- TMA Period: The number of bars used to calculate the Triangular Moving Average.
- ATR Period: The number of bars used to calculate the Average True Range (ATR) for determining the width of the TMA channel.
- ATR Multiplier: A multiplier applied to the ATR to determine the width of the TMA channel.
Note: This indicator is a tool to assist traders in their analysis, and it is recommended to use it in conjunction with other technical and fundamental analysis methods for more comprehensive decision-making.
Disclaimer: Trading involves risk, and this indicator does not guarantee profit. Users should conduct thorough analysis and risk management before making trading decisions.

VBE Pro - Advanced Volatility Bands with Zero Lag & PredictionVBE Pro: Zero-Lag Predictive Bands
A next-gen volatility envelope that blends zero-lag smoothing with forward-looking volatility models (EWMA/GARCH/HAR/ML) to keep bands tight in calm markets, responsive in shocks, and adaptive across regimes.
What it does
Builds volatility from multiple methods (ATR, StDev, Parkinson, Garman-Klass, Rogers-Satchell, Yang-Zhang).
Projects near-term vol with your choice of predictor, then blends it via a weight slider.
Applies zero-lag smoothing (ZLEMA/ZLMA/DEMA/TEMA/HMA/JMA/Ehlers/Kalman/T3) to cut delay without over-shoot.
Auto-adapts band width by regime (high/low/normal) and can expand dynamically with price acceleration.
Optional displacement to align with your execution style.
On-chart
Upper/Lower zero-lag bands with optional fill.
Middle line (ZL-smoothed source).
Regime-tinted background (High/Low).
Displacement marker (if used).
Compact top-right info table: current vs predicted vol, regime, squeeze, multiplier, methods, ZL gain, est. lag reduction.
Signals & Alerts
Break↑ / Break↓ when price crosses the bands.
Vol↑ / Vol↓ expansion/contraction sequences.
“Squeeze” when band width compresses vs its ZL average.
“ZL” marker when significant zero-lag is active.
Prediction divergence ⚠ when projected vol deviates > threshold.
Built-in alertconditions for all of the above.
Quick start
Method: ATR or Hybrid for robustness.
Smoothing: ZLEMA, length 5–8, ZL gain 2–3 (push higher only if you accept more projection).
Bands: Multiplier 2.0, Adaptive on, Dynamic off to start.
Prediction: EWMA, weight 0.25–0.35. Move to GARCH in mean-reverty tapes; HAR-RV for mixed regimes.
Regime lookback: 50.

Gamma + Fibonacci EMA Bands# Gamma + Fibonacci EMA Bands
## Overview
The Gamma + Fibonacci EMA Bands indicator combines two powerful analytical approaches: Gamma-weighted Exponential Moving Averages and Fibonacci sequence-based standard EMAs. This dual system creates a comprehensive "band" structure that helps identify trend direction, strength, and potential reversal zones with greater precision than single moving average systems.
## Features
- **Gamma-weighted EMAs**: Three customizable Gamma EMAs (fast-responding) with adjustable gamma parameters
- **Fibonacci Sequence EMAs**: Six standard EMAs based on the Fibonacci sequence (34, 55, 89, 144, 233, 377)
- **Visual Band Structure**: Color-coded for instant visual analysis
- **Trend Confirmation**: Multiple timeframe validation through varied moving average periods
- **Support/Resistance Identification**: Natural price reaction zones highlighted by EMA confluences
## How It Works
The indicator uses two complementary EMA systems:
1. **Gamma EMAs** (γ-EMAs) - These responsive moving averages use a direct gamma weighting factor (between 0-1) rather than a period length. Lower gamma values create smoother lines, while higher values create more responsive ones. These react quickly to price changes and serve as short-term trend indicators.
2. **Fibonacci EMAs** - These traditional EMAs use period lengths based on the Fibonacci sequence (34, 55, 89, 144, 233, 377). They provide longer-term trend context and naturally identify key support/resistance levels that align with market psychology.
## Interpretation
### Trend Direction
- When price is above all bands: Strong bullish trend
- When price is below all bands: Strong bearish trend
- When price is between bands: Consolidation or trend transition
### Support/Resistance
- Gamma EMAs (purple shades): Short-term dynamic support/resistance
- Fibonacci EMAs (orange/red shades): Stronger, longer-term support/resistance
### Trend Strength
- Wider band separation: Stronger trend momentum
- Compressed bands: Consolidation or trend weakness
### Reversal Signals
- Price breaking through multiple bands: Potential trend reversal
- Gamma EMAs crossing Fibonacci EMAs: Changing momentum
## Settings
- **Source**: Price data source (default: close)
- **Gamma 1**: Fast γ-EMA value (default: 0.2)
- **Gamma 2**: Medium γ-EMA value (default: 0.5)
- **Gamma 3**: Slow γ-EMA value (default: 0.8)
## Notes
This indicator works best on higher timeframes (1H+) and liquid markets. The Gamma-weighted EMAs provide faster signals while the Fibonacci sequence EMAs provide reliable support/resistance levels that often align with key market turning points.
For optimal use, watch for price interaction with these bands and how the bands interact with each other to confirm trend changes before they become obvious to the majority of market participants.
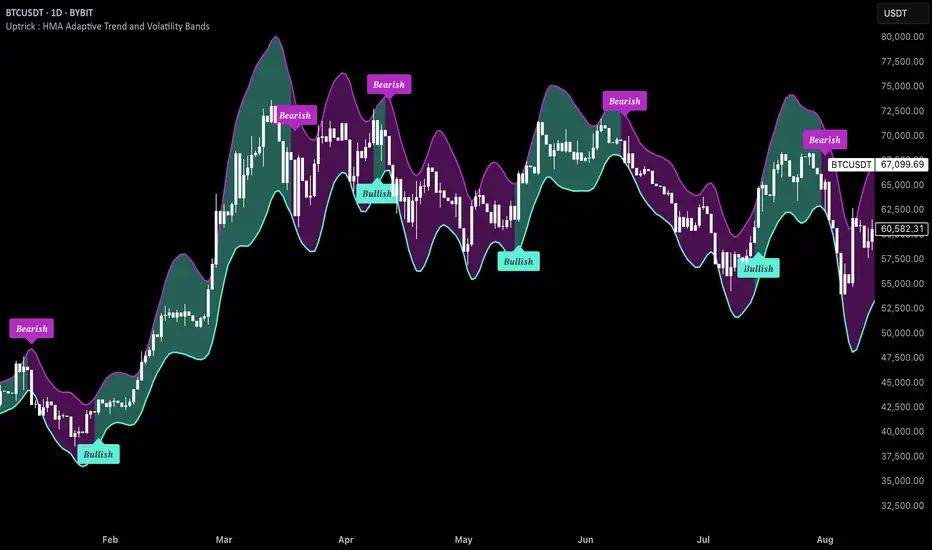
Uptrick : HMA Adaptive Trend and Volatility BandsThis proprietary trading indicator, named "Uptrick: HMA Adaptive Trend and Volatility Bands," offers a sophisticated blend of trend detection and volatility measurement for financial markets. Designed to overlay directly on the price chart, it leverages a variety of technical analysis tools to provide clear visual signals and comprehensive market insights.
Key Features:
Hull Moving Average (HMA) with Volatility Bands:
HMA Calculation: Utilizes the Hull Moving Average (HMA) for smooth trend identification, applied to the average price of high and low (hl2).
Adaptive Volatility Bands: Incorporates bands around the HMA based on a responsive standard deviation adjusted by an Exponential Moving Average (EMA). These bands dynamically expand and contract with market volatility.
Parameters:
Length: Configurable period for the HMA and standard deviation (default 14).
Multiplier: Determines the width of the bands (default 2.0).
MACD (Moving Average Convergence Divergence):
MACD Calculation: Includes fast and slow EMA periods with a signal line to detect trend direction and strength.
Histogram: Difference between MACD line and signal line to visualize momentum.
Parameters:
Fast Length: Short-term EMA period (default 6).
Slow Length: Long-term EMA period (default 13).
Signal Length: Signal line EMA period (default 5).
Relative Strength Index (RSI):
RSI Calculation: Measures the speed and change of price movements to identify overbought or oversold conditions.
Parameter:
RSI Length: Period for RSI calculation (default 10).
Average True Range (ATR):
ATR Calculation: Evaluates market volatility by considering the true range over a specified period.
Parameter:
ATR Length: Period for ATR calculation (default 7).
Volume and Liquidity Analysis:
Volume: Directly incorporated into the indicator to gauge market activity.
Liquidity: Assessed using the HMA of volume to determine the ease of trade execution.
Parameter:
Liquidity Length: Period for HMA of volume calculation (default 14).
Trend Identification:
Uptrend Conditions: A combination of positive MACD histogram, RSI above 50, ATR above its HMA, and volume exceeding liquidity.
Downtrend Conditions: Negative MACD histogram, RSI below 50, ATR above its HMA, and volume exceeding liquidity.
Visual Cues: Color-coded background (green for uptrend, red for downtrend) with corresponding labels on the price chart to indicate trend shifts.
Additional Moving Averages and Bollinger Bands:
SMA (Simple Moving Average): Includes 50 and 200-period SMAs for long-term trend analysis.
EMA (Exponential Moving Average): Includes a 20-period EMA for short-term trend analysis.
Bollinger Bands: Standard deviation bands around a 20-period SMA to measure market volatility and identify potential breakout points.
Information Table:
Real-Time Data Display: An optional table that provides current values for key metrics such as price, volume, liquidity, ATR, RSI, MACD histogram, SMAs, EMA, Buy+Sell Pressure, ATH, Global liquidity, Distance from ATH and Bollinger Bands, offering traders a comprehensive snapshot of market conditions.
Visualization:
Upper and Lower Bands: Clearly plotted with distinct colors (blue for upper, red for lower) to highlight volatility boundaries.
Trend Labels: Automatic annotations on the chart to signal uptrend and downtrend conditions.
Background Highlighting: Subtle shading to visually emphasize prevailing trend conditions.
This indicator is designed for traders seeking an advanced tool to detect trends, measure volatility, and make informed trading decisions based on comprehensive technical analysis. By integrating multiple technical indicators and providing clear visual signals, it aims to enhance trading accuracy and market insight.
deKoder | Ultra High Timeframe Moving Average & Log StDev BandsdeKoder | Ultra High Timeframe Moving Average & Log StDev Bands
Identify long-term statistical extremes and map the core trend with the deKoder | uHTF MA indicator. Designed for macro analysis, this tool uses ultra high timeframe moving averages and logarithmic standard deviation bands to frame price action, providing clear signals for when an asset is statistically cheap, fairly priced, or expensive.
KEY FEATURES
• Ultra High Timeframe (uHTF) Moving Average:
• Acts as a dynamic long term fair value equilibrium line. Choose from periods like 1-Year, 2-Year, or 'Long Time'.
• Select your MA type: SMA, EMA, Hull MA, or a Rolling VWAP .
• Automatically fetches optimal data (4H/D) for smoother plotting on lower timeframes.
• Probabilistic Logarithmic Bands:
• The bands are calculated using log-standard deviation , creating a framework that adapts to exponential growth. As such, your chart price scale should be set to log.
• ~68% of price action typically occurs between the ±1σ bands (fair value zone).
• Trading in the ±1σ to ±2σ channel is typical in a strongly trending market. Moves towards the ±3σ bands can indicate that the market is becoming overextended. Expect strong price moves here and pay attention for signs of reversal.
• Bitcoin Halving Timeline:
• Integrated vertical lines and labels for all Bitcoin halvings.
• Correlates technical extremes with fundamental scarcity events.
• 4-Year Cycle Visual Aid:
• The background color cycle highlights yearly changes.
• Red years have historically aligned with bear markets, while the subsequent green zone has marked accumulation phases.
• Note: The bands provide the primary information - the background color is a contextual guide based on historical patterns around the BTC 4 year halving cycle that may not persist in future. It's quite possible that the market will act differently going forward considering the new types participants such as ETFs and government reserve funds.
HOW TO USE & INTERPRET
• Fair Value & Extremes:
• Price between ±1σ Bands: The asset is trading within a statistically fair value range.
• Price at +2σ / +3σ Bands: The asset is statistically expensive. Statistically, the price is overextended in this region, although you do NOT want to fade it based only upon this information.
• Price at -2σ / -3σ Bands: The asset is statistically cheap. These zones have frequently coincided with the end of bear markets and profound long-term buying opportunities.
• Dynamic Support & Resistance:
• The uHTF MA and its bands tend to act as support and resistance areas of interest on daily, weekly and monthly charts.
INPUTS & CUSTOMIZATION
• Toggles : Master switch for the MA, Bands, and Halving markers.
• uHTF Moving Average Filter : Select instrument (default: BITSTAMP:BTCUSD), price source, MA length, and type.
• Colours : Fine-tune the appearance of all elements.
PRO TIPS
• While created for Bitcoin, this principle will work well on other high-growth assets and major indices.
• The most reliable signals occur on the Daily, Weekly and Monthly timeframes.
• This is a lagging, macro-filter indicator. It is not for timing short-term entries but for confirming the long-term trend and cycle phase.
"Be Fearful When Others Are Greedy and Greedy When Others Are Fearful." - The deKoder | uHTF MA is here to help you quantify that greed and fear on a macro scale.

Midpoint Line with Dynamic Bands, RSI Filter, and AlertsTitle: Midpoint Line with Dynamic Bands, RSI Filter, and Alerts
Description:
This Pine Script indicator provides a comprehensive analysis tool combining dynamic midpoint bands, RSI filtering, and alert conditions for overbought and oversold market states.
Features:
Dynamic Midpoint Bands:
Calculates the midpoint based on the highest high and lowest low over a user-defined lookback period.
Supports both percentage and fixed point offsets for the upper and lower bands.
Threshold Levels:
Defines overbought and oversold thresholds using a user-specified percentage.
RSI Filter:
Uses a 100-period RSI to filter market trends.
Plots candles in green if RSI > 50 and in red if RSI < 50.
Visual Overlays:
Fills the overbought area in red and the oversold area in green.
Plots green arrows below the bars when RSI > 50 and the price is in the oversold area.
Plots red arrows above the bars when RSI < 50 and the price is in the overbought area.
Alerts:
Generates alerts for potential long and short trading opportunities based on the defined conditions.
How to Use:
Customize the lookback period, percentage offset, fixed point offset, and threshold percentage as needed.
Use the RSI filter to identify the prevailing market trend.
Watch for visual signals (arrows) indicating potential buy or sell opportunities.
Set up alerts to receive notifications when long or short conditions are met.
This script provides traders with a robust tool for identifying key market conditions and making informed trading decisions. Customize the parameters to fit your trading strategy and use the visual cues and alerts to enhance your market analysis.

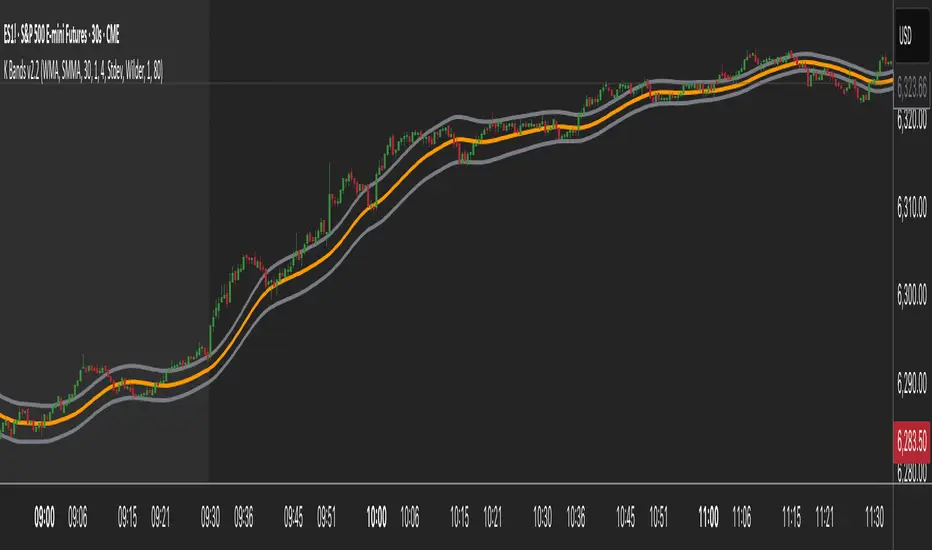
K Bands v2.2K Bands v2 - Settings Breakdown (Timeframe Agnostic)
K Bands v2 is an adaptive volatility envelope tool designed for flexibility across different trading
styles and timeframes.
The settings below allow complete control over how the bands are constructed, smoothed, and how
they respond to market volatility.
1. Upstream MA Type
Controls the core smoothing applied to price before calculating the bands.
Options:
- EMA: Fast, responsive, reacts quickly to price changes.
- SMA: Classic moving average, slower but provides stability.
- Hull: Ultra smooth, reduces noise significantly but may react differently to choppy conditions.
- GeoMean: Geometric mean smoothing, creates a unique, slightly smoother line.
- SMMA: Wilder-style smoothing, balances noise reduction and responsiveness.
- WMA: Weighted Moving Average, emphasizes recent price action for sharper responsiveness.
2. Smoothing Length
Lookback period for the upstream moving average.
- Lower values: Faster reaction, captures short-term shifts.
- Higher values: Smoother trend depiction, filters out noise.
3. Multiplier
Determines the width of the bands relative to calculated volatility.
- Lower multiplier: Tighter bands, more signals, but increased false breakouts.
- Higher multiplier: Wider bands, fewer false signals, more conservative.
4. Downstream MA Type
Applies final smoothing to the band plots after initial calculation.
Same options as Upstream MA.
5. Downstream Smoothing Length
Lookback period for downstream smoothing.
- Lower: More responsive bands.
- Higher: Smoother, visually cleaner bands.
6. Band Width Source
Selects the method used to calculate band width based on market volatility.
Options:
- ATR (Average True Range): Smooth, stable bands based on price range expansion.
- Stdev (Standard Deviation): More reactive bands highlighting short-term volatility spikes.
7. ATR Smoothing Type
Controls how the ATR or Stdev value is smoothed before applying to band width.
Options:
- Wilder: Classic, stable smoothing.
- SMA: Simple moving average smoothing.
- EMA: Faster, more reactive smoothing.
- Hull: Ultra-smooth, noise-reducing smoothing.
- GeoMean: Geometric mean smoothing.
8. ATR Length
Lookback period for smoothing the volatility measurement (ATR or Stdev).
- Lower: More reactive bands, captures quick shifts.
- Higher: Smoother, more stable bands.
9. Dynamic Multiplier Based on Volatility
Allows the band multiplier to adapt automatically to changes in market volatility.
- ON: Bands expand during high volatility and contract during low volatility.
- OFF: Bands remain fixed based on the set multiplier.
10. Dynamic Multiplier Sensitivity
Controls how aggressively the dynamic multiplier responds to volatility changes.
- Lower values: Subtle adjustments.
- Higher values: More aggressive band expansion/contraction.
K Bands v2 is designed to be adaptable across any market or timeframe, helping visualize price
structure, trend, and volatility behavior.
MegaGas Bollinger Bands with Divergence and Circle SignalsIndicator: MegaGas Bollinger Bands with Divergence and Circle Signals
This script provides a powerful combination of Bollinger Bands, RSI Divergence detection, and signal visualization tools. Designed with flexibility and precision in mind, it aims to assist traders in identifying trend reversals, volatility zones, and divergence-based trading opportunities. The script is well-suited for swing trading, momentum trading, and even scalping when adapted to lower timeframes.
How It Works:
Bollinger Bands:
Bollinger Bands are used to detect price volatility and overbought/oversold conditions. The script calculates:
Basis Line: A 34-period Simple Moving Average (SMA) as the core trend line.
Upper Bands: Bands positioned 1x and 2x the standard deviation above the SMA.
Lower Bands: Bands positioned 1x and 2x the standard deviation below the SMA. These levels provide dynamic support and resistance zones, highlighting breakout and reversion opportunities.
RSI Divergence Detection:
The indicator detects bullish divergence (when RSI forms a higher low while price forms a lower low) and bearish divergence (when RSI forms a lower high while price forms a higher high). These divergences often precede significant reversals or momentum shifts.
Bullish divergence is displayed with blue triangles (up).
Bearish divergence is displayed with orange triangles (down).
Buy and Sell Signals:
Circle Signals are generated when price crosses key Bollinger Bands levels:
A green circle appears when the price crosses above the lower band (potential buy signal).
A red circle appears when the price crosses below the upper band (potential sell signal).
These signals help identify potential entry and exit points for trades, particularly in trend-following or mean-reversion strategies.
Trend Reference (Moving Average):
A 50-period Simple Moving Average (SMA) is included as a trend reference, helping traders gauge the overall market direction. Use this to confirm divergence signals and avoid trades against the prevailing trend.
Why This Indicator Is Unique:
This script integrates multiple tools in a meaningful way, emphasizing contextual trading signals. Unlike standalone Bollinger Bands or RSI indicators, it introduces:
Advanced Divergence Analysis: Enhancing traditional RSI with divergence-based alerts.
Dynamic Signal Filtering: Preventing repetitive signals by introducing state-based logic for circles and divergence signals.
Trend Alignment: Combining Bollinger Bands with an SMA to filter trades based on the prevailing trend.
How to Use:
Setup:
Apply the indicator to any chart and timeframe. For swing trading, higher timeframes like 4H or 1D are recommended.
Adjust the RSI, Bollinger Bands, and Moving Average lengths to match your strategy and asset.
Signals:
Look for divergence signals (triangles) as early warnings of trend reversals. Confirm these with price action or other tools.
Use circle signals (green/red) to time potential entries/exits around Bollinger Band extremes.
Confirmation:
Combine divergence and circle signals with the SMA line to avoid counter-trend trades. For example, take bullish signals when the price is above the SMA and bearish signals when it is below.
Chart Clarity:
The script is published with a clean chart for clarity. It visualizes all signals with distinct shapes (triangles and circles) and colors, ensuring they are easily recognizable. Bollinger Bands and the SMA are plotted with transparency to avoid clutter.
Originality:
This script is a thoughtful blend of Bollinger Bands and RSI divergence detection, carefully designed to provide traders with actionable insights. It introduces state-based logic to manage repetitive signals and seamlessly integrates trend filtering, making it a valuable tool for both novice and experienced traders.

Dynamic Adaptive Regression BandsThis script provides a dynamic adaptive regression band indicator that adjusts based on recent market volatility. The regression bands are calculated using a length parameter adapted to the ATR (Average True Range) to ensure responsiveness to market conditions.
Key Features:
Dynamic Length Adjustment: The length of the regression calculation is adjusted based on the ATR to reflect current market volatility.
Multiple Bands: The script plots upper and lower bands at different ratios (1.618, 2.618, and 4.236) to provide comprehensive support and resistance levels.
Detailed Fillings: The areas between bands are filled with different colors to visualize different levels of volatility and trend strength.
Usage:
Regression Line: The main regression line follows the general trend of the price.
Upper/Lower Bands: These bands represent volatility-adjusted support and resistance levels.
Extended Bands: Additional bands at different ratios provide extended support and resistance zones for further trend analysis.
Original Script Credit:
This script is inspired by the original "Regr Linear Bands" script by MarcoValente, published on Jan 15, 2017. The original script starts from a linear regression and uses Fibonacci parameters to add bands above and below. The original work incorporates range and volatility, making the price move between bands of the same color. The middle line (linear regression) serves as a good signal; after a break occurs, the price typically moves to the last or second last band.

True Market Mean BandsIntroducing the "True Market Mean Bands" (TMMB) , a technical analysis tool designed for Bitcoin. TMMB provides a model of market valuation by integrating the concept of Vaulted Realized Price with dynamic volatility bands, offering traders insights into potential market movements.
Core Concept and Utility:
The TMMB centers around the Vaulted Realized Price, an advanced metric that refines the realized price by accounting for Bitcoin that is "vaulted" - or held out of active circulation. This metric offers a deeper understanding of market valuation by considering not just the last transaction prices but also the long-term holding behaviors of investors.
Innovative Bands:
Building on this core concept, the TMMB introduces multiple bands that reflect market volatility and supply dynamics. These bands are derived using a combination of statistical analysis and customizable multipliers, allowing for adaptation to varying market conditions. The bands include:
Standard Deviation Bands: Adjusted for market volatility, providing a dynamic measure of overbought and oversold conditions.
Vaulted Realized Price Multiplier Bands: These bands use multipliers inspired by the price distribution around the mean, aligning with key psychological and mathematical levels in the market.
Technical Insight:
At the heart of TMMB lies a robust calculation framework that leverages:
Security Function: To fetch relevant market data, ensuring real-time accuracy and relevance.
Customizable Multipliers: Allowing users to adjust the sensitivity of the bands according to their trading strategies.
Statistical Analysis: Utilizing standard deviation and mean calculations to dynamically adapt the bands to market conditions.
Originality and Usefulness:
The TMMB stands out by offering a unique perspective on Bitcoin's market valuation, taking into account long-term holding patterns which are often overlooked in traditional indicators. This approach not only enriches market analysis but also provides traders with actionable insights, potentially enhancing trading strategies.
Application and Value:
TMMB is especially useful for traders and analysts looking for a deeper understanding of market dynamics, beyond surface-level price movements. It offers a valuable tool for identifying potential entry and exit points, assessing market sentiment, and making informed trading decisions.
