Dynamic Pivot Point [MarkitTick]Title: Dynamic Pivot Point MarkitTick
Concept
Unlike traditional Pivot Points, which plot static horizontal levels based on the previous period's High, Low, and Close, this script introduces a dynamic element by applying an Exponential Moving Average (EMA) to the calculated pivot levels. This approach allows the Support and Resistance zones to adapt more fluidly to recent price action, reducing the jagged steps often seen in standard multi-timeframe pivot indicators.
How It Works
The script operates in two distinct phases of calculation:
1. Data Extraction and Core Math:
The indicator first requests the High, Low, and Close data from a user-defined timeframe (e.g., Daily, Weekly). Using this data, it calculates the standard Pivot Point (P) alongside three levels of Support (S1, S2, S3) and three levels of Resistance (R1, R2, R3) using standard geometric formulas:
Pivot = (High + Low + Close) / 3
R1 = 2 * Pivot - Low
S1 = 2 * Pivot - High
(Subsequent levels follow standard Floor Pivot logic).
2. Dynamic Smoothing:
Instead of plotting these raw values directly, the script processes each calculated level (P, S1-S3, R1-R3) through an Exponential Moving Average (EMA). The length of this EMA is controlled by the Pivot Length input. This smoothing process filters out minor volatility and creates curved, dynamic trajectories for the pivot levels rather than static straight lines.
How to Use
Traders can use this tool to identify dynamic areas of interest where price may react.
The White Line represents the Central Pivot. Price action relative to this line helps determine the immediate bias (above for bullish, below for bearish).
Green Lines (Support 1, 2, 3) indicate potential demand zones where price may bounce during a downtrend.
Red Lines (Resistance 1, 2, 3) indicate potential supply zones where price may reject during an uptrend.
Because the levels are smoothed, they can also act as dynamic trend followers, similar to moving averages, but derived from pivot geometry.
Settings
Show Pivot Points: Toggles the visibility of the plot lines on the chart.
Pivot Length: Defines the lookback period for the EMA smoothing applied to the pivot levels. A higher number results in smoother, slower-reacting lines.
Timeframe: Determines the timeframe used for the underlying High/Low/Close data (e.g., selecting "D" calculates pivots based on Daily data while viewing a lower timeframe chart).
Disclaimer This tool is for educational and technical analysis purposes only. Breakouts can fail (fake-outs), and past geometric patterns do not guarantee future price action. Always manage risk and use this tool in conjunction with other forms of analysis.
Recherche dans les scripts pour "bear"

Day Trading MA Crossover IndicatorDay Trading MA Crossover Indicator Overview The Day Trading MA Crossover Indicator is a simple yet effective tool designed for day traders to identify potential buy and sell opportunities based on moving average crossovers. It plots two customizable moving averages on your chart and generates clear visual signals when they cross, helping you spot trend reversals or continuations in fast-paced markets.This indicator is ideal for intraday trading on lower timeframes (e.g., 5-min, 15-min charts) but can be adapted for swing trading or higher timeframes. It's built with flexibility in mind, allowing you to tweak the MA lengths and types to suit your strategy.Key FeaturesMoving Average Crossovers: Generates "BUY" signals when the fast MA crosses above the slow MA (potential bullish entry) and "SELL" signals when it crosses below (potential bearish entry or exit).
Visual Signals: Green "BUY" labels below bars for long entries and red "SELL" labels above bars for short entries or exits. Optional subtle background coloring highlights signals for quick spotting.
Customizable Parameters:Fast MA Length (default: 9): Period for the shorter moving average.
Slow MA Length (default: 21): Period for the longer moving average.
MA Type (default: EMA): Choose between SMA (Simple), EMA (Exponential), or WMA (Weighted) for different smoothing behaviors.
Overlay Mode: Plots directly on your price chart without cluttering separate panes.
Lightweight and Efficient: Minimal computation for real-time performance on TradingView.
How It WorksMoving Averages Calculation: The indicator computes two MAs based on your selected type and lengths using closing prices.
Signal Detection: A buy signal triggers on an upward crossover (fast MA > slow MA), indicating potential momentum shift to the upside. A sell signal triggers on a downward crossunder (fast MA < slow MA), signaling possible downside momentum.
Visual Aids: Signals appear as labeled shapes with optional background tints to emphasize key bars.
Usage TipsFor Day Trading: Apply on volatile instruments like forex pairs, stocks, or crypto. Combine with support/resistance levels or other indicators (e.g., RSI for overbought/oversold confirmation) to filter false signals in ranging markets.
Backtesting: Test on historical data to optimize MA lengths for your asset—shorter periods for aggressive trading, longer for smoother trends.
Risk Management: Always use stop-losses and position sizing. Signals are not foolproof and work best in trending conditions.
Customization: Adjust inputs via the indicator settings panel after adding it to your chart.
Example SetupOn a 5-min EUR/USD chart: Use EMA (9/21) for quick crossovers. Look for buy signals above key support with increasing volume.
Avoid choppy markets where frequent false crossovers ("whipsaws") can occur.
This indicator is provided for educational and informational purposes only. It is not financial advice, and past performance does not guarantee future results. Trading involves risk; consult a professional advisor before using any strategy. If you have feedback or suggestions for improvements, feel free to comment!

VWAP Market FlowVWAP Flow Model
VWAP Flow Model is a VWAP-anchored market context indicator designed to help traders understand how price is behaving relative to fair value.
It evaluates the interaction between price, VWAP (Volume-Weighted Average Price), volatility, and momentum to classify prevailing market conditions such as trend continuation, expansion, mean reversion, and momentum decay.
Rather than issuing trade signals, the indicator focuses on identifying market state and execution quality.
Core framework:
-Adaptive VWAP with slope-based colouring
-VWAP acts as the central fair-value reference.
The VWAP line dynamically changes colour based on its slope:
-Rising VWAP → bullish pressure
-Falling VWAP → bearish pressure
-Flattening VWAP → balance, compression, or rotation
This allows traders to quickly assess directional bias and determine whether price movement is supported by underlying flow or occurring in a lower-quality environment.
Signal labels:
The indicator annotates key behavioural transitions to support visual interpretation of market state:
-IGN (Ignition) — Momentum expansion emerging from compression or balance, often marking the start of a directional move.
-CON (Continuation) — Price sustaining directional behaviour in alignment with VWAP slope.
-REV (Reversion) — Mean-reversion behaviour as price returns toward VWAP after extension.
-EXH (Exhaustion) — Loss of momentum or absorption after an extended move, often preceding rotation or regime change.
-MON (Displacement) — High-energy expansion bars indicating strong participation and structural shift.
These labels describe market behaviour, not trade instructions, and should be interpreted within the broader VWAP context.
Market behaviour classification:
The model continuously evaluates how price interacts with VWAP to determine whether the market is:
-directional and trending
-rotating around fair value
-accelerating away from value (expansion)
-losing momentum or showing signs of exhaustion
Classifications are derived from price displacement, volatility conditions, and momentum quality, rather than simple crossovers.
Filtering and control logic:
-Trend / Volatility Filter
Conditions market-state classification on the prevailing volatility and structural regime, helping prevent unstable or low-quality environments from producing misleading context shifts.
-Cooldown Filter
Enforces a minimum number of bars between classification updates to reduce rapid state-flipping in choppy conditions and keep context stable.
-Minimum Bars Between Signals
Controls the strictness of the cooldown logic.
Lower values increase responsiveness; higher values favour cleaner, more stable context changes.
-Tape Dominance Requirement (IGN)
Optional confirmation that requires directional signed-volume pressure to align with price behaviour before ignition-style classifications are allowed, helping distinguish genuine impulsive moves from weak or mechanically driven spikes.
-Tape Dominance Lookback
Defines the evaluation window used by the tape dominance filter.
Shorter lookbacks react faster; longer lookbacks require sustained participation.
Sensitivity and session controls:
Sensitivity modes adjust how responsive the model is to changing conditions:
-Aggressive — faster, more reactive (lower timeframes)
-Balanced — default intraday calibration
-Sniper — stricter thresholds, fewer but higher-quality classifications
Optional session filters allow the model to operate only during selected trading sessions, helping traders focus on higher-liquidity periods and avoid low-efficiency hours.
How to use it:
VWAP Flow Model is used as a context and confirmation layer, not a signal generator:
-Trade in the direction of VWAP slope during directional phases
-Expect mean reversion when price extends far from VWAP in balanced conditions
-Treat strong acceleration away from VWAP as expansion rather than chop
-Use flattening VWAP as an early warning of rotation or momentum loss
It integrates naturally with price action, structure-based analysis, and volume-aware workflows.
Indicator scope:
VWAP Flow Model provides objective market context and behavioural classification.
It does not generate direct trade signals and is designed to support discretionary decision-making.
Important notes:
Market classifications are probabilistic, not guarantees
Past behaviour does not imply future results
This indicator is a decision-support tool, not an automated trading system

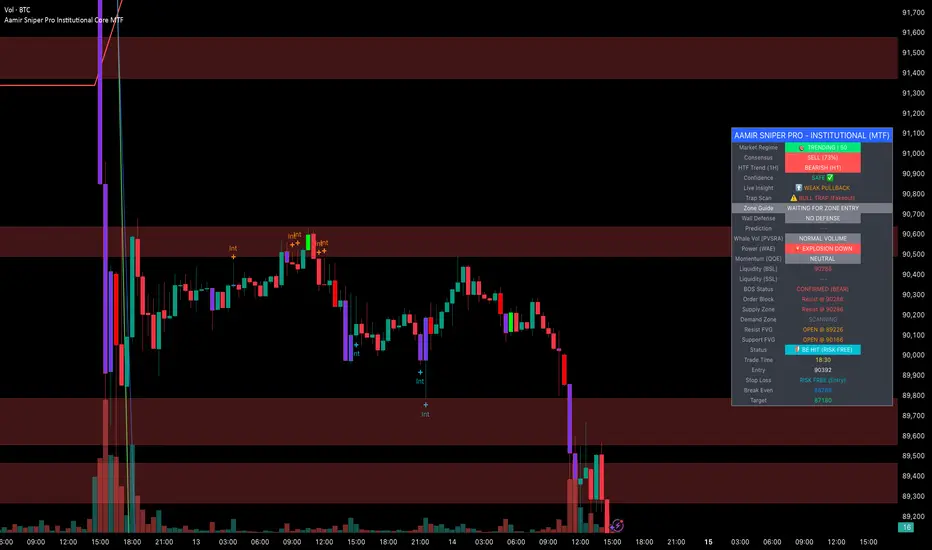
Aamir Sniper Pro Institutional Core MTFConcept & Utility: This script is a comprehensive "Multi-Factor Confluence System" designed to filter out market noise by requiring agreement between Trend, Momentum, Volatility, and Market Structure before generating a signal.
Many traders struggle with false signals generated by single indicators. This script solves that problem by using a Consensus Engine. Instead of relying on just one moving average or oscillator, this script aggregates data from over 20 different technical methods. It then applies strict filters (WAE, ADX, and MTF) to ensure that trades are only suggested during high-probability market conditions.
How the Components Work Together:
1. The Consensus Engine (The Core Logic): At the heart of the script is a voting system. It calculates the slope and direction of:
Fast/Slow EMAs, SMAs, WMAs, and Hull MA.
Ichimoku Cloud (Baseline/Conversion line).
SuperTrend and Parabolic SAR.
Oscillators (RSI, Stochastic, CCI).
Result: It generates a "Consensus Score" (0-100%). A signal is ONLY considered if the Bullish or Bearish score exceeds the user-defined threshold (Default: 70%).
2. The Filtering Layers (Why this is not just a mashup): A high consensus score alone is not enough. The script validates the signal through three mandatory filters:
Volatility Filter (WAE): Uses Waddah Attar Explosion logic to ensure there is enough volume/power to sustain the move.
Regime Filter (ADX): Checks the Average Directional Index. If the market is choppy (ADX < 25), the signal is blocked to prevent whipsaws.
MTF Filter: Checks the trend on a Higher Timeframe (Default: 1 Hour). It forces the user to trade only in the direction of the dominant trend.
3. Structural Context (SR Zones): We have integrated Dynamic Support & Resistance Zones based on Pivot Points.
Purpose: This provides immediate structural context. Even if the Consensus Engine gives a "BUY" signal, the trader can see if price is currently sitting at a "Resistance Box." This visual aid prevents buying into supply or selling into demand.
4. Institutional Volume (PVSRA): Candles are colored based on Volume Spread Analysis (PVSRA) concepts.
Purple/Blue Candles: Indicate "Whale Activity" (Volume > 200% of average). This helps confirm if institutional money is backing the move identified by the Consensus Engine.
5. Momentum Confirmation (QQE): The Qualitative Quantitative Estimation (QQE) is displayed on the dashboard to confirm short-term momentum direction, acting as the final trigger.
Features:
Sniper Mode: Option to wait for a candle retest before entry.
Dashboard: Displays the live Consensus Score, Market Regime, and Trend Status.
Risk Management: Auto-calculates SL/TP based on Swing High/Low or ATR.
Credits & Attribution:
WAE Logic: Adapted from the work of Waddah Attar.
PVSRA: Volume concepts adapted from the Traderathome/PVSRA community.
QQE: Adapted from standard open-source logic.
SR Zones: Logic derived from standard Pivot Point calculations.
INSTITUTIONAL VOLUME PROFILE + FIBONACCI + ENHANCED SIGNALS🎯 INSTITUTIONAL VOLUME PROFILE + FIBONACCI + ENHANCED SIGNALS
A professional-grade indicator combining Volume Profile analysis, Fibonacci retracements, Anchored VWAP, and intelligent signal filtering to identify high-probability institutional positioning and trade setups.
📊 CORE FEATURES
▸ Volume Profile with POC (Point of Control)
- Visualizes where institutional volume accumulated
- Identifies High Volume Nodes (HVN) as key support/resistance
- Shows Value Area (70% volume zone) for market equilibrium
▸ Dynamic Fibonacci Levels
- Auto-detects swing high/low for retracement levels
- Golden Pocket (0.618-0.65) highlight zone
- Bull/bear direction recognition
▸ Anchored VWAP
- Anchored to swing range start
- Institutional mean reversion baseline
- Real-time trend bias indicator
▸ Graded Signal System (A+/B/C)
- A+ Signals: High probability setups (VWAP cross + POC alignment)
- B Signals: Above-average quality (VWAP cross above POC)
- C Signals: Lower probability (counter-trend setups)
🎮 DISPLAY MODES
⚡ TRADING LIVE MODE
- Clean chart showing only A+ signals
- Minimal visual noise for active trading
- Perfect for intraday execution
📈 FULL OVERVIEW MODE
- Complete analysis with all zones visible
- Volume Profile + Fibonacci + Value Area
- All signal grades displayed
- Statistics dashboard
🔬 ADVANCED SIGNAL FILTERS
✓ Volume Confirmation
- Requires above-average volume on signals
- Filters out weak institutional participation
- Configurable volume multiple (default 1.2x)
✓ Momentum Filter
- Ensures price momentum aligns with signal direction
- Prevents counter-trend entries
- Configurable lookback period
✓ SR Proximity Upgrade ⭐ GAME CHANGER
- Automatically upgrades B/C signals to A+ when near key levels
- Detects proximity to POC and HVN zones
- Combines technical confluence for best setups
🔔 SMART ALERTS
▸ Configurable alerts for A+, B, or C signals
▸ Real-time notifications to your device
▸ No need to watch charts constantly
▸ "Once per bar close" prevents repainting
💡 HOW TO USE
FOR DAY TRADING:
1. Switch to "Trading Live" mode
2. Enable only A+ alerts
3. Set filters: Volume 1.5x, Momentum ON, Proximity 0.3%
4. Trade only A+ signals at key levels
FOR SWING TRADING:
1. Use "Full Overview" mode
2. Analyze Value Area and Fibonacci confluence
3. Set filters: Volume 1.2x, Momentum ON, Proximity 0.8%
4. Enter on A+ signals with multi-timeframe confirmation
FOR ANALYSIS:
1. Full Overview mode with all visuals enabled
2. Disable filters to see all raw signals
3. Study how institutions positioned at key zones
4. Plan trades around POC and Value Area
⚙️ RECOMMENDED SETTINGS
5-15 MIN CHARTS (Scalping):
- Lookback: 200-300 bars
- Volume: 1.5x, Momentum: 5 bars, Proximity: 0.3%
- Trading Live mode + A+ alerts only
1 HOUR CHARTS (Intraday):
- Lookback: 300 bars
- Volume: 1.3x, Momentum: 3 bars, Proximity: 0.5%
- Full Overview or Trading Live
4 HOUR CHARTS (Swing):
- Lookback: 300-500 bars
- Volume: 1.2x, Momentum: 3 bars, Proximity: 0.8%
- Full Overview mode
DAILY CHARTS (Position):
- Lookback: 300-500 bars
- Volume: 1.1x, Momentum: 2 bars, Proximity: 1.0%
- Full Overview mode
📈 KEY CONCEPTS
POC (Point of Control): Price level with highest volume - acts as magnet
Value Area: Zone containing 70% of volume - equilibrium range
HVN: High Volume Nodes - institutional accumulation zones
AVWAP: Anchored VWAP - institutional average entry price
Golden Pocket: 0.618-0.65 Fib zone - highest probability reversal area
🎯 TRADING STRATEGY TIPS
1. Wait for A+ signals - quality over quantity
2. Best setups occur at POC or Value Area boundaries
3. Use multiple timeframes for confirmation
4. Combine with your own risk management rules
5. Signals are high probability, not guaranteed - always use stops

PURNA STOCK2. Candle Analysis:
Candle Strength (body ratio)
Doji Patterns - Indecision
Strong Candle (>60% body) - Momentum kuat
3. Position Analysis:
Near Resistance - Potensi rejection
Near Support - Potensi rebound
Mid Range - Netral
4. Trend Analysis:
Strong Bullish (EMA gap > 2%)
Strong Bearish (EMA gap < -2%)
Moderate Trend
5. Market Predictions:
🚀 PUMP POTENTIAL - Volume extreme + candle kuat + bullish
📈 REBOUND EXPECTED - Volume kuat + near support
⚡ BREAKOUT WATCH - Volume spike + near resistance
🔻 DUMP WARNING - Volume extreme + red candle kuat
📉 REJECTION CONFIRMED - Volume kuat + rejection resistance
😴 SIDEWAYS/SLEEP - Volume rendah

APS - Sweeps & BOSThis indicator identifies pivot highs and lows, detects liquidity sweeps, and marks Break of Structure (BOS).
Key Features:
1) Pivot Detection :
The script uses configurable left and right bar parameters to identify significant pivot highs and lows, marking them with "X" labels on the chart. These pivots represent potential areas where price may react.
2) Sweep Detection :
A sweep occurs when price temporarily moves beyond a previous pivot level but closes back inside, suggesting a liquidity grab or stop hunt. The indicator draws horizontal lines connecting the original pivot to the sweep location and labels these events. Sweeps often precede reversals as they collect liquidity before moving in the opposite direction.
3) Break of Structure (BOS) :
BOS events are marked when price closes beyond a previous pivot level, indicating a potential shift in market structure. Bullish BOS occurs when price closes above a pivot high, while Bearish BOS occurs when price closes below a pivot low. These can signal continuation moves or trend changes.
4) Previous Day High/Low (PDH/PDL):
The indicator tracks the previous session's high and low (based on 6 PM ET session breaks, which auto-adjusts for DST) and displays whether these levels have been breached. It also calculates and displays a 50% equilibrium line between PDH and PDL.
5) Higher Timeframe Context :
A table in the top-right corner shows whether the higher timeframe close is in premium (above equilibrium) or discount (below equilibrium) territory. The HTF automatically adjusts based on your current timeframe.
6) Customization Options:
Adjustable pivot sensitivity (left/right bars)
Configurable sweep lookback period
Customizable colors, line styles, and label sizes for all elements
Toggle visibility for any component
Optional alerts for sweeps and BOS events
How to Use:
Sweeps near support/resistance often indicate liquidity grabs before reversals
BOS events can confirm directional bias changes
Use PDH/PDL levels as reference points for intraday trading
Consider HTF context when taking trades (discount zones for longs, premium zones for shorts)
Important Notes:
This indicator is designed for educational purposes and market analysis. Past patterns do not guarantee future results. Please follow proper risk management.

VWMA CloudA volume-weighted moving average (VWMA) cloud consisting of fast and slow VWMAs. The lines are dynamically colored based on their relative positions, forming a visual cloud that highlights bullish and bearish trends.
A normal moving average (SMA or EMA) weights prices equally (or by recency) and ignores volume, so it reacts the same regardless of how much trading occurred. A volume-weighted moving average (VWMA) weights each price by its trading volume, so high-volume moves shift the average more and low-volume moves shift it less. This makes VWMA more representative of where the market is actually trading and filters out weak, low-participation moves.

KIMATIX LITE Delta ProfileThis indicator provides a clean, market-structure view of where participation concentrates and which side is in control across price levels.
The Lite version is intentionally reduced to focus on context over execution while keeping the visual identity of the full profile.
What is shown
Sentiment Profile (right side)
Displays directional dominance at each price level:
Bullish rows when buying pressure dominates
Bearish rows when selling pressure dominates
Point of Control (POC)
Value Area High / Low (VAH / VAL)
Lite Version
No left-side volume profile
No delta labels or historical delta tracking
No lower-timeframe or orderflow proxy
No alerts or event notifications
No visible-range logic or advanced controls
All calculations run on the chart timeframe only, making this version lighter and suitable for public use while preserving structural relevance.
Intended use
This indicator is designed to:
Identify high-interest price zones
Assess directional pressure at each level
Support bias and location decisions
Complement other execution or confirmation tools
It is not an entry or signal system and does not provide trade timing.
The full version is distributed separately.
More information can be found here:
whop.com

Market Energy & Direction DashboardMarket Energy & Direction Dashboard - Daytrading
Overview
A comprehensive real-time market internals dashboard that combines NYSE TICK, NYSE Advance-Decline (ADD) momentum, VIX direction, and relative volume into a single visual traffic light system with intelligent signal synthesis. Designed for active daytraders who need instant confirmation of market direction and energy based on momentum alignment across all major internals.
What It Does
This indicator synthesizes multiple market internals using directional momentum analysis rather than static thresholds to provide clear, actionable signals:
• Traffic Light System: Single glance confirmation of market state
o Bright Green: Maximum bullish - all internals aligned (TICK + ADD rising + VIX falling + volume)
o Bright Red: Maximum bearish - all internals aligned (TICK + ADD falling + VIX rising + volume)
o Yellow: Exhaustion warning - TICK at extremes, potential reversal imminent
o Moderate Colors: Partial alignment - some confirmation but not complete
o Gray: Choppy, neutral, or conflicting signals
• Real-Time Dashboard displays:
o Current TICK value with exhaustion warnings
o Current ADD with directional momentum indicator (↑ rising = breadth improving, ↓ falling = breadth deteriorating, ± compression)
o VIX level with directional indicator (↓ declining = bullish, ↑ rising = bearish, ± compression = neutral)
o Relative volume (current vs 20-period average)
o Composite status message synthesizing all data into clear directional summary
Key Features
✓ Momentum-based analysis - all indicators show direction/change, not just levels ✓ Intelligent signal hierarchy from "Maximum" to "Moderate" based on internal alignment ✓ ADD directional momentum - catches breadth shifts early, works in all market conditions ✓ VIX directional analysis - shows if fear is increasing, decreasing, or stagnant ✓ Color-coded traffic light for instant decision making ✓ Detects TICK/ADD divergences (conflicting signals = caution) ✓ Exhaustion warnings at extreme TICK levels (±1000+) ✓ Composite status messages - "Maximum Bull", "Strong Bull", "Moderate Bull", etc. ✓ Customizable thresholds for all parameters ✓ Moveable dashboard (9 position options) ✓ Built-in alerts for all signal strengths, exhaustion, and divergences
How To Use
Setup:
1. Add indicator to your main trading chart (SPY, ES, NQ, etc.)
2. Default settings work well for most traders, but you can customize:
o TICK Extreme Level (default 1000)
o ADD Compression Threshold (default 100 - detects when breadth is stagnant)
o VIX Elevated Level (default 20)
o VIX Compression Threshold (default 2% - detects low volatility)
o Volume Threshold (default 1.5x average)
3. Position dashboard wherever convenient on your chart
Reading The Signals:
Signal Hierarchy (Strongest to Weakest):
MAXIMUM SIGNALS ⭐ (Brightest colors - All 4 internals aligned)
• "✓ MAXIMUM BULL": TICK bullish + ADD rising (↑) + VIX falling (↓) + Volume elevated
o This is the holy grail setup - all momentum aligned, highest conviction longs
• "✓ MAXIMUM BEAR": TICK bearish + ADD falling (↓) + VIX rising (↑) + Volume elevated
o Perfect storm bearish - all momentum aligned, highest conviction shorts
STRONG SIGNALS (Bright colors - Core internals aligned)
• "✓ STRONG BULL": TICK bullish + ADD rising (↑)
o Strong confirmation even without VIX/volume - breadth supporting the move
• "✓ STRONG BEAR": TICK bearish + ADD falling (↓)
o Strong confirmation - both momentum and breadth deteriorating
MODERATE SIGNALS (Faded colors - Partial confirmation)
• "MODERATE BULL": TICK bullish but ADD not confirming direction
o Proceed with caution - momentum present but breadth questionable
• "MODERATE BEAR": TICK bearish but ADD not confirming direction
o Proceed with caution - selling but breadth not fully participating
WARNING SIGNALS
• "⚠ EXHAUSTION" (Yellow): TICK at ±1000+ extremes
o Potential reversal zone - prepare to fade or take profits
o Often marks blow-off tops or capitulation bottoms
NEUTRAL/AVOID
• "CHOPPY/NEUTRAL" (Gray): Conflicting signals or low conviction
o Stay out or reduce size significantly
Individual Indicator Interpretation:
TICK:
• Green: Bullish momentum (>+300)
• Red: Bearish momentum (<-300)
• Yellow: Exhaustion (±1000+)
• Gray: Neutral
ADD (Advance-Decline):
• Green (↑): Breadth improving - more stocks participating in the move
• Red (↓): Breadth deteriorating - fewer stocks participating
• Gray (±): Breadth stagnant - no clear participation trend
VIX:
• Green (↓): Fear declining - healthy environment for rallies
• Red (↑): Fear rising - risk-off mode, supports downward moves
• Gray (±): Volatility compression - often precedes explosive moves
Volume:
• Green: High conviction (>1.5x average)
• Gray: Low conviction
Trading Strategy:
1. Wait for "MAXIMUM" or "STRONG" signals for highest probability entries
o Maximum signals = go full size with confidence
o Strong signals = good conviction, normal position sizing
2. Confirm directional alignment:
o For longs: Want ADD ↑ (rising) and VIX ↓ (falling)
o For shorts: Want ADD ↓ (falling) and VIX ↑ (rising)
3. Use exhaustion warnings (yellow) to:
o Take profits on existing positions
o Prepare counter-trend entries
o Tighten stops
4. Avoid "MODERATE" signals unless you have strong conviction from other analysis
o These work best as confirmation for existing setups
o Not strong enough to initiate new positions alone
5. Never trade "CHOPPY/NEUTRAL" signals
o Gray means stay out - preserve capital
o Wait for clear alignment
6. Watch for divergences:
o Price making new highs but ADD ↓ (falling) = distribution warning
o Price making new lows but ADD ↑ (rising) = potential bottom
o Divergence alert will notify you
Best Practices:
• Use on 1-5 minute charts for daytrading
• Combine with your price action or technical setup (support/resistance, trendlines, patterns)
• The dashboard confirms when to take your setup, not what setup to take
• Most effective during regular market hours (9:30 AM - 4:00 PM ET) when volume is present
• The strongest edge comes from "MAXIMUM" signals - wait for these for best risk/reward
• Pay special attention to ADD direction - it's the most predictive breadth indicator
• VIX compression (gray ±) often signals upcoming volatility expansion - prepare for bigger moves
Customization Option
All thresholds are adjustable in settings:
• TICK Extreme: Higher = fewer exhaustion warnings (try 1200-1500 for less sensitivity)
• ADD Compression Threshold: Change detection sensitivity
o Default 100 = balanced
o Lower (50) = more sensitive to small breadth changes
o Higher (200-300) = only shows major breadth shifts
• VIX Elevated: Adjust for current volatility regime (15-25 typical range)
• VIX Compression Threshold:
o Default 2% = balanced
o Lower (0.5-1%) = catches subtle VIX changes
o Higher (3-5%) = only shows significant VIX moves
• Volume Threshold: Lower for quieter stocks/times, higher for more confirmation
Alerts Available
• Maximum Bullish: All 4 internals aligned bullish (TICK + ADD↑ + VIX↓ + Volume)
• Maximum Bearish: All 4 internals aligned bearish (TICK + ADD↓ + VIX↑ + Volume)
• Strong Bullish: TICK bullish + ADD rising
• Strong Bearish: TICK bearish + ADD falling
• Exhaustion Warning: TICK at extreme levels
• Divergence Warning: TICK and ADD directions conflicting
Understanding the Signal Synthesis
The indicator uses intelligent logic to combine all internals:
"MAXIMUM" Signals require:
• TICK direction (bullish/bearish)
• ADD momentum (rising/falling) in same direction
• VIX direction (falling for bulls, rising for bears)
• Volume elevated (>1.5x average)
"STRONG" Signals require:
• TICK direction (bullish/bearish)
• ADD momentum (rising/falling) in same direction
• (VIX and volume are bonuses but not required)
"MODERATE" Signals:
• TICK showing direction
• But ADD not confirming or contradicting
• Weakest actionable signal
This hierarchy ensures you know exactly how much conviction the market has behind any move.
Technical Details
• Pulls real-time data from NYSE TICK (USI:TICK), NYSE ADD (USI:ADD), and CBOE VIX
• ADD direction calculated using bar-to-bar change with compression detection
• VIX direction calculated using bar-to-bar percentage change
• Volume calculation uses 20-period simple moving average
• Dashboard updates every bar
• No repainting - all calculations based on closed bar data
Who This Is For
• Active daytraders of stocks, futures (ES/NQ), and options
• Scalpers needing quick directional confirmation with multiple internal alignment
• Swing traders looking to time intraday entries with maximum confluence
• Volatility traders who monitor VIX behavior
• Market makers and professionals who trade based on breadth and internals
• Anyone who monitors market internals but wants intelligent synthesis vs raw data
Tips For Success
Trading Philosophy:
• Quality over quantity - wait for "MAXIMUM" signals for best results
• One "MAXIMUM" signal trade is worth five "MODERATE" signal trades
• Gray/neutral is not a sign of missing opportunity - it's protecting your capital
Signal Confidence Levels:
1. MAXIMUM (95%+ confidence) - Trade these aggressively with full size
2. STRONG (80-85% confidence) - Trade these with normal position sizing
3. MODERATE (60-70% confidence) - Only if confirmed by strong technical setup
4. CHOPPY/NEUTRAL - Do not trade, wait for clarity
Advanced Techniques:
• Breadth divergences: Watch for price making new highs while ADD shows ↓ (falling) = major warning
• VIX/Price divergences: Rallies with rising VIX (↑) are usually false moves
• Volume confirmation: "MAXIMUM" signals with 2x+ volume are the absolute best
• Compression zones: When both ADD and VIX show compression (±), expect explosive breakout soon
• Sequential signals: Back-to-back "MAXIMUM" signals in same direction = strong trending day
Common Patterns:
• Opening surge with "MAXIMUM BULL" that shifts to "EXHAUSTION" (yellow) = fade the high
• Selloff with "MAXIMUM BEAR" followed by ADD ↑ (rising) divergence = potential reversal
• Choppy morning followed by "MAXIMUM" signal afternoon = best trending opportunity
Example Scenarios
Perfect Bull Entry:
• Bright green signal box
• TICK: +650
• ADD: +1200 (↑)
• VIX: 18.30 (↓)
• Volume: 2.3x
• Status: "✓ MAXIMUM BULL" → ALL SYSTEMS GO - Take aggressive long positions
Strong Bull (Good Confidence):
• Green signal box (slightly less bright)
• TICK: +500
• ADD: +800 (↑)
• VIX: 19.50 (±)
• Volume: 1.2x
• Status: "✓ STRONG BULL" → Good long setup - breadth confirming even without VIX/volume
Caution Bull (Moderate):
• Faded green signal box
• TICK: +400
• ADD: +900 (↓)
• VIX: 20.10 (↑)
• Volume: 0.9x
• Status: "MODERATE BULL" → CAUTION - TICK bullish but breadth deteriorating and VIX rising = weak rally
Exhaustion Warning:
• Yellow signal box
• TICK: +1350 ⚠
• ADD: +2100 (↑)
• VIX: 17.20 (↓)
• Volume: 1.8x
• Status: "⚠ EXHAUSTION" → Take profits or prepare to fade - TICK overextended despite good internals
Divergence Setup (Potential Reversal):
• Faded green signal
• TICK: +300
• ADD: +1800 (↓)
• VIX: 21.50 (↑)
• Volume: 1.6x
• Status: "MODERATE BULL" → WARNING - Price rallying but breadth collapsing and fear rising = distribution
Perfect Bear Entry:
• Bright red signal box
• TICK: -780
• ADD: -1600 (↓)
• VIX: 24.80 (↑)
• Volume: 2.5x
• Status: "✓ MAXIMUM BEAR" → Perfect short setup - all momentum bearish with conviction
Compression (Wait Mode):
• Gray signal box
• TICK: +50
• ADD: -200 (±)
• VIX: 16.40 (±)
• Volume: 0.7x
• Status: "CHOPPY/NEUTRAL" → STAY OUT - Volatility compression, no conviction, await breakout
Performance Optimization
Best Market Conditions:
• Works excellent in trending markets (up or down)
• Particularly powerful during high-volume sessions (first/last hours)
• "MAXIMUM" signals most reliable during 9:45-11:00 AM and 2:00-3:30 PM ET
Less Effective During:
• Lunch period (11:30 AM - 1:30 PM) - lower volume reduces signal quality
• Low-volatility environments - compression signals dominate
• Major news events in first 5 minutes - wait for internals to stabilize
Recommended Use Cases:
• Scalping: Trade only "MAXIMUM" signals for quick 5-15 minute moves
• Daytrading: Use "MAXIMUM" and "STRONG" signals for position entries
• Swing entries: Use "MAXIMUM" signals for optimal intraday entry timing
• Exit timing: Use "EXHAUSTION" (yellow) warnings to take profits
________________________________________
Pro Tip: Create a dedicated workspace with this indicator on SPY/ES/NQ charts. Set alerts for "MAXIMUM BULL", "MAXIMUM BEAR", and "EXHAUSTION" signals. Most professional traders only trade the "MAXIMUM" setups and ignore everything else - this alone can dramatically improve win rates.

MACD HTF Hardcoded (A/B Presets) + Regimes [CHE] MACD HTF Hardcoded (A/B Presets) + Regimes — Higher-timeframe MACD emulation with acceptance-based regime filter and on-chart diagnostics
Summary
This indicator emulates a higher-timeframe MACD directly on the current chart using two hardcoded preset families and a time-bucket mapping, avoiding cross-timeframe requests. It classifies four MACD regimes and applies an acceptance filter that requires several consecutive bars before a state is considered valid. A small dead-band around zero reduces noise near the axis. An on-chart table reports the active preset, the inferred time bucket, the resolved lengths, and the current regime.
Pine version: v6
Overlay: false
Primary outputs: MACD line, Signal line, Histogram columns, zero line, regime-change alert, info table
Motivation: Why this design?
Cross-timeframe indicators often rely on external timeframe requests, which can introduce repaint paths and added latency. This design provides a deterministic alternative: it maps the current chart’s timeframe to coarse higher-timeframe buckets and uses fixed EMA lengths that approximate those views. The dead-band suppresses flip-flops around zero, and the acceptance counter reduces whipsaw by requiring sustained agreement across bars before acknowledging a regime.
What’s different vs. standard approaches?
Baseline: Classical MACD with user-selected lengths on the same timeframe, or higher-timeframe MACD via cross-timeframe requests.
Architecture differences:
Hardcoded A and B length families with a bucket map derived from the chart timeframe.
No `request.security`; all calculations occur on the current series.
Regime classification from MACD and Histogram sign, gated by an acceptance count and a small zero dead-band.
Diagnostics table for transparency.
Practical effect: The MACD behaves like a slower, higher-timeframe variant without external requests. Regimes switch less often due to the dead-band and acceptance logic, which can improve stability in choppy sessions.
How it works (technical)
The script derives a coarse bucket from the chart timeframe using `timeframe.in_seconds` and maps it to preset-specific EMA lengths. EMAs of the source build MACD and Signal; their difference is the Histogram. Signs of MACD and Histogram define four regimes: strong bull, weak bull, strong bear, and weak bear. A small, user-defined band around zero treats values near the axis as neutral. An acceptance counter checks whether the same regime persisted for a given number of consecutive bars before it is emitted as the filtered regime. A single alert condition fires when the filtered regime changes. The histogram columns change shade based on position relative to zero and whether they are rising or falling. A persistent table object shows preset, bucket tag, resolved lengths, and the filtered regime. No cross-timeframe requests are used, so repaint risk is limited to normal live-bar movement; values stabilize on close.
Parameter Guide
Source — Input series for MACD — Default: Close — Using a smoother source increases stability but adds lag.
Preset — A or B length family — Default: “3,10,16” — Switch to “12,26,9” for the classic family mapped to buckets.
Table Position — Anchor for the info table — Default: Top right — Choose a corner that avoids covering price action.
Table Size — Table text size — Default: Normal — Use small on dense charts, large for presentations.
Dark Mode — Table theme — Default: Enabled — Match your chart background for readability.
Show Table — Toggle diagnostics table — Default: Enabled — Disable for a cleaner pane.
Zero dead-band (epsilon) — Noise gate around zero — Default: Zero — Increase slightly when you see frequent flips near zero.
Acceptance bars (n) — Bars required to confirm a regime — Default: Three — Raise to reduce whipsaw; lower to react faster.
Reading & Interpretation
Histogram columns: Above zero indicates bullish pressure; below zero indicates bearish pressure. Darker shade implies the histogram increased compared with the prior bar; lighter shade implies it decreased.
MACD vs. Signal lines: The spread corresponds to histogram height.
Regimes:
Strong bull: MACD above zero and Histogram above zero.
Weak bull: MACD above zero and Histogram below zero.
Strong bear: MACD below zero and Histogram below zero.
Weak bear: MACD below zero and Histogram above zero.
Table: Inspect active preset, bucket tag, resolved lengths, and the filtered regime number with its description.
Practical Workflows & Combinations
Trend following: Use strong bull to favor long exposure and strong bear to favor short exposure. Use weak states as pullback or transition context. Combine with structure tools such as swing highs and lows or a baseline moving average for confirmation.
Exits and risk: In strong trends, consider exiting partial size on a regime downgrade to a weak state. In choppy sessions, increase the acceptance bars to reduce churn.
Multi-asset / Multi-timeframe: Works on time-based charts across liquid futures, indices, currencies, and large-cap equities. Bucket mapping helps retain a consistent feel when moving from lower to higher timeframes.
Behavior, Constraints & Performance
Repaint/confirmation: No cross-timeframe requests; values can evolve intrabar and settle on close. Alerts follow your TradingView alert timing settings.
Resources: `max_bars_back` is set to five thousand. Very large resolved lengths require sufficient history to seed EMAs; expect a warm-up period on first load or after switching symbols.
Known limits: Dead-band and acceptance can delay recognition at sharp turns. Extremely thin markets or large gaps may still cause brief regime reversals.
Sensible Defaults & Quick Tuning
Start with preset “3,10,16”, dead-band near zero, and acceptance of three bars.
Too many flips near zero: increase the dead-band slightly or raise the acceptance bars.
Too sluggish in clean trends: reduce the acceptance bars by one.
Too sensitive on fast lower timeframes: switch to the “12,26,9” preset family or raise the acceptance bars.
Want less clutter: hide the table and keep the alert.
What this indicator is—and isn’t
This is a visualization and regime layer for MACD using higher-timeframe emulation and stability gates. It is not a complete trading system and does not generate position sizing or risk management. Use it with market structure, execution rules, and protective stops.
Disclaimer
The content provided, including all code and materials, is strictly for educational and informational purposes only. It is not intended as, and should not be interpreted as, financial advice, a recommendation to buy or sell any financial instrument, or an offer of any financial product or service. All strategies, tools, and examples discussed are provided for illustrative purposes to demonstrate coding techniques and the functionality of Pine Script within a trading context.
Any results from strategies or tools provided are hypothetical, and past performance is not indicative of future results. Trading and investing involve high risk, including the potential loss of principal, and may not be suitable for all individuals. Before making any trading decisions, please consult with a qualified financial professional to understand the risks involved.
By using this script, you acknowledge and agree that any trading decisions are made solely at your discretion and risk.
Do not use this indicator on Heikin-Ashi, Renko, Kagi, Point-and-Figure, or Range charts, as these chart types can produce unrealistic results for signal markers and alerts.
Best regards and happy trading
Chervolino

Cnagda Pure Price ActionCnagda Pure Price Action (CPPA) indicator is a pure price action-based system designed to provide traders with real-time, dynamic analysis of the market. It automatically identifies key candles, support and resistance zones, and potential buy/sell signals by combining price, volume, and multiple popular trend indicators.
How Price Action & Volume Analysis Works
Silver Zone – Logic, Reason, and Trade Planning
Logic & Visualization:
The Silver Zone is created when the closing price is the lowest in the chosen window and volume is the highest in that window.
Visually, a large silver-colored box/rectangle appears on the chart.
Thick horizontal lines (top and bottom) are drawn at the high and low of that candle/bar, extending to the right.
Reasoning:
This combination typically occurs at strong “accumulation” or support areas:
Sellers push the price down to the lowest point, but aggressive buyers step in with high volume, absorbing supply.
Indicates potential exhaustion of selling and likely shift in market control to buyers.
How to Plan Trades Using Silver Zone:
Watch if price returns to the Silver Zone in the future: It often acts as powerful support.
Bullish entries (buys) can be planned when price tests or slightly pierces this zone, especially if new buy signals occur (like yellow/green candle labels).
Place your stop-loss below the bottom line of the Silver Zone.
Target: Look for the nearest resistance or opposing zone, or use indicator’s bullish label as confirmation.
Extra Tip:
Multiple touches of the Silver Zone reinforce its importance, but if price closes deeply below it with high volume, that’s a caution signal—support may be breaking.
Black Zone – Logic, Reason, and Trade Planning (as CPPA):
Logic & Visualization:
The Black Zone is created when the closing price is the highest in the chosen window and volume is the lowest in that window.
Visually, a large black-colored box/rectangle appears on the chart, along with thick horizontal lines at the top (high) and bottom (low) of the candle, extending to the right.
Reasoning:
This combination signals a strong “distribution” or resistance area:
Buyers push the price up to a local high, but low volume means there is not much follow-through or conviction in the move.
Often marks exhaustion where uptrend may pause or reverse, as sellers can soon step in.
How to Plan Trades Using Black Zone:
If price revisits the Black Zone in the future, it often acts as major resistance.
Bearish entries (sells) are considered when price is near, testing, or slightly above the Black Zone—especially if new sell signals appear (like blue/red candle labels).
Place your stop-loss just above the top line of the Black Zone.
Target: Nearest support zone (such as a Silver Zone) or next indicator’s bearish label.
Extra Tip:
Multiple touches of the Black Zone make it stronger, but if price closes far above with rising volume, be cautious—resistance might be breaking.
Support Line – Logic, Reason, and Trade Planning (as Cppa):
Logic & Visualization:
The Support Line is a dynamically drawn dashed line (usually blue) that marks key price levels where the market has previously shown significant buying interest.
The line is generated whenever a candle forms a high price with high volume (orange logic).
The script checks for historical pivot lows, past support zones, and even higher timeframe (HTF) supports, and then extends a blue dashed line from that price level to the right, labeling it (sometimes as “Prev Support Orange, HTF”).
Reasoning:
This line helps you visually identify where demand has been strong enough to hold price from falling further—essentially a floor in the market used by professional traders.
If price approaches or re-tests this line, there’s a good chance buyers will defend it again.
How to Plan Trades Using Support Line:
Watch for price to approach the Support Line during down moves. If you see a bullish candlestick pattern, buy labels (yellow/green), or other indicators aligning, this can be a high-probability entry zone.
Great for planning stop-loss for long trades: place stops just below this line.
Target: Next resistance zone, Black Zone, or the top of the last swing.
Extra Tip:
Multiple confirmations (support line + Silver Zone + bullish label) provide powerful entry signals.
If price closes strongly below the Support Line with volume, be cautious—support may be breaking, and a trend reversal or deeper correction could follow.
Resistance Line – Logic, Reason, and Trade Planning (from CPPA):
Logic & Visualization:
The Resistance Line is a dynamically drawn dashed line (usually purple or red) that identifies price levels where the market has previously faced significant selling pressure.
This line is created when a candle reaches a high price combined with high volume (orange logic), or from a historical pivot high/resistance,
The script also tracks higher timeframe (HTF) resistance lines, labeled as “Prev Resistance Orange, HTF,” and extends these dashed lines to the right across the chart.
Reasoning:
Resistance Lines are visual markers of “supply zones,” where buyers previously failed, and sellers took control.
If the price returns to this line later, sellers may get active again to defend this level, halting the uptrend.
How to Plan Trades Using Resistance Line:
Watch for price to approach the Resistance Line during up moves. If you see bearish candlestick patterns, sell labels (blue/red), or bearish indicator confirmation, this becomes a strong shorting opportunity.
Perfect for placing stop-loss in short trades—put your stop just above the Resistance Line.
Target: Next support zone (Silver Zone) or bottom of the last swing.
If the price breaks above with high volume, avoid shorting—resistance may be failing.
Extra Tip:
Multiple resistances (Resistance Line + Black Zone + bearish label) make short signals stronger.
Choppy movement around this line often signals indecision; wait for a clear rejection before entering trades.
Bullish / Bearish Label – Logic, Reason, and Trade Planning:
Logic & Visualization:
The indicator constantly calculates a "Bull Score" and a "Bear Score" based on several factors:
Trend direction from price slope
Confirmation by popular indicators (RSI, ADX, SAR, CMF, OBV, CCI, Bollinger Bands, TWAP)
Adaptive scoring (higher score for each bullish/bearish condition met)
If Bull Score > Bear Score, the chart displays a green "BULLISH" label (usually below the bar).
If Bear Score > Bull Score, the chart displays a red "BEARISH" label (usually above the bar).
If neither dominates, a "NEUTRAL" label appears.
Reasoning:
The labels summarize complex price action and indicator analysis into a simple, actionable sentiment cue:
Bullish: Majority of conditions indicate buying strength; trend is up.
Bearish: Majority signals show selling pressure; trend is down.
How to Use in Trade Planning:
Use the Bullish label as confirmation to enter or hold long (buy) positions, especially if near support/Silver Zone.
Use the Bearish label to enter/hold short (sell) positions, especially if near resistance/Black Zone.
For best results, combine with candle color, volume analysis, or other labels (yellow/green for buys, blue/red for sells).
Avoid trading against these labels unless you have strong confluence from zones/support levels.
Yellow Label (Buy Signal) – Logic, Reason & Trade Planning:
Logic & Visualization:
The yellow label appears below a candle (label.style_label_up, yloc.belowbar) and marks a potential buy signal.
Script conditions:
The candle must be a “yellow candle” (which means it’s at the local lowest close, not a high, with normal volume).
Volume is decreasing for 2 consecutive candles (current volume < previous volume, previous volume < second previous).
When these conditions are met, a yellow label is plotted below the candle.
Reasoning:
This scenario often marks the end of selling pressure and start of possible accumulation—buyers may be stepping in as sellers exhaust.
Decreasing volume during a local price low means selling is slowing, possibly hinting at a reversal.
How to Trade Using Yellow Label:
Entry: Consider buying at/just above the yellow-labeled candle’s close.
Stop-loss: A bit below the candle’s low (or Silver Zone line, if present).
Target: Next resistance level, Black Zone, or chart’s bullish label.
Extra Tip:
If the yellow label is found at/near a Silver Zone or Support Line, and trend is “Bullish,” the setup gets even stronger.
Avoid trading if overall indicator shows “Bearish.”
Green Label (Buy with Increasing Volume) – Logic, Reason & Trade Planning:
Logic & Visualization:
The green label is plotted below a candle (label.style_label_up, yloc.belowbar) and marks a strong buy signal.
Script conditions:
The candle must be a “yellow candle” (at the local lowest close, normal volume).
Volume is increasing for 2 consecutive candles (current volume > previous volume, previous volume > second previous).
When these conditions are met, a green label is plotted below the candle.
Reasoning:
This scenario signals that buyers are stepping in aggressively at a local price low—the end of a downtrend with strong, rising activity.
Increasing volume at a price low is a classic sign of accumulation, where institutions or large players may be buying.
How to Trade Using Green Label:
Entry: Consider buying at/just above the green-labeled candle’s close for a momentum-based reversal.
Stop-loss: Slightly below the candle’s low, or the Silver Zone/support line if present.
Target: Nearest resistance zone/Black Zone, indicator’s bullish label, or next swing high.
Extra Tip:
If the green label is near other supports (Silver Zone, Support Line), the setup is extra strong.
Use confirmation from Bullish labels or trend signals for best results.
Green label setups are suitable for quick, high momentum trades due to increasing volume
Blue Label (Sell Signal on Decreasing Volume) – Logic, Reason & Trade Planning:
Logic & Visualization:
The blue label is plotted above a candle (label.style_label_down, yloc.abovebar) as a potential sell signal.
Script conditions:
The candle is a “blue candle” (local highest close, but not also lowest, and volume is neither highest nor lowest).
Volume is decreasing over 2 consecutive candles (current volume < previous, previous < two ago).
When these match, a blue label appears above the candle.
Reasoning:
This typically signals buyer exhaustion at a local high: price has gone up, but volume is dropping, suggesting big players may not be buying any more at these levels.
The trend is losing strength, and a reversal or pullback is likely.
How to Trade Using Blue Label:
Entry: Look to sell at/just below the candle with the blue label.
Stop-loss: Just above the candle’s high (or above the Black Zone/resistance if present).
Target: Nearest support, Silver Zone, or a swing low.
Extra Tip:
Blue label signals are stronger if they appear near Black Zones or Resistance Lines, or when the general market label is "Bearish."
As with buy setups, always check for confirmation from trend or volume before trading aggressively.
Here’s a summary of all key chart labels, zones, and trading logic of your Price Action script:
Silver Zone: Powerful support zone. Created at lowest close + highest volume. Best for buy entries near its lines.
Black Zone: Strong resistance zone. Created at highest close + lowest volume. Ideal for short trades near its levels.
Support Line: Blue dashed line at historical demand; buyers defend here. Look for bullish setups when price approaches.
Resistance Line: Purple/red dashed line at supply; sellers defend here. Great for bearish setups when price nears.
Bullish/Bearish Labels: Summarize trend direction using price action + multiple indicator confirmations. Plan buys, holds on bullish; sells, shorts on bearish.
Yellow Label: Buy signal on decreasing volume and local price low. Entry above candle, stop below, target next resistance.
Green Label: Strong buy on increasing volume at a price low. Entry for momentum trade, stop below, target next zone.
Blue Label: Sell signal on dropping volume and local price high. Entry below candle, stop above, target next support.
Best Practices:
Always combine zone/label signals for higher probability trades.
Use stop-loss near zones/lines for risk management.
Prefer trading in the trend direction (bullish/bearish label agrees with your entry).
if Any Question, Suggestion Feel free to ask
Disclaimer:
All information provided by this indicator is for educational and analysis purposes only, and should not be considered financial advice.

Liquidity StatusKey Points
The Liquidity Status (LS) indicator is designed to directly monitor liquidity conditions and determine if they are Bullish or Bearish.
If conditions are bullish, the candle is painted green (or whichever color is chosen by you to represent bullish liquidity) and the expected price action is up.
If conditions are bearish, the candle is painted red (or whichever color is chosen by you to represent bearish liquidity) and the expected price action is down.
LS allows you to monitor for when traders are absorbing or supplying liquidity and in which direction the liquidity is flowing.
LS works on equities, cryptocurrencies, forex, options data, and futures.
Summary
The Liquidity Status (LS) indicator measures liquidity directly without relying on bid/ask spreads, order-book information, or any other traditional means. The benefit of this non-traditional approach is a novel and unique way to interpret and analyze liquidity in the market.
LS is designed to be as straightforward as possible: when conditions are bullish then the outlook is bullish and the candles are painted the bullish color (default: green), and when conditions are bearish then the outlook is bearish and the candles are painted the bearish color (default: red).
This means the candles are not colored based on their price movements but rather based on their liquidity status.
Additionally, LS indicates Liquidity Flow (LF) as well. LF indicates where the source of liquidity is or is moving towards: either towards the Ask (if the Bid is requiring liquidity then the liquidity source becomes the Ask), or towards the Bid (if the Ask is requiring liquidity then the liquidity source becomes the Bid). This can be helpful in early identification of trend changes.
The default settings are designed to be streamlined but the Settings section below outlines how to add additional information and detail to your charts if desired.
Examples
An example of LS on default setting:
With Full and Declarative reporting:
ES Futures:
Details
In the default settings, LS indicates if conditions are:
Bullish : meaning that current liquidity is bullish and so too are outlooks, or
Bearish: meaning that current liquidity is bearish and so too are outlooks.
There are additional data that are provided via LS, if toggled on (as described below). They include:
Aggressive Bid / Ask : This indicates that there is an aggressive trader present. Aggressive traders are large liquidity absorbers and are defined as having a sense of urgency in their trading that will cause them to go where-ever (whichever price) they can in order to transact. A classic Aggressive Bid, for instance, is a short-seller currently being squeezed.
Eager Bid / Ask : This indicates that there is an eager trader present. Eager traders are defined by their willingness to “cross the isle” in order to transact. For example, an eager bid will move to the ask in order to transact whereas an organic bid would not.
Organic Bid / Ask : This indicates that transactions are occurring at the organic traders. Organic traders are defined as having a large time-horizon and are value-seekers. For instance, an organic ask will likely move price up in order to sell high (the second part of buy low, sell high).
Additionally, LS indicates LF by specifying which party has the demand for liquidity and which has the supply for liquidity.
Flow to Ask : This indicates that the demand to transact is flowing to the ask (i.e.: the bid needs to transact more than the ask) and thus the ask is becoming the liquidity supplier.
Flow to Bid : This indicates that the demand to transact is flowing to the bid (i.e.: the ask needs to transact more than the bid) and thus the bid is becoming the liquidity supplier.
Neutral : No discernable difference in liquidity demand.
In combination, these signals can produce powerful measurements of underlying liquidity activity. For instance:
If LS indicates “At Organic Ask” and LF indicates “Flow to Ask” then this means that (1) transactions are predominantly occurring at or near the organic ask and (2) the organic ask is the dominate liquidity supplier. The consequence is likely substantial price appreciation (remember: the organic ask wants to sell high and now they are setting the terms and conditions of transacting!).
Example - How it started: transactions started to occur at the Organic Ask with Flow to Ask:
Example - How it ended:
Conversely, “At Organic Bid” and “Flow to Bid” indicates that transactions are predominantly occurring at or near the organic bid (who wants to buy low) and they the ones fulfilling the demand to transact coming from the ask. The expected outlook? Price depreciation as the organic bid lowers their orders to average down!
Example - How it started: transactions started to occur at Organic Bid with Flow to Bid:
Example - How it ended:
Lastly, LS (in combination with Liquidity Triggers) can identify moments of high-risk for bull and bear traps (see FAQ for details on how traps are found).
Example: Bear-Trap (with LT displayed)
Example: Bull-Trap (with LT displayed)
Customization
LS has many customization options available.
Sensitivity Mode
LS comes in a variety of sensitivities (for the nerds: adjusting the Sensitivity vs. Specificity), outlined below:
Aggressive : The Aggressive sensitivity mode puts LS in a state of hyper-awareness for anything that might indicate a change in overall liquidity status (i.e.: Bullish to Bearish or Bearish to Bullish) is underway. The benefit of the Aggressive mode is that it does not take much for LS to change its mind about current conditions. The trade-off, however, is increase in false alarms.
Balance : The balanced setting works to balance specificity (how right LS is) with sensitivity (how much chang it takes to convince LS to change its mind).
Conservative : The conservative setting is prone to change slower than both Aggressive and Balance but is intended to be more “certain” of the changes when they are indicated. This can lower the sensitivity (early entrances to trend-changes might be delayed slightly) in exchange for greater confidence in the future.
Diamond : This is the most specific and least sensitive option. Designed for when you only want LS to indicate a change with the strictest of criteria met.
Examples:
Aggressive LS:
Balanced LS:
Conservative LS:
Diamond LS:
LS Detail Amount
Controls how much detail and information you want displayed.
Simplified : Keeps messaging straightforward: Bearish or Bullish.
Full : Parsing the data for greater detail about if conditions are Strong or Weak. Produces candles and text output.
LS Reporting Style
Interpretive : Text output from LS is kept as either Bullish or Bearish.
Declarative : Additional information regarding if the transactions are being performed by an Aggressive, Eager or Organic trader.
LS Candle Replacement
In order to have LS produce candles colored by liquidity, the `LS Candle Replacement` option must be selected, along with deselecting the charts candle-making by going to Settings -> Symbol and de-selecting `Body`, `Border`, and `Wick`.
Otherwise, LS’ colors will be over-ridden by the chart.
Alerts
LS comes with several alerts to help keep track of changing liquidity conditions in the market. They include:
Is Bullish / Bearish : fires at the start of the candle if conditions are bullish/bearish.
Has Become Bullish / Bearish : Fires at the end of the candle if conditions have swapped (as compared to the previous candle).
Flow is to Ask / Bid : Fires at the start of the candle to indicate which direction liquidity is flowing via LF.
Flow Switch to Bid / Ask : Fires if there is a change in the LF from one to the other.
Suspected Bear Trap : Fires if a bear trap is detected.
Suspected Bear Trap Ended : Fires if an on-going bear-trap has ended.
Suspected Bull Trap : Fires if a bull trap is detected.
Suspected Bull Trap Ended : Fires if an on-going bull-trap has ended.
Frequently Asked Questions
How can I get access to LS?
Please see the Author’s Instructions for more information.
Where can I get more information on LS?
Please see the Author’s Instructions for more information.
I tried to add LS to my chart but nothing is showing.
That’s no good! Be sure that the indicator hasn’t errored out (if there is a small red dot next to its name then it has errored out). If it has, then try re-applying the indicator to your chart.
If there is no error indicated, and you still do not see anything it may be likely that the requested symbol either:
Doesn’t have sufficient data to calculate LS on, or
Lacks the data for LS to be calculated completed.
To check, try using LS on a smaller interval. If LS starts to populate, it is likely that the needed data is present but just not enough for the timeframe you were interested in. If there is no LS even when moving to lower intervals, then it may be that the specified underlying lacks the required data.
How come LS is saying things are Bearish but price is going up?
Sometimes that can happen! But until LS indicates bullish liquidity, the expectation is that price will fall back down.
How come LS is saying things are Bullish but price is going down?
Sometimes that can happen! But until LS indicates bearish liquidity, the expectation is that price will recover and continue moving on upwards.
How do you locate Bear and Bull traps?
LS has LT (Liquidity Triggers) baked into it for alerts and uses LT to compare expected conditions with real conditions. If LS and LT are mismatched then a trap is detected. The LT conditions checked are:
If LT is in a bull-stack : that means LT(144) > LT(377) > LT(610), or
If LT is in a bear-stack : that means LT(610) < LT(377) < LT(144)
Then once the stack is determined, if LS disagrees:
LS is indicating Bullish while LT is in a bear-stack, or
LS is indicating Bearish while LT is in a bull-stack
Then the alert is triggered (based off of LT’s orientation). This means:
If conditions are Bullish but LT is showing a Bearish stack, then a Bull Trap is detected, and
If conditions are Bearish but LT is showing a Bullish Stack, then a Bear Trap is detected.
I have questions and maybe a bug!
Please reach out and report! Please refer to the Author’s Instructions for more information on how to reach out.
Does LS get updates?
Yup! Improvements come relatively frequently and if you have any suggestions for improvements, please don’t hesitate to reach out.

Trend Fib Zone Bounce (TFZB) [KedArc Quant]Description:
Trend Fib Zone Bounce (TFZB) trades with the latest confirmed Supply/Demand zone using a single, configurable Fib pullback (0.3/0.5/0.6). Trade only in the direction of the most recent zone and use a single, configurable fib level for pullback entries.
• Detects market structure via confirmed swing highs/lows using a rolling window.
• Draws Supply/Demand zones (bearish/bullish rectangles) from the latest MSS (CHOCH or BOS) event.
• Computes intra zone Fib guide rails and keeps them extended in real time.
• Triggers BUY only inside bullish zones and SELL only inside bearish zones when price touches the selected fib and closes back beyond it (bounce confirmation).
• Optional labels print BULL/BEAR + fib next to the triangle markers.
What it does
Finds structure using confirmed swing highs/lows (you choose the confirmation length).
Builds the latest zone (bullish = demand, bearish = supply) after a CHOCH/BOS event.
Draws intra-zone “guide rails” (Fib lines) and extends them live.
Signals only with the trend of that zone:
BUY inside a bullish zone when price tags the selected Fib and closes back above it.
SELL inside a bearish zone when price tags the selected Fib and closes back below it.
Optional labels print BULL/BEAR + Fib next to triangles for quick context
Why this is different
Most “zone + fib + signal” tools bolt together several indicators, or fire counter-trend signals because they don’t fully respect structure. TFZB is intentionally minimal:
Single bias source: the latest confirmed zone defines direction; nothing else overrides it.
Single entry rule: one Fib bounce (0.3/0.5/0.6 selectable) inside that zone—no counter-trend trades by design.
Clean visuals: you can show only the most recent zone, clamp overlap, and keep just the rails that matter.
Deterministic & transparent: every plot/label comes from the code you see—no external series or hidden smoothing
How it helps traders
Cuts decision noise: you always know the bias and the only entry that matters right now.
Forces discipline: if price isn’t inside the active zone, you don’t trade.
Adapts to volatility: pick 0.3 in strong trends, 0.5 as the default, 0.6 in chop.
Non-repainting zones: swings are confirmed after Structure Length bars, then used to build zones that extend forward (they don’t “teleport” later)
How it works (details)
*Structure confirmation
A swing high/low is only confirmed after Structure Length bars have elapsed; the dot is plotted back on the original bar using offset. Expect a confirmation delay of about Structure Length × timeframe.
*Zone creation
After a CHOCH/BOS (momentum shift / break of prior swing), TFZB draws the new Supply/Demand zone from the swing anchors and sets it active.
*Fib guide rails
Inside the active zone TFZB projects up to five Fib lines (defaults: 0.3 / 0.5 / 0.7) and extends them as time passes.
*Entry logic (with-trend only)
BUY: bar’s low ≤ fib and close > fib inside a bullish zone.
SELL: bar’s high ≥ fib and close < fib inside a bearish zone.
*Optionally restrict to one signal per zone to avoid over-trading.
(Optional) Aggressive confirm-bar entry
When do the swing dots print?
* The code confirms a swing only after `structureLen` bars have elapsed since that candidate high/low.
* On a 5-min chart with `structureLen = 10`, that’s about 50 minutes later.
* When the swing confirms, the script plots the dot back on the original bar (via `offset = -structureLen`). So you *see* the dot on the old bar, but it only appears on the chart once the confirming bar arrives.
> Practical takeaway: expect swing markers to appear roughly `structureLen × timeframe` later. Zones and signals are built from those confirmed swings.
Best timeframe for this Indicator
Use the timeframe that matches your holding period and the noise level of the instrument:
* Intraday :
* 5m or 15m are the sweet spots.
* Suggested `structureLen`:
* 5m: 10–14 (confirmation delay \~50–70 min)
* 15m: 8–10 (confirmation delay \~2–2.5 hours)
* Keep Entry Fib at 0.5 to start; try 0.3 in strong trends, 0.6 in chop.
* Tip: avoid the first 10–15 minutes after the open; let the initial volatility set the early structure.
* Swing/overnight:
* 1h or 4h.
* `structureLen`:
* 1h: 6–10 (6–10 hours confirmation)
* 4h: 5–8 (20–32 hours confirmation)
* 1m scalping: not recommended here—the confirmation lag relative to the noise makes zones less reliable.
Inputs (all groups)
Structure
• Show Swing Points (structureTog)
o Plots small dots on the bar where a swing point is confirmed (offset back by Structure Length).
• Structure Length (structureLen)
o Lookback used to confirm swing highs/lows and determine local structure. Higher = fewer, stronger swings; lower = more reactive.
Zones
• Show Last (zoneDispNum)
o Maximum number of zones kept on the chart when Display All Zones is off.
• Display All Zones (dispAll)
o If on, ignores Show Last and keeps all zones/levels.
• Zone Display (zoneFilter): Bullish Only / Bearish Only / Both
o Filters which zone types are drawn and eligible for signals.
• Clean Up Level Overlap (noOverlap)
o Prevents fib lines from overlapping when a new zone starts near the previous one (clamps line start/end times for readability).
Fib Levels
Each row controls whether a fib is drawn and how it looks:
• Toggle (f1Tog…f5Tog): Show/hide a given fib line.
• Level (f1Lvl…f5Lvl): Numeric ratio in . Defaults active: 0.3, 0.5, 0.7 (0 and 1 off by default).
• Line Style (f1Style…f5Style): Solid / Dashed / Dotted.
• Bull/Bear Colors (f#BullColor, f#BearColor): Per-fib color in bullish vs bearish zones.
Style
• Structure Color: Dot color for confirmed swing points.
• Bullish Zone Color / Bearish Zone Color: Rectangle fills (transparent by default).
Signals
• Entry Fib for Signals (entryFibSel): Choose 0.3, 0.5 (default), or 0.6 as the trigger line.
• Show Buy/Sell Signals (showSignals): Toggles triangle markers on/off.
• One Signal Per Zone (oneSignalPerZone): If on, suppresses additional entries within the same zone after the first trigger.
• Show Signal Text Labels (Bull/Bear + Fib) (showSignalLabels): Adds a small label next to each triangle showing zone bias and the fib used (e.g., BULL 0.5 or BEAR 0.3).
How TFZB decides signals
With trend only:
• BUY
1. Latest active zone is bullish.
2. Current bar’s close is inside the zone (between top and bottom).
3. The bar’s low ≤ selected fib and it closes > selected fib (bounce).
• SELL
1. Latest active zone is bearish.
2. Current bar’s close is inside the zone.
3. The bar’s high ≥ selected fib and it closes < selected fib.
Markers & labels
• BUY: triangle up below the bar; optional label “BULL 0.x” above it.
• SELL: triangle down above the bar; optional label “BEAR 0.x” below it.
Right-Panel Swing Log (Table)
What it is
A compact, auto-updating log of the most recent Swing High/Low events, printed in the top-right of the chart.
It helps you see when a pivot formed, when it was confirmed, and at what price—so you know the earliest bar a zone-based signal could have appeared.
Columns
Type – Swing High or Swing Low.
Date – Calendar date of the swing bar (follows the chart’s timezone).
Swing @ – Time of the original swing bar (where the dot is drawn).
Confirm @ – Time of the bar that confirmed that swing (≈ Structure Length × timeframe after the swing). This is also the earliest moment a new zone/entry can be considered.
Price – The swing price (high for SH, low for SL).
Why it’s useful
Clarity on repaint/confirmation: shows the natural delay between a swing forming and being usable—no guessing.
Planning & journaling: quick reference of today’s pivots and prices for notes/backtesting.
Scanning intraday: glance to see if you already have a confirmed zone (and therefore valid fib-bounce entries), or if you’re still waiting.
Context for signals: if a fib-bounce triangle appears before the time listed in Confirm @, it’s not a valid trade (you were too early).
Settings (Inputs → Logging)
Log swing times / Show table – turn the table on/off.
Rows to keep – how many recent entries to display.
Show labels on swing bar – optional tags on the chart (“Swing High 11:45”, “Confirm SH 14:15”) that match the table.
Recommended defaults
• Structure Length: 10–20 for intraday; 20–40 for swing.
• Entry Fib for Signals: 0.5 to start; try 0.3 in stronger trends and 0.6 in choppier markets.
• One Signal Per Zone: ON (prevents over trading).
• Zone Display: Both.
• Fib Lines: Keep 0.3/0.5/0.7 on; turn on 0 and 1 only if you need anchors.
Alerts
Two alert conditions are available:
• BUY signal – fires when a with trend bullish bounce at the selected fib occurs inside a bullish zone.
• SELL signal – fires when a with trend bearish bounce at the selected fib occurs inside a bearish zone.
Create alerts from the chart’s Alerts panel and select the desired condition. Use Once Per Bar Close to avoid intrabar flicker.
Notes & tips
• Swing dots are confirmed only after Structure Length bars, so they plot back in time; zones built from these confirmed swings do not repaint (though they extend as new bars form).
• If you don’t see a BUY where you expect one, check: (1) Is the active zone bullish? (2) Did the candle’s low actually pierce the selected fib and close above it? (3) Is One Signal Per Zone suppressing a second entry?
• You can hide visual clutter by reducing Show Last to 1–3 while keeping Display All Zones off.
Glossary
• CHOCH (Change of Character): A shift where price breaks beyond the last opposite swing while local momentum flips.
• BOS (Break of Structure): A cleaner break beyond the prior swing level in the current momentum direction.
• MSS: Either CHOCH or BOS – any event that spawns a new zone.
Extension ideas (optional)
• Add fib extensions (1.272 / 1.618) for target lines.
• Zone quality score using ATR normalization to filter weak impulses.
• HTF filter to only accept zones aligned with a higher timeframe trend.
⚠️ Disclaimer This script is provided for educational purposes only.
Past performance does not guarantee future results.
Trading involves risk, and users should exercise caution and use proper risk management when applying this strategy.

RSI WMA VWMA Divergence Indicator// This Pine Script® code is subject to the terms of the Mozilla Public License 2.0 at mozilla.org
// © Kenndjk
//@version=6
indicator(title="RSI WMA VWMA Divergence Indicator", shorttitle="Kenndjk", format=format.price, precision=2)
oscType = input.string("RSI", "Oscillator Type", options = , group="General Settings")
// RSI Settings
rsiGroup = "RSI Settings"
rsiLengthInput = input.int(14, minval=1, title="RSI Length", group=rsiGroup)
rsiSourceInput = input.source(close, "Source", group=rsiGroup)
// WMA VWMA
wmaLength = input.int(9, "WMA Length", minval=1, group="WMA Settings")
vwmaLength = input.int(3, "VWMA Length", minval=1, group="WMA Settings")
wma = ta.wma(close, wmaLength)
vwma = ta.vwma(close, vwmaLength)
useVWMA = input.bool(true, "Use VWMA for Divergence (when WMA + VWMA mode)", group="WMA Settings")
// Oscillator selection
rsi = ta.rsi(rsiSourceInput, rsiLengthInput) // Calculate RSI always, but use conditionally
osc = oscType == "RSI" ? rsi : useVWMA ? vwma : wma
// RSI plots (conditional)
isRSI = oscType == "RSI"
rsiPlot = plot(isRSI ? rsi : na, "RSI", color=isRSI ? #7E57C2 : na)
rsiUpperBand = hline(isRSI ? 70 : na, "RSI Upper Band", color=isRSI ? #787B86 : na)
midline = hline(isRSI ? 50 : na, "RSI Middle Band", color=isRSI ? color.new(#787B86, 50) : na)
rsiLowerBand = hline(isRSI ? 30 : na, "RSI Lower Band", color=isRSI ? #787B86 : na)
fill(rsiUpperBand, rsiLowerBand, color=isRSI ? color.rgb(126, 87, 194, 90) : na, title="RSI Background Fill")
midLinePlot = plot(isRSI ? 50 : na, color = na, editable = false, display = display.none)
fill(rsiPlot, midLinePlot, 100, 70, top_color = isRSI ? color.new(color.green, 0) : na, bottom_color = isRSI ? color.new(color.green, 100) : na, title = "Overbought Gradient Fill")
fill(rsiPlot, midLinePlot, 30, 0, top_color = isRSI ? color.new(color.red, 100) : na, bottom_color = isRSI ? color.new(color.red, 0) : na, title = "Oversold Gradient Fill")
// WMA VWMA plots
wmaColor = oscType != "RSI" ? (useVWMA ? color.new(color.blue, 70) : color.blue) : na
wmaWidth = useVWMA ? 1 : 2
vwmaColor = oscType != "RSI" ? (useVWMA ? color.orange : color.new(color.orange, 70)) : na
vwmaWidth = useVWMA ? 2 : 1
plot(oscType != "RSI" ? wma : na, "WMA", color=wmaColor, linewidth=wmaWidth)
plot(oscType != "RSI" ? vwma : na, "VWMA", color=vwmaColor, linewidth=vwmaWidth)
// Smoothing MA inputs (only for RSI)
GRP = "Smoothing (RSI only)"
TT_BB = "Only applies when 'Show Bollinger Bands' is selected. Determines the distance between the SMA and the bands."
maLengthSMA = input.int(14, "SMA Length", minval=1, group=GRP, display=display.data_window)
maLengthEMA = input.int(14, "EMA Length", minval=1, group=GRP, display=display.data_window)
maLengthRMA = input.int(14, "SMMA (RMA) Length", minval=1, group=GRP, display=display.data_window)
maLengthWMA = input.int(14, "WMA Length", minval=1, group=GRP, display=display.data_window)
maLengthVWMA = input.int(14, "VWMA Length", minval=1, group=GRP, display=display.data_window)
bbMultInput = input.float(2.0, "BB StdDev", minval=0.001, maxval=50, step=0.5, tooltip=TT_BB, group=GRP, display=display.data_window)
showSMA = input.bool(false, "Show SMA", group=GRP)
showEMA = input.bool(false, "Show EMA", group=GRP)
showRMA = input.bool(false, "Show SMMA (RMA)", group=GRP)
showWMAsmooth = input.bool(false, "Show WMA", group=GRP)
showVWMAsmooth = input.bool(false, "Show VWMA", group=GRP)
showBB = input.bool(false, "Show SMA + Bollinger Bands", group=GRP, tooltip=TT_BB)
// Smoothing MA Calculations
sma_val = (showSMA or showBB) and isRSI ? ta.sma(rsi, maLengthSMA) : na
ema_val = showEMA and isRSI ? ta.ema(rsi, maLengthEMA) : na
rma_val = showRMA and isRSI ? ta.rma(rsi, maLengthRMA) : na
wma_val = showWMAsmooth and isRSI ? ta.wma(rsi, maLengthWMA) : na
vwma_val = showVWMAsmooth and isRSI ? ta.vwma(rsi, maLengthVWMA) : na
smoothingStDev = showBB and isRSI ? ta.stdev(rsi, maLengthSMA) * bbMultInput : na
// Smoothing MA plots
plot(sma_val, "RSI-based SMA", color=(showSMA or showBB) ? color.yellow : na, display=(showSMA or showBB) ? display.all : display.none, editable=(showSMA or showBB))
plot(ema_val, "RSI-based EMA", color=showEMA ? color.purple : na, display=showEMA ? display.all : display.none, editable=showEMA)
plot(rma_val, "RSI-based RMA", color=showRMA ? color.red : na, display=showRMA ? display.all : display.none, editable=showRMA)
plot(wma_val, "RSI-based WMA", color=showWMAsmooth ? color.blue : na, display=showWMAsmooth ? display.all : display.none, editable=showWMAsmooth)
plot(vwma_val, "RSI-based VWMA", color=showVWMAsmooth ? color.orange : na, display=showVWMAsmooth ? display.all : display.none, editable=showVWMAsmooth)
bbUpperBand = plot(showBB ? sma_val + smoothingStDev : na, title="Upper Bollinger Band", color=showBB ? color.green : na, display=showBB ? display.all : display.none, editable=showBB)
bbLowerBand = plot(showBB ? sma_val - smoothingStDev : na, title="Lower Bollinger Band", color=showBB ? color.green : na, display=showBB ? display.all : display.none, editable=showBB)
fill(bbUpperBand, bbLowerBand, color=showBB ? color.new(color.green, 90) : na, title="Bollinger Bands Background Fill", display=showBB ? display.all : display.none, editable=showBB)
// Divergence Settings
divGroup = "Divergence Settings"
calculateDivergence = input.bool(true, title="Calculate Divergence", group=divGroup, tooltip = "Calculating divergences is needed in order for divergence alerts to fire.")
lookbackLeft = input.int(5, "Pivot Lookback Left", minval=1, group=divGroup)
lookbackRight = input.int(5, "Pivot Lookback Right", minval=1, group=divGroup)
rangeLower = input.int(5, "Min Range for Divergence", minval=0, group=divGroup)
rangeUpper = input.int(60, "Max Range for Divergence", minval=1, group=divGroup)
showHidden = input.bool(true, "Show Hidden Divergences", group=divGroup)
bearColor = color.red
bullColor = color.green
textColor = color.white
noneColor = color.new(color.white, 100)
_inRange(cond) =>
bars = ta.barssince(cond)
rangeLower <= bars and bars <= rangeUpper
bool plFound = false
bool phFound = false
bool bullCond = false
bool bearCond = false
bool hiddenBullCond = false
bool hiddenBearCond = false
float oscLBR = na
float lowLBR = na
float highLBR = na
float prevPlOsc = na
float prevPlLow = na
float prevPhOsc = na
float prevPhHigh = na
if calculateDivergence
plFound := not na(ta.pivotlow(osc, lookbackLeft, lookbackRight))
phFound := not na(ta.pivothigh(osc, lookbackLeft, lookbackRight))
oscLBR := osc
lowLBR := low
highLBR := high
prevPlOsc := ta.valuewhen(plFound, oscLBR, 1)
prevPlLow := ta.valuewhen(plFound, lowLBR, 1)
prevPhOsc := ta.valuewhen(phFound, oscLBR, 1)
prevPhHigh := ta.valuewhen(phFound, highLBR, 1)
// Regular Bullish
oscHL = oscLBR > prevPlOsc and _inRange(plFound )
priceLL = lowLBR < prevPlLow
bullCond := priceLL and oscHL and plFound
// Regular Bearish
oscLL = oscLBR < prevPhOsc and _inRange(phFound )
priceHH = highLBR > prevPhHigh
bearCond := priceHH and oscLL and phFound
// Hidden Bullish
oscLL_hidden = oscLBR < prevPlOsc and _inRange(plFound )
priceHL = lowLBR > prevPlLow
hiddenBullCond := priceHL and oscLL_hidden and plFound and showHidden
// Hidden Bearish
oscHH_hidden = oscLBR > prevPhOsc and _inRange(phFound )
priceLH = highLBR < prevPhHigh
hiddenBearCond := priceLH and oscHH_hidden and phFound and showHidden
// Plot divergences (lines and labels on pane)
if bullCond
leftBar = ta.valuewhen(plFound, bar_index , 1)
line.new(leftBar, prevPlOsc, bar_index , oscLBR, xloc=xloc.bar_index, color=bullColor, width=2)
label.new(bar_index , oscLBR, "R Bull", style=label.style_label_up, color=noneColor, textcolor=textColor)
if bearCond
leftBar = ta.valuewhen(phFound, bar_index , 1)
line.new(leftBar, prevPhOsc, bar_index , oscLBR, xloc=xloc.bar_index, color=bearColor, width=2)
label.new(bar_index , oscLBR, "R Bear", style=label.style_label_down, color=noneColor, textcolor=textColor)
if hiddenBullCond
leftBar = ta.valuewhen(plFound, bar_index , 1)
line.new(leftBar, prevPlOsc, bar_index , oscLBR, xloc=xloc.bar_index, color=bullColor, width=2, style=line.style_dashed)
label.new(bar_index , oscLBR, "H Bull", style=label.style_label_up, color=noneColor, textcolor=textColor)
if hiddenBearCond
leftBar = ta.valuewhen(phFound, bar_index , 1)
line.new(leftBar, prevPhOsc, bar_index , oscLBR, xloc=xloc.bar_index, color=bearColor, width=2, style=line.style_dashed)
label.new(bar_index , oscLBR, "H Bear", style=label.style_label_down, color=noneColor, textcolor=textColor)
// Alert conditions
alertcondition(bullCond, title="Regular Bullish Divergence", message="Found a new Regular Bullish Divergence, Pivot Lookback Right number of bars to the left of the current bar.")
alertcondition(bearCond, title="Regular Bearish Divergence", message="Found a new Regular Bearish Divergence, Pivot Lookback Right number of bars to the left of the current bar.")
alertcondition(hiddenBullCond, title="Hidden Bullish Divergence", message="Found a new Hidden Bullish Divergence, Pivot Lookback Right number of bars to the left of the current bar.")
alertcondition(hiddenBearCond, title="Hidden Bearish Divergence", message="Found a new Hidden Bearish Divergence, Pivot Lookback Right number of bars to the left of the current bar.")

RSI WMA VWMA Divergence Indicator//@version=6
indicator(title="RSI WMA VWMA Divergence Indicator", shorttitle="Osc Div", format=format.price, precision=2)
oscType = input.string("RSI", "Oscillator Type", options = , group="General Settings")
// RSI Settings
rsiGroup = "RSI Settings"
rsiLengthInput = input.int(14, minval=1, title="RSI Length", group=rsiGroup)
rsiSourceInput = input.source(close, "Source", group=rsiGroup)
// WMA VWMA
wma9 = ta.wma(close, 9)
vwma3 = ta.vwma(close, 3)
useVWMA = input.bool(true, "Use VWMA3 for Divergence (when WMA9 + VWMA3 mode)", group="WMA Settings")
// Oscillator selection
rsi = ta.rsi(rsiSourceInput, rsiLengthInput) // Calculate RSI always, but use conditionally
osc = oscType == "RSI" ? rsi : useVWMA ? vwma3 : wma9
// RSI plots (conditional)
isRSI = oscType == "RSI"
rsiPlot = plot(isRSI ? rsi : na, "RSI", color=isRSI ? #7E57C2 : na)
rsiUpperBand = hline(isRSI ? 70 : na, "RSI Upper Band", color=isRSI ? #787B86 : na)
midline = hline(isRSI ? 50 : na, "RSI Middle Band", color=isRSI ? color.new(#787B86, 50) : na)
rsiLowerBand = hline(isRSI ? 30 : na, "RSI Lower Band", color=isRSI ? #787B86 : na)
fill(rsiUpperBand, rsiLowerBand, color=isRSI ? color.rgb(126, 87, 194, 90) : na, title="RSI Background Fill")
midLinePlot = plot(isRSI ? 50 : na, color = na, editable = false, display = display.none)
fill(rsiPlot, midLinePlot, 100, 70, top_color = isRSI ? color.new(color.green, 0) : na, bottom_color = isRSI ? color.new(color.green, 100) : na, title = "Overbought Gradient Fill")
fill(rsiPlot, midLinePlot, 30, 0, top_color = isRSI ? color.new(color.red, 100) : na, bottom_color = isRSI ? color.new(color.red, 0) : na, title = "Oversold Gradient Fill")
// WMA VWMA plots
plot(oscType != "RSI" ? wma9 : na, "WMA9", color=oscType != "RSI" ? color.blue : na)
plot(oscType != "RSI" ? vwma3 : na, "VWMA3", color=oscType != "RSI" ? color.orange : na)
// Smoothing MA inputs (only for RSI)
GRP = "Smoothing (RSI only)"
TT_BB = "Only applies when 'SMA + Bollinger Bands' is selected. Determines the distance between the SMA and the bands."
maTypeInput = input.string("SMA", "Type", options = , group = GRP, display = display.data_window)
maLengthInput = input.int(14, "Length", group = GRP, display = display.data_window)
bbMultInput = input.float(2.0, "BB StdDev", minval = 0.001, maxval = 50, step = 0.5, tooltip = TT_BB, group = GRP, display = display.data_window)
enableMA = maTypeInput != "None" and oscType == "RSI"
isBB = maTypeInput == "SMA + Bollinger Bands" and oscType == "RSI"
// Smoothing MA Calculation
ma(source, length, MAtype) =>
switch MAtype
"SMA" => ta.sma(source, length)
"SMA + Bollinger Bands" => ta.sma(source, length)
"EMA" => ta.ema(source, length)
"SMMA (RMA)" => ta.rma(source, length)
"WMA" => ta.wma(source, length)
"VWMA" => ta.vwma(source, length)
// Smoothing MA plots
smoothingMA = enableMA ? ma(rsi, maLengthInput, maTypeInput) : na
smoothingStDev = isBB ? ta.stdev(rsi, maLengthInput) * bbMultInput : na
plot(smoothingMA, "RSI-based MA", color=enableMA ? color.yellow : na, display = enableMA ? display.all : display.none, editable = enableMA)
bbUpperBand = plot(isBB ? smoothingMA + smoothingStDev : na, title = "Upper Bollinger Band", color=isBB ? color.green : na, display = isBB ? display.all : display.none, editable = isBB)
bbLowerBand = plot(isBB ? smoothingMA - smoothingStDev : na, title = "Lower Bollinger Band", color=isBB ? color.green : na, display = isBB ? display.all : display.none, editable = isBB)
fill(bbUpperBand, bbLowerBand, color= isBB ? color.new(color.green, 90) : na, title="Bollinger Bands Background Fill", display = isBB ? display.all : display.none, editable = isBB)
// Divergence Settings
divGroup = "Divergence Settings"
calculateDivergence = input.bool(true, title="Calculate Divergence", group=divGroup, tooltip = "Calculating divergences is needed in order for divergence alerts to fire.")
lookbackLeft = input.int(5, "Pivot Lookback Left", minval=1, group=divGroup)
lookbackRight = input.int(5, "Pivot Lookback Right", minval=1, group=divGroup)
rangeLower = input.int(5, "Min Range for Divergence", minval=0, group=divGroup)
rangeUpper = input.int(60, "Max Range for Divergence", minval=1, group=divGroup)
showHidden = input.bool(true, "Show Hidden Divergences", group=divGroup)
bearColor = color.red
bullColor = color.green
textColor = color.white
noneColor = color.new(color.white, 100)
_inRange(cond) =>
bars = ta.barssince(cond)
rangeLower <= bars and bars <= rangeUpper
bool plFound = false
bool phFound = false
bool bullCond = false
bool bearCond = false
bool hiddenBullCond = false
bool hiddenBearCond = false
float oscLBR = na
float lowLBR = na
float highLBR = na
float prevPlOsc = na
float prevPlLow = na
float prevPhOsc = na
float prevPhHigh = na
if calculateDivergence
plFound := not na(ta.pivotlow(osc, lookbackLeft, lookbackRight))
phFound := not na(ta.pivothigh(osc, lookbackLeft, lookbackRight))
oscLBR := osc
lowLBR := low
highLBR := high
prevPlOsc := ta.valuewhen(plFound, oscLBR, 1)
prevPlLow := ta.valuewhen(plFound, lowLBR, 1)
prevPhOsc := ta.valuewhen(phFound, oscLBR, 1)
prevPhHigh := ta.valuewhen(phFound, highLBR, 1)
// Regular Bullish
oscHL = oscLBR > prevPlOsc and _inRange(plFound )
priceLL = lowLBR < prevPlLow
bullCond := priceLL and oscHL and plFound
// Regular Bearish
oscLL = oscLBR < prevPhOsc and _inRange(phFound )
priceHH = highLBR > prevPhHigh
bearCond := priceHH and oscLL and phFound
// Hidden Bullish
oscLL_hidden = oscLBR < prevPlOsc and _inRange(plFound )
priceHL = lowLBR > prevPlLow
hiddenBullCond := priceHL and oscLL_hidden and plFound and showHidden
// Hidden Bearish
oscHH_hidden = oscLBR > prevPhOsc and _inRange(phFound )
priceLH = highLBR < prevPhHigh
hiddenBearCond := priceLH and oscHH_hidden and phFound and showHidden
// Plot divergences (lines and labels on pane)
if bullCond
leftBar = ta.valuewhen(plFound, bar_index , 1)
line.new(leftBar, prevPlOsc, bar_index , oscLBR, xloc=xloc.bar_index, color=bullColor, width=2)
label.new(bar_index , oscLBR, "R Bull", style=label.style_label_up, color=noneColor, textcolor=textColor)
if bearCond
leftBar = ta.valuewhen(phFound, bar_index , 1)
line.new(leftBar, prevPhOsc, bar_index , oscLBR, xloc=xloc.bar_index, color=bearColor, width=2)
label.new(bar_index , oscLBR, "R Bear", style=label.style_label_down, color=noneColor, textcolor=textColor)
if hiddenBullCond
leftBar = ta.valuewhen(plFound, bar_index , 1)
line.new(leftBar, prevPlOsc, bar_index , oscLBR, xloc=xloc.bar_index, color=bullColor, width=2, style=line.style_dashed)
label.new(bar_index , oscLBR, "H Bull", style=label.style_label_up, color=noneColor, textcolor=textColor)
if hiddenBearCond
leftBar = ta.valuewhen(phFound, bar_index , 1)
line.new(leftBar, prevPhOsc, bar_index , oscLBR, xloc=xloc.bar_index, color=bearColor, width=2, style=line.style_dashed)
label.new(bar_index , oscLBR, "H Bear", style=label.style_label_down, color=noneColor, textcolor=textColor)
// Alert conditions
alertcondition(bullCond, title="Regular Bullish Divergence", message="Found a new Regular Bullish Divergence, Pivot Lookback Right number of bars to the left of the current bar.")
alertcondition(bearCond, title="Regular Bearish Divergence", message="Found a new Regular Bearish Divergence, Pivot Lookback Right number of bars to the left of the current bar.")
alertcondition(hiddenBullCond, title="Hidden Bullish Divergence", message="Found a new Hidden Bullish Divergence, Pivot Lookback Right number of bars to the left of the current bar.")
alertcondition(hiddenBearCond, title="Hidden Bearish Divergence", message="Found a new Hidden Bearish Divergence, Pivot Lookback Right number of bars to the left of the current bar.")

Market Zone Analyzer[BullByte]Understanding the Market Zone Analyzer
---
1. Purpose of the Indicator
The Market Zone Analyzer is a Pine Script™ (version 6) indicator designed to streamline market analysis on TradingView. Rather than scanning multiple separate tools, it unifies four core dimensions—trend strength, momentum, price action, and market activity—into a single, consolidated view. By doing so, it helps traders:
• Save time by avoiding manual cross-referencing of disparate signals.
• Reduce decision-making errors that can arise from juggling multiple indicators.
• Gain a clear, reliable read on whether the market is in a bullish, bearish, or sideways phase, so they can more confidently decide to enter, exit, or hold a position.
---
2. Why a Trader Should Use It
• Unified View: Combines all essential market dimensions into one easy-to-read score and dashboard, eliminating the need to piece together signals manually.
• Adaptability: Automatically adjusts its internal weighting for trend, momentum, and price action based on current volatility. Whether markets are choppy or calm, the indicator remains relevant.
• Ease of Interpretation: Outputs a simple “BULLISH,” “BEARISH,” or “SIDEWAYS” label, supplemented by an intuitive on-chart dashboard and an oscillator plot that visually highlights market direction.
• Reliability Features: Built-in smoothing of the net score and hysteresis logic (requiring consecutive confirmations before flips) minimize false signals during noisy or range-bound phases.
---
3. Why These Specific Indicators?
This script relies on a curated set of well-established technical tools, each chosen for its particular strength in measuring one of the four core dimensions:
1. Trend Strength:
• ADX/DMI (Average Directional Index / Directional Movement Index): Measures how strong a trend is, and whether the +DI line is above the –DI line (bullish) or vice versa (bearish).
• Moving Average Slope (Fast MA vs. Slow MA): Compares a shorter-period SMA to a longer-period SMA; if the fast MA sits above the slow MA, it confirms an uptrend, and vice versa for a downtrend.
• Ichimoku Cloud Differential (Senkou A vs. Senkou B): Provides a forward-looking view of trend direction; Senkou A above Senkou B signals bullishness, and the opposite signals bearishness.
2. Momentum:
• Relative Strength Index (RSI): Identifies overbought (above its dynamically calculated upper bound) or oversold (below its lower bound) conditions; changes in RSI often precede price reversals.
• Stochastic %K: Highlights shifts in short-term momentum by comparing closing price to the recent high/low range; values above its upper band signal bullish momentum, below its lower band signal bearish momentum.
• MACD Histogram: Measures the difference between the MACD line and its signal line; a positive histogram indicates upward momentum, a negative histogram indicates downward momentum.
3. Price Action:
• Highest High / Lowest Low (HH/LL) Range: Over a defined lookback period, this captures breakout or breakdown levels. A closing price near the recent highs (with a positive MA slope) yields a bullish score, and near the lows (with a negative MA slope) yields a bearish score.
• Heikin-Ashi Doji Detection: Uses Heikin-Ashi candles to identify indecision or continuation patterns. A small Heikin-Ashi body (doji) relative to recent volatility is scored as neutral; a larger body in the direction of the MA slope is scored bullish or bearish.
• Candle Range Measurement: Compares each candle’s high-low range against its own dynamic band (average range ± standard deviation). Large candles aligning with the prevailing trend score bullish or bearish accordingly; unusually small candles can indicate exhaustion or consolidation.
4. Market Activity:
• Bollinger Bands Width (BBW): Measures the distance between BB upper and lower bands; wide bands indicate high volatility, narrow bands indicate low volatility.
• Average True Range (ATR): Quantifies average price movement (volatility). A sudden spike in ATR suggests a volatile environment, while a contraction suggests calm.
• Keltner Channels Width (KCW): Similar to BBW but uses ATR around an EMA. Provides a second layer of volatility context, confirming or contrasting BBW readings.
• Volume (with Moving Average): Compares current volume to its moving average ± standard deviation. High volume validates strong moves; low volume signals potential lack of conviction.
By combining these tools, the indicator captures trend direction, momentum strength, price-action nuances, and overall market energy, yielding a more balanced and comprehensive assessment than any single tool alone.
---
4. What Makes This Indicator Stand Out
• Multi-Dimensional Analysis: Rather than relying on a lone oscillator or moving average crossover, it simultaneously evaluates trend, momentum, price action, and activity.
• Dynamic Weighting: The relative importance of trend, momentum, and price action adjusts automatically based on real-time volatility (Market Activity State). For example, in highly volatile conditions, trend and momentum signals carry more weight; in calm markets, price action signals are prioritized.
• Stability Mechanisms:
• Smoothing: The net score is passed through a short moving average, filtering out noise, especially on lower timeframes.
• Hysteresis: Both Market Activity State and the final bullish/bearish/sideways zone require two consecutive confirmations before flipping, reducing whipsaw.
• Visual Interpretation: A fully customizable on-chart dashboard displays each sub-indicator’s value, regime, score, and comment, all color-coded. The oscillator plot changes color to reflect the current market zone (green for bullish, red for bearish, gray for sideways) and shows horizontal threshold lines at +2, 0, and –2.
---
5. Recommended Timeframes
• Short-Term (5 min, 15 min): Day traders and scalpers can benefit from rapid signals, but should enable smoothing (and possibly disable hysteresis) to reduce false whipsaws.
• Medium-Term (1 h, 4 h): Swing traders find a balance between responsiveness and reliability. Less smoothing is required here, and the default parameters (e.g., ADX length = 14, RSI length = 14) perform well.
• Long-Term (Daily, Weekly): Position traders tracking major trends can disable smoothing for immediate raw readings, since higher-timeframe noise is minimal. Adjust lookback lengths (e.g., increase adxLength, rsiLength) if desired for slower signals.
Tip: If you keep smoothing off, stick to timeframes of 1 h or higher to avoid excessive signal “chatter.”
---
6. How Scoring Works
A. Individual Indicator Scores
Each sub-indicator is assigned one of three discrete scores:
• +1 if it indicates a bullish condition (e.g., RSI above its dynamically calculated upper bound).
• 0 if it is neutral (e.g., RSI between upper and lower bounds).
• –1 if it indicates a bearish condition (e.g., RSI below its dynamically calculated lower bound).
Examples of individual score assignments:
• ADX/DMI:
• +1 if ADX ≥ adxThreshold and +DI > –DI (strong bullish trend)
• –1 if ADX ≥ adxThreshold and –DI > +DI (strong bearish trend)
• 0 if ADX < adxThreshold (trend strength below threshold)
• RSI:
• +1 if RSI > RSI_upperBound
• –1 if RSI < RSI_lowerBound
• 0 otherwise
• ATR (as part of Market Activity):
• +1 if ATR > (ATR_MA + stdev(ATR))
• –1 if ATR < (ATR_MA – stdev(ATR))
• 0 otherwise
Each of the four main categories shares this same +1/0/–1 logic across their sub-components.
B. Category Scores
Once each sub-indicator reports +1, 0, or –1, these are summed within their categories as follows:
• Trend Score = (ADX score) + (MA slope score) + (Ichimoku differential score)
• Momentum Score = (RSI score) + (Stochastic %K score) + (MACD histogram score)
• Price Action Score = (Highest-High/Lowest-Low score) + (Heikin-Ashi doji score) + (Candle range score)
• Market Activity Raw Score = (BBW score) + (ATR score) + (KC width score) + (Volume score)
Each category’s summed value can range between –3 and +3 (for Trend, Momentum, and Price Action), and between –4 and +4 for Market Activity raw.
C. Market Activity State and Dynamic Weight Adjustments
Rather than contributing directly to the netScore like the other three categories, Market Activity determines how much weight to assign to Trend, Momentum, and Price Action:
1. Compute Market Activity Raw Score by summing BBW, ATR, KCW, and Volume individual scores (each +1/0/–1).
2. Bucket into High, Medium, or Low Activity:
• High if raw Score ≥ 2 (volatile market).
• Low if raw Score ≤ –2 (calm market).
• Medium otherwise.
3. Apply Hysteresis (if enabled): The state only flips after two consecutive bars register the same high/low/medium label.
4. Set Category Weights:
• High Activity: Trend = 50 %, Momentum = 35 %, Price Action = 15 %.
• Low Activity: Trend = 25 %, Momentum = 20 %, Price Action = 55 %.
• Medium Activity: Use the trader’s base weight inputs (e.g., Trend = 40 %, Momentum = 30 %, Price Action = 30 % by default).
D. Calculating the Net Score
5. Normalize Base Weights (so that the sum of Trend + Momentum + Price Action always equals 100 %).
6. Determine Current Weights based on the Market Activity State (High/Medium/Low).
7. Compute Each Category’s Contribution: Multiply (categoryScore) × (currentWeight).
8. Sum Contributions to get the raw netScore (a floating-point value that can exceed ±3 when scores are strong).
9. Smooth the netScore over two bars (if smoothing is enabled) to reduce noise.
10. Apply Hysteresis to the Final Zone:
• If the smoothed netScore ≥ +2, the bar is classified as “Bullish.”
• If the smoothed netScore ≤ –2, the bar is classified as “Bearish.”
• Otherwise, it is “Sideways.”
• To prevent rapid flips, the script requires two consecutive bars in the new zone before officially changing the displayed zone (if hysteresis is on).
E. Thresholds for Zone Classification
• BULLISH: netScore ≥ +2
• BEARISH: netScore ≤ –2
• SIDEWAYS: –2 < netScore < +2
---
7. Role of Volatility (Market Activity State) in Scoring
Volatility acts as a dynamic switch that shifts which category carries the most influence:
1. High Activity (Volatile):
• Detected when at least two sub-scores out of BBW, ATR, KCW, and Volume equal +1.
• The script sets Trend weight = 50 % and Momentum weight = 35 %. Price Action weight is minimized at 15 %.
• Rationale: In volatile markets, strong trending moves and momentum surges dominate, so those signals are more reliable than nuanced candle patterns.
2. Low Activity (Calm):
• Detected when at least two sub-scores out of BBW, ATR, KCW, and Volume equal –1.
• The script sets Price Action weight = 55 %, Trend = 25 %, and Momentum = 20 %.
• Rationale: In quiet, sideways markets, subtle price-action signals (breakouts, doji patterns, small-range candles) are often the best early indicators of a new move.
3. Medium Activity (Balanced):
• Raw Score between –1 and +1 from the four volatility metrics.
• Uses whatever base weights the trader has specified (e.g., Trend = 40 %, Momentum = 30 %, Price Action = 30 %).
Because volatility can fluctuate rapidly, the script employs hysteresis on Market Activity State: a new High or Low state must occur on two consecutive bars before weights actually shift. This avoids constant back-and-forth weight changes and provides more stability.
---
8. Scoring Example (Hypothetical Scenario)
• Symbol: Bitcoin on a 1-hour chart.
• Market Activity: Raw volatility sub-scores show BBW (+1), ATR (+1), KCW (0), Volume (+1) → Total raw Score = +3 → High Activity.
• Weights Selected: Trend = 50 %, Momentum = 35 %, Price Action = 15 %.
• Trend Signals:
• ADX strong and +DI > –DI → +1
• Fast MA above Slow MA → +1
• Ichimoku Senkou A > Senkou B → +1
→ Trend Score = +3
• Momentum Signals:
• RSI above upper bound → +1
• MACD histogram positive → +1
• Stochastic %K within neutral zone → 0
→ Momentum Score = +2
• Price Action Signals:
• Highest High/Lowest Low check yields 0 (close not near extremes)
• Heikin-Ashi doji reading is neutral → 0
• Candle range slightly above upper bound but trend is strong, so → +1
→ Price Action Score = +1
• Compute Net Score (before smoothing):
• Trend contribution = 3 × 0.50 = 1.50
• Momentum contribution = 2 × 0.35 = 0.70
• Price Action contribution = 1 × 0.15 = 0.15
• Raw netScore = 1.50 + 0.70 + 0.15 = 2.35
• Since 2.35 ≥ +2 and hysteresis is met, the final zone is “Bullish.”
Although the netScore lands at 2.35 (Bullish), smoothing might bring it slightly below 2.00 on the first bar (e.g., 1.90), in which case the script would wait for a second consecutive reading above +2 before officially classifying the zone as Bullish (if hysteresis is enabled).
---
9. Correlation Between Categories
The four categories—Trend Strength, Momentum, Price Action, and Market Activity—often reinforce or offset one another. The script takes advantage of these natural correlations:
• Bullish Alignment: If ADX is strong and pointed upward, fast MA is above slow MA, and Ichimoku is positive, that usually coincides with RSI climbing above its upper bound and the MACD histogram turning positive. In such cases, both Trend and Momentum categories generate +1 or +2. Because the Market Activity State is likely High (given the accompanying volatility), Trend and Momentum weights are at their peak, so the netScore quickly crosses into Bullish territory.
• Sideways/Consolidation: During a low-volatility, sideways phase, ADX may fall below its threshold, MAs may flatten, and RSI might hover in the neutral band. However, subtle price-action signals (like a small breakout candle or a Heikin-Ashi candle with a slight bias) can still produce a +1 in the Price Action category. If Market Activity is Low, Price Action’s weight (55 %) can carry enough influence—even if Trend and Momentum are neutral—to push the netScore out of “Sideways” into a mild bullish or bearish bias.
• Opposing Signals: When Trend is bullish but Momentum turns negative (for example, price continues up but RSI rolls over), the two scores can partially cancel. Market Activity may remain Medium, in which case the netScore lingers near zero (Sideways). The trader can then wait for either a clearer momentum shift or a fresh price-action breakout before committing.
By dynamically recognizing these correlations and adjusting weights, the indicator ensures that:
• When Trend and Momentum align (and volatility supports it), the netScore leaps strongly into Bullish or Bearish.
• When Trend is neutral but Price Action shows an early move in a low-volatility environment, Price Action’s extra weight in the Low Activity State can still produce actionable signals.
---
10. Market Activity State & Its Role (Detailed)
The Market Activity State is not a direct category score—it is an overarching context setter for how heavily to trust Trend, Momentum, or Price Action. Here’s how it is derived and applied:
1. Calculate Four Volatility Sub-Scores:
• BBW: Compare the current band width to its own moving average ± standard deviation. If BBW > (BBW_MA + stdev), assign +1 (high volatility); if BBW < (BBW_MA × 0.5), assign –1 (low volatility); else 0.
• ATR: Compare ATR to its moving average ± standard deviation. A spike above the upper threshold is +1; a contraction below the lower threshold is –1; otherwise 0.
• KCW: Same logic as ATR but around the KCW mean.
• Volume: Compare current volume to its volume MA ± standard deviation. Above the upper threshold is +1; below the lower threshold is –1; else 0.
2. Sum Sub-Scores → Raw Market Activity Score: Range between –4 and +4.
3. Assign Market Activity State:
• High Activity: Raw Score ≥ +2 (at least two volatility metrics are strongly spiking).
• Low Activity: Raw Score ≤ –2 (at least two metrics signal unusually low volatility or thin volume).
• Medium Activity: Raw Score is between –1 and +1 inclusive.
4. Hysteresis for Stability:
• If hysteresis is enabled, a new state only takes hold after two consecutive bars confirm the same High, Medium, or Low label.
• This prevents the Market Activity State from bouncing around when volatility is on the fence.
5. Set Category Weights Based on Activity State:
• High Activity: Trend = 50 %, Momentum = 35 %, Price Action = 15 %.
• Low Activity: Trend = 25 %, Momentum = 20 %, Price Action = 55 %.
• Medium Activity: Use trader’s base weights (e.g., Trend = 40 %, Momentum = 30 %, Price Action = 30 %).
6. Impact on netScore: Because category scores (–3 to +3) multiply by these weights, High Activity amplifies the effect of strong Trend and Momentum scores; Low Activity amplifies the effect of Price Action.
7. Market Context Tooltip: The dashboard includes a tooltip summarizing the current state—e.g., “High activity, trend and momentum prioritized,” “Low activity, price action prioritized,” or “Balanced market, all categories considered.”
---
11. Category Weights: Base vs. Dynamic
Traders begin by specifying base weights for Trend Strength, Momentum, and Price Action that sum to 100 %. These apply only when volatility is in the Medium band. Once volatility shifts:
• High Volatility Overrides:
• Trend jumps from its base (e.g., 40 %) to 50 %.
• Momentum jumps from its base (e.g., 30 %) to 35 %.
• Price Action is reduced to 15 %.
Example: If base weights were Trend = 40 %, Momentum = 30 %, Price Action = 30 %, then in High Activity they become 50/35/15. A Trend score of +3 now contributes 3 × 0.50 = +1.50 to netScore; a Momentum +2 contributes 2 × 0.35 = +0.70. In total, Trend + Momentum can easily push netScore above the +2 threshold on its own.
• Low Volatility Overrides:
• Price Action leaps from its base (30 %) to 55 %.
• Trend falls to 25 %, Momentum falls to 20 %.
Why? When markets are quiet, subtle candle breakouts, doji patterns, and small-range expansions tend to foreshadow the next swing more effectively than raw trend readings. A Price Action score of +3 in this state contributes 3 × 0.55 = +1.65, which can carry the netScore toward +2—even if Trend and Momentum are neutral or only mildly positive.
Because these weight shifts happen only after two consecutive bars confirm a High or Low state (if hysteresis is on), the indicator avoids constantly flipping its emphasis during borderline volatility phases.
---
12. Dominant Category Explained
Within the dashboard, a label such as “Trend Dominant,” “Momentum Dominant,” or “Price Action Dominant” appears when one category’s absolute weighted contribution to netScore is the largest. Concretely:
• Compute each category’s weighted contribution = (raw category score) × (current weight).
• Compare the absolute values of those three contributions.
• The category with the highest absolute value is flagged as Dominant for that bar.
Why It Matters:
• Momentum Dominant: Indicates that the combined force of RSI, Stochastic, and MACD (after weighting) is pushing netScore farther than either Trend or Price Action. In practice, it means that short-term sentiment and speed of change are the primary drivers right now, so traders should watch for continued momentum signals before committing to a trade.
• Trend Dominant: Means ADX, MA slope, and Ichimoku (once weighted) outweigh the other categories. This suggests a strong directional move is in place; trend-following entries or confirming pullbacks are likely to succeed.
• Price Action Dominant: Occurs when breakout/breakdown patterns, Heikin-Ashi candle readings, and range expansions (after weighting) are the most influential. This often happens in calmer markets, where subtle shifts in candle structure can foreshadow bigger moves.
By explicitly calling out which category is carrying the most weight at any moment, the dashboard gives traders immediate insight into why the netScore is tilting toward bullish, bearish, or sideways.
---
13. Oscillator Plot: How to Read It
The “Net Score” oscillator sits below the dashboard and visually displays the smoothed netScore as a line graph. Key features:
1. Value Range: In normal conditions it oscillates roughly between –3 and +3, but extreme confluences can push it outside that range.
2. Horizontal Threshold Lines:
• +2 Line (Bullish threshold)
• 0 Line (Neutral midline)
• –2 Line (Bearish threshold)
3. Zone Coloring:
• Green Background (Bullish Zone): When netScore ≥ +2.
• Red Background (Bearish Zone): When netScore ≤ –2.
• Gray Background (Sideways Zone): When –2 < netScore < +2.
4. Dynamic Line Color:
• The plotted netScore line itself is colored green in a Bullish Zone, red in a Bearish Zone, or gray in a Sideways Zone, creating an immediate visual cue.
Interpretation Tips:
• Crossing Above +2: Signals a strong enough combined trend/momentum/price-action reading to classify as Bullish. Many traders wait for a clear crossing plus a confirmation candle before entering a long position.
• Crossing Below –2: Indicates a strong Bearish signal. Traders may consider short or exit strategies.
• Rising Slope, Even Below +2: If netScore climbs steadily from neutral toward +2, it demonstrates building bullish momentum.
• Divergence: If price makes a higher high but the oscillator fails to reach a new high, it can warn of weakening momentum and a potential reversal.
---
14. Comments and Their Necessity
Every sub-indicator (ADX, MA slope, Ichimoku, RSI, Stochastic, MACD, HH/LL, Heikin-Ashi, Candle Range, BBW, ATR, KCW, Volume) generates a short comment that appears in the detailed dashboard. Examples:
• “Strong bullish trend” or “Strong bearish trend” for ADX/DMI
• “Fast MA above slow MA” or “Fast MA below slow MA” for MA slope
• “RSI above dynamic threshold” or “RSI below dynamic threshold” for RSI
• “MACD histogram positive” or “MACD histogram negative” for MACD Hist
• “Price near highs” or “Price near lows” for HH/LL checks
• “Bullish Heikin Ashi” or “Bearish Heikin Ashi” for HA Doji scoring
• “Large range, trend confirmed” or “Small range, trend contradicted” for Candle Range
Additionally, the top-row comment for each category is:
• Trend: “Highly Bullish,” “Highly Bearish,” or “Neutral Trend.”
• Momentum: “Strong Momentum,” “Weak Momentum,” or “Neutral Momentum.”
• Price Action: “Bullish Action,” “Bearish Action,” or “Neutral Action.”
• Market Activity: “Volatile Market,” “Calm Market,” or “Stable Market.”
Reasons for These Comments:
• Transparency: Shows exactly how each sub-indicator contributed to its category score.
• Education: Helps traders learn why a category is labeled bullish, bearish, or neutral, building intuition over time.
• Customization: If, for example, the RSI comment says “RSI neutral” despite an impending trend shift, a trader might choose to adjust RSI length or thresholds.
In the detailed dashboard, hovering over each comment cell also reveals a tooltip with additional context (e.g., “Fast MA above slow MA” or “Senkou A above Senkou B”), helping traders understand the precise rule behind that +1, 0, or –1 assignment.
---
15. Real-Life Example (Consolidated)
• Instrument & Timeframe: Bitcoin (BTCUSD), 1-hour chart.
• Current Market Activity: BBW and ATR both spike (+1 each), KCW is moderately high (+1), but volume is only neutral (0) → Raw Market Activity Score = +2 → State = High Activity (after two bars, if hysteresis is on).
• Category Weights Applied: Trend = 50 %, Momentum = 35 %, Price Action = 15 %.
• Trend Sub-Scores:
1. ADX = 25 (above threshold 20) with +DI > –DI → +1.
2. Fast MA (20-period) sits above Slow MA (50-period) → +1.
3. Ichimoku: Senkou A > Senkou B → +1.
→ Trend Score = +3.
• Momentum Sub-Scores:
4. RSI = 75 (above its moving average +1 stdev) → +1.
5. MACD histogram = +0.15 → +1.
6. Stochastic %K = 50 (mid-range) → 0.
→ Momentum Score = +2.
• Price Action Sub-Scores:
7. Price is not within 1 % of the 20-period high/low and slope = positive → 0.
8. Heikin-Ashi body is slightly larger than stdev over last 5 bars with haClose > haOpen → +1.
9. Candle range is just above its dynamic upper bound but trend is already captured, so → +1.
→ Price Action Score = +2.
• Calculate netScore (before smoothing):
• Trend contribution = 3 × 0.50 = 1.50
• Momentum contribution = 2 × 0.35 = 0.70
• Price Action contribution = 2 × 0.15 = 0.30
• Raw netScore = 1.50 + 0.70 + 0.30 = 2.50 → Immediately classified as Bullish.
• Oscillator & Dashboard Output:
• The oscillator line crosses above +2 and turns green.
• Dashboard displays:
• Trend Regime “BULLISH,” Trend Score = 3, Comment = “Highly Bullish.”
• Momentum Regime “BULLISH,” Momentum Score = 2, Comment = “Strong Momentum.”
• Price Action Regime “BULLISH,” Price Action Score = 2, Comment = “Bullish Action.”
• Market Activity State “High,” Comment = “Volatile Market.”
• Weights: Trend 50 %, Momentum 35 %, Price Action 15 %.
• Dominant Category: Trend (because 1.50 > 0.70 > 0.30).
• Overall Score: 2.50, posCount = (three +1s in Trend) + (two +1s in Momentum) + (two +1s in Price Action) = 7 bullish signals, negCount = 0.
• Final Zone = “BULLISH.”
• The trader sees that both Trend and Momentum are reinforcing each other under high volatility. They might wait one more candle for confirmation but already have strong evidence to consider a long.
---
• .
---
Disclaimer
This indicator is strictly a technical analysis tool and does not constitute financial advice. All trading involves risk, including potential loss of capital. Past performance is not indicative of future results. Traders should:
• Always backtest the “Market Zone Analyzer ” on their chosen symbols and timeframes before committing real capital.
• Combine this tool with sound risk management, position sizing, and, if possible, fundamental analysis.
• Understand that no indicator is foolproof; always be prepared for unexpected market moves.
Goodluck
-BullByte!
---

BTC Markup/Markdown Zones by Koenigsegg📈 BTC Markup/Markdown Zones
A handcrafted indicator designed to mark Bitcoin's most critical High Time Frame (HTF) structure shifts. This tool overlays true institutional-level Markup and Markdown Zones, selected manually after deep market review. Whether you're testing strategies or actively trading, this tool gives you the bigger picture at all times.
🔍 Key Features:
✅ HTF Markup & Markdown Zones
Every zone is manually selected — no indicators, no repainting. Just raw market history and real structure.
✅ Two Display Modes
• Background Zones — soft overlays with low opacity for visual context — with the option to increase opacity manually if desired.
• Start Candle Highlight — sharply highlighted candle marking the final pivot before a macro reversal.
✅ Custom Color Controls (Style Tab)
All visual styling lives in the Style tab, with clearly labeled fields:
• Markup Zone
• Markdown Zone
• Start Candle Highlight Markup
• Start Candle Highlight Markdown
✅ Minimal Input Section
Just one toggle: display mode. Everything else is kept clean and intuitive.
🧠 Purpose:
This script is made for any timeframe:
• Zoom into lower timeframes to know whether you're trading inside a Markup or Markdown
• Use it during strategy testing for true structural awareness
📅 Handpicked Macro Turning Points:
Each zone originates from a manually confirmed candle — the last meaningful candle before a shift in control between bulls and bears:
• FRI 19 AUG 2011 12PM – MARK DOWN
• THU 20 OCT 2011 12AM – MARK UP
• WED 10 APR 2013 12PM – MARK DOWN
• FRI 12 APR 2013 12PM – MARK UP
• SAT 30 NOV 2013 12AM – MARK DOWN
• WED 14 JAN 2015 12PM – MARK UP
• SUN 17 DEC 2017 12PM – MARK DOWN
• SAT 15 DEC 2018 12PM – MARK UP
• WED 14 APR 2021 4AM – MARK DOWN
• TUE 22 JUN 2021 12PM – MARK UP
• WED 10 NOV 2021 12PM – MARK DOWN
• MON 21 NOV 2022 8PM – MARK UP
• THU 14 MAR 2024 4AM – MARK DOWN
• MON 5 AUG 2024 12PM – MARK UP
• MON 20 JAN 2025 4AM – MARK DOWN
💡 Zones are manually updated by me after each new confirmed Markup or Markdown.
🧬 Fractal Structure for MTF Systems
Price is fractal — meaning the same principles of structure repeat across all timeframes. In Version 2, this tool evolves by introducing manually selected sub-zones inside each High Time Frame (HTF) Markup or Markdown. These sub-zones reflect Medium Timeframe (MTF) structure shifts, offering precision for traders who operate on both intraday and swing levels.
This makes the indicator ideal for low timeframe (LTF) Markup/Markdown awareness — whether you're managing 15m entries or building multi-timeframe confluence systems.
No auto-zones. No guesswork. Just clean, intentional structure division within the broader trend, handpicked for maximum clarity and edge.
💡 Pro Tip:
When price is inside a Markup Zone, shorting becomes riskier — you're trading against a macro bullish structure.
When inside a Markdown Zone, longing becomes riskier — you're fighting against confirmed bearish momentum.
Use this tool to stay aligned with the broader move, especially when zoomed into smaller timeframes or managing entries/exits during intraday setups.
📈 Markup Phase – Bullish Sentiment
Definition: A period where price makes higher highs and higher lows — the uptrend is in full force.
Why sentiment is bullish:
- Institutions and smart money are already positioned long.
- Public/institutional demand drives prices up.
- Momentum is supported by positive news, breakouts, and FOMO.
- Higher highs confirm buyers are in control.
📉 Markdown Phase – Bearish Sentiment
Definition: A period where price makes lower lows and lower highs — clear downtrend.
Why sentiment is bearish:
- Distribution has already occurred, and supply outweighs demand.
- Smart money is short or sidelined, waiting for deeper prices.
- Panic selling or trend-following traders add downside momentum.
- Lower lows confirm sellers are in control.
❌ Trading Against the Trend — Consequences:
-Reduced Probability of Success
-You’re fighting the dominant flow. Most participants are pushing in the opposite direction.
-Drawdowns & Stop-Outs
-Countertrend trades often get wicked or flushed before any meaningful move, especially without structure-based entries.
-Low Risk-Reward Ratio
-Trends offer sustained moves. Countertrend trades may have small take-profit zones or chop.
-Mental Drain & Doubt
-Fighting momentum causes anxiety, second-guessing, and emotional reactions.
-Missed Opportunities
-Focusing on fighting the trend makes you blind to the high-probability setups with the trend.
-Increased Transaction Costs
-More stop-outs and re-entries mean more fees, more friction.
-FOMO from Watching the Trend Run
-Entering countertrend means you might watch the trend explode without you.
-Confirmation Bias & Stubbornness
-Countertrend traders often look for reasons to justify staying in the wrong direction — leading to bigger losses.
🧠 Summary
In markup = bulls dominate → you swim with the current.
In markdown = bears dominate → going long is like pushing a rock uphill.
Trading with the trend is not just safer, it's smarter. The edge lives in momentum — not ego.
⚠️ Disclaimer
This indicator is for educational and analytical use only. It is not financial advice and should not be relied on for decision-making without personal analysis.
This is not a predictive tool. No indicator can forecast upcoming price movements.
What you see here is based purely on past market behavior — specifically, historical tops and bottoms that marked the start of confirmed reversals.
This script does not know where the next reversal begins, nor can it determine where a new Markup or Markdown starts or ends. It is designed to provide context, not prediction.
Always trade with responsibility and perform your own due diligence.

Turbo Oscillator [RunRox]Introducing Turbo Oscillator by RunRox, our new indicator that combines a multitude of useful and unique features, which we will detail in this post.
List of Advanced Technologies:
Real-Time Divergences: Detects discrepancies between price movements and oscillator indicators to forecast potential price reversals.
Real-Time Hidden Divergences: We identify hidden divergences in real-time. These are not the standard type of divergences; they are opposite to regular divergences, providing unique insights into potential market movements.
Overbought and Oversold Zones: Identifies areas where the market is potentially overextended, suggesting possible entry and exit points.
Signal Line: Indicates the market direction, helping traders to quickly understand current trends.
Money Flow Histogram: Shows the flow of money into and out of the market, providing insights into buying and selling pressure.
Predicted Reversal Zones: Pinpoints areas where the market might experience reversals, aiding in strategic planning and risk management. These zones also serve as potential areas for taking profits, enhancing their utility for exit strategy planning.
Customizable Alerts: You can flexibly set up alerts for any events detected by our indicator, ensuring you stay informed about critical market movements.
To begin with, I would like to describe the difference between classic divergences and hidden divergences.
As you can see, these are opposite situations. Our oscillator identifies both types of divergences and displays them in real-time.
Divergences can serve as points where the price might reverse in the opposite direction, making both classic and hidden divergences powerful tools for spotting reversal points. I'll show a few examples of how divergences are used in our oscillator.
Classic Divergences - which we identify in real-time. As you can see, the price often reacts strongly to the formation of these divergences, frequently changing its direction.
Hidden Divergences - we also observe frequent movement in the opposite direction on the chart. The advantage of our indicator is that we show divergences in real-time without delays, allowing you to react immediately to trend changes.
Overbought and Oversold Zones - These zones allow you to see trend changes when the price is clearly overbought or oversold. When the color changes from a contrasting shade to a neutral one, you can observe the trend shift. The lines work by combining the positivity/negativity of the histogram, the positivity/negativity of the signal line, and the direction of the signal line (red/green). This sophisticated interaction provides precise insights into market conditions, making it an invaluable tool for traders.
Signal Line - This provides insights into trend changes and price reversals. The points on the line better indicate the beginning of a trend shift. These points can vary in size, offering a clearer understanding of the strength of the emerging trend. This feature works in combination with RSI, Stochastic, and MFI. RSI and MFI are top-tier indicators, while Stochastic adds responsiveness and sensitivity to trend changes, ensuring you capture every market movement accurately and promptly.
Money Flow Histogram - As shown in the example, our histogram displays the divergence between money flow and the actual price. You can see that while the price is rising, the money flow is decreasing, indicating insufficient demand for the asset and an imminent trend change. This feature uses MFI with an extended period, providing a more comprehensive and accurate analysis of market conditions. The extended period enhances the reliability of the Money Flow Index, making it an essential tool for identifying subtle shifts in market dynamics.
Predicted Reversal Zones - We automatically identify potential price reversal zones and display them above our overbought and oversold zones. In cases of strong overbought or oversold conditions, we detect potential price pullbacks and mark the beginning of a trend change. This helps you better identify trend shifts. We recommend considering these zones as potential take profit points for your trades.
Customizable Alerts - Our flexible alert system allows you to receive notifications only for the events you are interested in. These can include:
1. Classic Divergences
2. Hidden Divergences
3. Overbought or Oversold conditions on the status line
4. Strong Overbought or Oversold conditions on the status line
5. Signals from the signal line
6. Reversal zones in any direction
Our oscillator is a unique indicator that provides a comprehensive understanding of price movements. It can be used as a standalone tool for analyzing price action.
Here are a few examples of using our Oscillator in practice:
In the example above, you can see three conditions that have formed for a potential trade:
1. Clear overbought condition with a formed reversal point.
2. Decreasing Money Flow Index diverging from the rising price.
3. Formed classic divergence.
The entry point could be the formed divergence, while the exit point could be the overbought condition at the bottom of the oscillator along with the reversal points.
Here's another example of using hidden divergence, where you can see three conditions for a potential trade:
1. Overbought zone
2. Formed hidden divergence
3. Start of bearish movement indicated by the signal line
You can enter the trade either when the hidden divergence forms or wait for confirmation of the trend change by the signal line and enter the trade when the corresponding signal forms on the signal line. The exit point could be the opposite reversal point or the formation of a new hidden divergence.
We have demonstrated a few examples of how you can use our indicator, but we are confident that you will find many more applications in your own strategies.
Oscillator offers a variety of customizable parameters to tailor the indicator to your trading preferences. Here’s what our settings include:
Signal Line
Turn On/Off: Enable or disable the signal line.
Length: Set the length period for the signal line calculation.
Smooth: Adjust the smoothing level of the signal line for more accurate display.
Histogram
Turn On/Off: Enable or disable the histogram.
Length: Set the length period for the histogram calculation.
Smooth: Adjust the smoothing level of the histogram.
Other
Show Divergence Line: Display divergence lines on the chart.
Show Hidden Divergence: Display hidden divergences.
Show Status Line: Show the status line indicating overbought or oversold conditions.
Show TP Signal: Display signals for take profit.
Show Reversal Points: Display potential trend reversal points.
Delete Broken Divergence Lines: Remove broken divergence lines from the chart.
Alerts Customization
Signal Line Bull/Bear: Set alerts for bullish or bearish signals from the signal line.
TP Bull/Bear: Set alerts for take profit signals.
Status Bull/Bear: Set alerts for bullish or bearish status conditions.
Status Bull+/Bear+: Set enhanced alerts for stronger bullish or bearish status conditions.
Divergence Bull/Bear: Set alerts for bullish or bearish divergences.
Hidden Divergence Bull/Bear: Set alerts for hidden bullish or bearish divergences.
With these comprehensive settings, you can fine-tune the Oscillator to perfectly fit your trading strategy and preferences.
Our indicator utilizes technologies such as RSI, Stochastic, and Money Flow Index, with numerous enhancements from our team. It includes exclusive features such as real-time detection of hidden and classic divergences, identification of reversal points using our unique methodology, and much more.
Disclaimer:
While we consider our Turbo Oscillator to be an excellent tool, it is important to understand that past performance is not indicative of future results. We recommend approaching market analysis comprehensively, using a combination of tools and techniques to make well-informed trading decisions. Always consider the full range of market data and risks when using any trading indicator.

Defensive Nexus ShieldIndicator: Defensive Nexus Shield , capturing profits in the breakout trend.
Defensive Nexus Shield is a trend signal and support resistance display. Identify the short-term bullish and bearish defensive area through the effective extreme value of bulls and bears, and trigger trading opportunities when there are characteristics of breaking through the defensive area.
Usage:
Signal direction: "B" means that the bulls attacked and the bears failed, and entered a bullish trend. "S" means that the bears attacked and the bulls failed, entering a bearish trend.
Defense point of bulls and bears: "Blue line" represents the bearish defense line. The "green line" represents the bullish defensive line. The "purple line" represents the junction of bulls and bears.
Tip I:
Trend signal. When the signal "B" appears, it means that the bulls are attacking, and the market is bullish. Please refer to the signal for corresponding operations.
Tip II:
Breakout signal. After the trend signal appears, if the trend is confirmed, it will continue to enter the breakthrough signal.
Take the bull signal as an example. When B appears, the price continues to rise and breaks through the blue line, the bearish defense line, which triggers the bullish breakthrough signal. At this time, the bulls will strengthen. Provide signal reference for traders who do short-term breakthrough transactions.
*The signals in the indicators are for reference only and not intended as investment advice. Past performance of a strategy is not indicative of future earnings results.
Update - 2023.09.05
Optimize the alarm function. If you need to monitor the "B" or "S" signal, when creating an alarm, set the condition bar to:
Defensive Nexus Shield --> "B" or "S" --> Crossing Up --> value -> 0.5

Kịch bản của tôi//@version=6
indicator(title="Relative Strength Index", shorttitle="Gấu Trọc RSI", format=format.price, precision=2, timeframe="", timeframe_gaps=true)
rsiLengthInput = input.int(14, minval=1, title="RSI Length", group="RSI Settings")
rsiSourceInput = input.source(close, "Source", group="RSI Settings")
calculateDivergence = input.bool(false, title="Calculate Divergence", group="RSI Settings", display = display.data_window, tooltip = "Calculating divergences is needed in order for divergence alerts to fire.")
change = ta.change(rsiSourceInput)
up = ta.rma(math.max(change, 0), rsiLengthInput)
down = ta.rma(-math.min(change, 0), rsiLengthInput)
rsi = down == 0 ? 100 : up == 0 ? 0 : 100 - (100 / (1 + up / down))
rsiPlot = plot(rsi, "RSI", color=#7E57C2)
rsiUpperBand1 = hline(98, "RSI Upper Band1", color=#787B86)
rsiUpperBand = hline(70, "RSI Upper Band", color=#787B86)
midline = hline(50, "RSI Middle Band", color=color.new(#787B86, 50))
rsiLowerBand = hline(30, "RSI Lower Band", color=#787B86)
rsiLowerBand2 = hline(14, "RSI Lower Band2", color=#787B86)
fill(rsiUpperBand, rsiLowerBand, color=color.rgb(126, 87, 194, 90), title="RSI Background Fill")
midLinePlot = plot(50, color = na, editable = false, display = display.none)
fill(rsiPlot, midLinePlot, 100, 70, top_color = color.new(color.green, 0), bottom_color = color.new(color.green, 100), title = "Overbought Gradient Fill")
fill(rsiPlot, midLinePlot, 30, 0, top_color = color.new(color.red, 100), bottom_color = color.new(color.red, 0), title = "Oversold Gradient Fill")
// Smoothing MA inputs
GRP = "Smoothing"
TT_BB = "Only applies when 'SMA + Bollinger Bands' is selected. Determines the distance between the SMA and the bands."
maTypeInput = input.string("SMA", "Type", options = , group = GRP, display = display.data_window)
var isBB = maTypeInput == "SMA + Bollinger Bands"
maLengthInput = input.int(14, "Length", group = GRP, display = display.data_window, active = maTypeInput != "None")
bbMultInput = input.float(2.0, "BB StdDev", minval = 0.001, maxval = 50, step = 0.5, tooltip = TT_BB, group = GRP, display = display.data_window, active = isBB)
var enableMA = maTypeInput != "None"
// Smoothing MA Calculation
ma(source, length, MAtype) =>
switch MAtype
"SMA" => ta.sma(source, length)
"SMA + Bollinger Bands" => ta.sma(source, length)
"EMA" => ta.ema(source, length)
"SMMA (RMA)" => ta.rma(source, length)
"WMA" => ta.wma(source, length)
"VWMA" => ta.vwma(source, length)
// Smoothing MA plots
smoothingMA = enableMA ? ma(rsi, maLengthInput, maTypeInput) : na
smoothingStDev = isBB ? ta.stdev(rsi, maLengthInput) * bbMultInput : na
plot(smoothingMA, "RSI-based MA", color=color.yellow, display = enableMA ? display.all : display.none, editable = enableMA)
bbUpperBand = plot(smoothingMA + smoothingStDev, title = "Upper Bollinger Band", color=color.green, display = isBB ? display.all : display.none, editable = isBB)
bbLowerBand = plot(smoothingMA - smoothingStDev, title = "Lower Bollinger Band", color=color.green, display = isBB ? display.all : display.none, editable = isBB)
fill(bbUpperBand, bbLowerBand, color= isBB ? color.new(color.green, 90) : na, title="Bollinger Bands Background Fill", display = isBB ? display.all : display.none, editable = isBB)
// Divergence
lookbackRight = 5
lookbackLeft = 5
rangeUpper = 60
rangeLower = 5
bearColor = color.red
bullColor = color.green
textColor = color.white
noneColor = color.new(color.white, 100)
_inRange(bool cond) =>
bars = ta.barssince(cond)
rangeLower <= bars and bars <= rangeUpper
plFound = false
phFound = false
bullCond = false
bearCond = false
rsiLBR = rsi
if calculateDivergence
//------------------------------------------------------------------------------
// Regular Bullish
// rsi: Higher Low
plFound := not na(ta.pivotlow(rsi, lookbackLeft, lookbackRight))
rsiHL = rsiLBR > ta.valuewhen(plFound, rsiLBR, 1) and _inRange(plFound )
// Price: Lower Low
lowLBR = low
priceLL = lowLBR < ta.valuewhen(plFound, lowLBR, 1)
bullCond := priceLL and rsiHL and plFound
//------------------------------------------------------------------------------
// Regular Bearish
// rsi: Lower High
phFound := not na(ta.pivothigh(rsi, lookbackLeft, lookbackRight))
rsiLH = rsiLBR < ta.valuewhen(phFound, rsiLBR, 1) and _inRange(phFound )
// Price: Higher High
highLBR = high
priceHH = highLBR > ta.valuewhen(phFound, highLBR, 1)
bearCond := priceHH and rsiLH and phFound
plot(
plFound ? rsiLBR : na,
offset = -lookbackRight,
title = "Regular Bullish",
linewidth = 2,
color = (bullCond ? bullColor : noneColor),
display = display.pane,
editable = calculateDivergence)
plotshape(
bullCond ? rsiLBR : na,
offset = -lookbackRight,
title = "Regular Bullish Label",
text = " Bull ",
style = shape.labelup,
location = location.absolute,
color = bullColor,
textcolor = textColor,
display = display.pane,
editable = calculateDivergence)
plot(
phFound ? rsiLBR : na,
offset = -lookbackRight,
title = "Regular Bearish",
linewidth = 2,
color = (bearCond ? bearColor : noneColor),
display = display.pane,
editable = calculateDivergence)
plotshape(
bearCond ? rsiLBR : na,
offset = -lookbackRight,
title = "Regular Bearish Label",
text = " Bear ",
style = shape.labeldown,
location = location.absolute,
color = bearColor,
textcolor = textColor,
display = display.pane,
editable = calculateDivergence)
alertcondition(bullCond, title='Regular Bullish Divergence', message="Found a new Regular Bullish Divergence, `Pivot Lookback Right` number of bars to the left of the current bar.")
alertcondition(bearCond, title='Regular Bearish Divergence', message='Found a new Regular Bearish Divergence, `Pivot Lookback Right` number of bars to the left of the current bar.')

RSI + BB + RSI Advanced MTF Panel//@version=6
indicator(title="RSI + BB + RSI Advanced MTF Panel", shorttitle="RSI + BB + RSI Advance MTF Panel", format=format.price, precision=2, overlay=false)
bb_group = "BB (Price Overlay)"
bb_length = input.int(50, minval=1, group = bb_group)
bb_maType = input.string("SMA", "Basis MA Type", options = , group = bb_group)
bb_src = input.source(close, title="Source", group = bb_group)
bb_mult = input.float(0.2, minval=0.001, maxval=50, title="StdDev", group = bb_group)
BasisColor = input.color(color.rgb(163, 41, 245), "Basis Color", group = bb_group, display = display.none)
UpperColor = input.color(color.rgb(120, 156, 202,100), "Upper Color", group = bb_group, display = display.none)
LowerColor = input.color(color.rgb(120, 156, 202,100), "Lower Color", group = bb_group, display = display.none)
offset = input.int(0, "Offset", minval = -500, maxval = 500, display = display.data_window, group = bb_group)
ma(source, bb_length, _type) =>
switch _type
"SMA" => ta.sma(source, bb_length)
"EMA" => ta.ema(source, bb_length)
"SMMA (RMA)" => ta.rma(source, bb_length)
"WMA" => ta.wma(source, bb_length)
"VWMA" => ta.vwma(source, bb_length)
basis = ma(bb_src, bb_length, bb_maType)
dev = bb_mult * ta.stdev(bb_src, bb_length)
upper = basis + dev
lower = basis - dev
plot(basis, "Basis", color=BasisColor, offset = offset, force_overlay = true)
p1 = plot(upper, "Upper", color=UpperColor, offset = offset, force_overlay = true)
p2 = plot(lower, "Lower", color=LowerColor, offset = offset, force_overlay = true)
fill(p1, p2, title = "Background", color=color.rgb(163, 41, 245, 90))
rsiLengthInput = input.int(30, minval=1, title="RSI Length", group="RSI Settings")
rsiSourceInput = input.source(close, "Source", group="RSI Settings")
calculateDivergence = input.bool(false, title="Calculate Divergence", group="RSI Settings", display = display.data_window, tooltip = "Calculating divergences is needed in order for divergence alerts to fire.")
SignalDot = input.bool(false, title="Signal Dot", group="Smoothing", display = display.data_window, tooltip = "Signal for possible entry")
change = ta.change(rsiSourceInput)
up = ta.rma(math.max(change, 0), rsiLengthInput)
down = ta.rma(-math.min(change, 0), rsiLengthInput)
rsi = down == 0 ? 100 : up == 0 ? 0 : 100 - (100 / (1 + up / down))
rsiPlot = plot(rsi, "RSI", color= rsi >= 51 ? color.rgb(13, 197, 230) : color.red)
rsiUpperBand = hline(70, "RSI Upper Band", color=#787B86)
midline = hline(50, "RSI Middle Band", color=color.new(#787B86, 50))
rsiLowerBand = hline(30, "RSI Lower Band", color=#787B86)
fill(rsiUpperBand, rsiLowerBand, color=color.rgb(126, 87, 194, 90), title="RSI Background Fill")
midLinePlot = plot(50, color = na, editable = false, display = display.none)
fill(rsiPlot, midLinePlot, 100, 70, top_color = color.new(color.green, 0), bottom_color = color.new(color.green, 100), title = "Overbought Gradient Fill")
fill(rsiPlot, midLinePlot, 30, 0, top_color = color.new(color.red, 100), bottom_color = color.new(color.red, 0), title = "Oversold Gradient Fill")
GRP = "Smoothing"
TT_BB = "Only applies when 'SMA + Bollinger Bands' is selected. Determines the distance between the SMA and the bands."
maTypeInput = input.string("SMA", "Type", options = , group = GRP, display = display.data_window)
maLengthInput = input.int(14, "Length", group = GRP, display = display.data_window)
bbMultInput = input.float(2.0, "BB StdDev", minval = 0.001, maxval = 50, step = 0.5, tooltip = TT_BB, group = GRP, display = display.data_window)
var enableMA = maTypeInput != "None"
var isBB = maTypeInput == "SMA + Bollinger Bands"
smoothma(source, length, MAtype) =>
switch MAtype
"SMA" => ta.sma(source, length)
"SMA + Bollinger Bands" => ta.sma(source, length)
"EMA" => ta.ema(source, length)
"SMMA (RMA)" => ta.rma(source, length)
"WMA" => ta.wma(source, length)
"VWMA" => ta.vwma(source, length)
smoothingMA = enableMA ? smoothma(rsi, maLengthInput, maTypeInput) : na
smoothingStDev = isBB ? ta.stdev(rsi, maLengthInput) * bbMultInput : na
plot(smoothingMA, "RSI-based MA", color=color.yellow, display = enableMA ? display.all : display.none, editable = enableMA)
bbUpperBand = plot(smoothingMA + smoothingStDev, title = "Upper Bollinger Band", color=color.green, display = isBB ? display.all : display.none, editable = isBB)
bbLowerBand = plot(smoothingMA - smoothingStDev, title = "Lower Bollinger Band", color=color.green, display = isBB ? display.all : display.none, editable = isBB)
fill(bbUpperBand, bbLowerBand, color= isBB ? color.new(color.green, 90) : na, title="Bollinger Bands Background Fill", display = isBB ? display.all : display.none, editable = isBB)
lookbackRight = 5
lookbackLeft = 5
rangeUpper = 60
rangeLower = 5
bearColor = color.red
bullColor = color.green
textColor = color.white
noneColor = color.new(color.white, 100)
_calcBarsSince(cond) =>
ta.barssince(cond)
rsiLBR = rsi
// 1. Calculate Pivots Unconditionally
plFound = not na(ta.pivotlow(rsi, lookbackLeft, lookbackRight))
phFound = not na(ta.pivothigh(rsi, lookbackLeft, lookbackRight))
// 2. Calculate History Unconditionally
barsSincePL = _calcBarsSince(plFound )
barsSincePH = _calcBarsSince(phFound )
// 3. Check Ranges Unconditionally
inRangePL = rangeLower <= barsSincePL and barsSincePL <= rangeUpper
inRangePH = rangeLower <= barsSincePH and barsSincePH <= rangeUpper
// 4. Calculate Conditions
var bool bullCond = false
var bool bearCond = false
if calculateDivergence
rsiHL = rsiLBR > ta.valuewhen(plFound, rsiLBR, 1) and inRangePL
lowLBR = low
priceLL = lowLBR < ta.valuewhen(plFound, lowLBR, 1)
bullCond := priceLL and rsiHL and plFound
rsiLH = rsiLBR < ta.valuewhen(phFound, rsiLBR, 1) and inRangePH
highLBR = high
priceHH = highLBR > ta.valuewhen(phFound, highLBR, 1)
bearCond := priceHH and rsiLH and phFound
else
bullCond := false
bearCond := false
plot(plFound ? rsiLBR : na, offset = -lookbackRight, title = "Regular Bullish", linewidth = 2, color = (bullCond ? bullColor : noneColor), display = display.pane, editable = calculateDivergence)
plotshape(bullCond ? rsiLBR : na, offset = -lookbackRight, title = "Regular Bullish Label", text = " Bull ", style = shape.labelup, location = location.absolute, color = bullColor, textcolor = textColor, display = display.pane, editable = calculateDivergence)
plot(phFound ? rsiLBR : na, offset = -lookbackRight, title = "Regular Bearish", linewidth = 2, color = (bearCond ? bearColor : noneColor), display = display.pane, editable = calculateDivergence)
plotshape(bearCond ? rsiLBR : na, offset = -lookbackRight, title = "Regular Bearish Label", text = " Bear ", style = shape.labeldown, location = location.absolute, color = bearColor, textcolor = textColor, display = display.pane, editable = calculateDivergence)
alertcondition(bullCond, title='Regular Bullish Divergence', message="Found a new Regular Bullish Divergence.")
alertcondition(bearCond, title='Regular Bearish Divergence', message='Found a new Regular Bearish Divergence.')
// --- Panel Options (General) ---
g_panel = 'MTF Panel Options'
i_orientation = input.string('Vertical', 'Orientation', options = , group = g_panel)
i_position = input.string('Bottom Right', 'Position', options = , group = g_panel)
i_border_width = input.int(1, 'Border Width', minval = 0, maxval = 10, group = g_panel, inline = 'border')
i_color_border = input.color(#000000, '', group = g_panel, inline = 'border')
i_showHeaders = input.bool(true, 'Show Headers', group = g_panel)
i_color_header_bg = input.color(#5d606b, 'Headers Background', group = g_panel, inline = 'header')
i_color_header_text = input.color(color.white, 'Text', group = g_panel, inline = 'header')
i_color_tf_bg = input.color(#2a2e39, 'Timeframe Background', group = g_panel, inline = 'tf')
i_color_tf_text = input.color(color.white, 'Text', group = g_panel, inline = 'tf')
i_debug = input.bool(false, 'Display colors palette (debug)', group = g_panel)
// --- RSI Colors (Conditional Formatting) ---
g_rsi = 'MTF RSI Colors'
i_threshold_ob = input.int(70, 'Overbought Threshold', minval=51, maxval=100, group = g_rsi)
i_color_ob = input.color(#128416, 'Overbought Background', inline = 'ob', group = g_rsi)
i_tcolor_ob = input.color(color.white, 'Text', inline = 'ob', group = g_rsi)
i_threshold_uptrend = input.int(60, 'Uptrend Threshold', minval=51, maxval=100, group = g_rsi)
i_color_uptrend = input.color(#2d472e, 'Uptrend Background', inline = 'up', group = g_rsi)
i_tcolor_uptrend = input.color(color.white, 'Text', inline = 'up', group = g_rsi)
i_color_mid = input.color(#131722, 'No Trend Background', group = g_rsi, inline = 'mid')
i_tcolor_mid = input.color(#b2b5be, 'Text', group = g_rsi, inline = 'mid')
i_threshold_downtrend = input.int(40, 'Downtrend Threshold', group = g_rsi, minval=0, maxval=49)
i_color_downtrend = input.color(#5b2e2e, 'Downtrend Background', group = g_rsi, inline = 'down')
i_tcolor_downtrend = input.color(color.white, 'Text', group = g_rsi, inline = 'down')
i_threshold_os = input.int(30, 'Oversold Threshold', minval=0, maxval=49, group = g_rsi)
i_color_os = input.color(#db3240, 'Oversold Background', group = g_rsi, inline = 'os')
i_tcolor_os = input.color(color.white, 'Text', group = g_rsi, inline = 'os')
// --- Individual RSI Settings (MTF Sources) ---
g_rsi1 = 'RSI #1'
i_rsi1_enabled = input.bool(true, title = 'Enabled', group = g_rsi1)
i_rsi1_tf = input.timeframe('5', 'Timeframe', group = g_rsi1)
i_rsi1_len = input.int(30, 'Length', minval = 1, group = g_rsi1)
i_rsi1_src = input.source(close, 'Source', group = g_rsi1) * 10000
v_rsi1 = i_rsi1_enabled ? request.security(syminfo.tickerid, i_rsi1_tf, ta.rsi(i_rsi1_src, i_rsi1_len)) : na
g_rsi2 = 'RSI #2'
i_rsi2_enabled = input.bool(true, title = 'Enabled', group = g_rsi2)
i_rsi2_tf = input.timeframe('15', 'Timeframe', group = g_rsi2)
i_rsi2_len = input.int(30, 'Length', minval = 1, group = g_rsi2)
i_rsi2_src = input.source(close, 'Source', group = g_rsi2) * 10000
v_rsi2 = i_rsi2_enabled ? request.security(syminfo.tickerid, i_rsi2_tf, ta.rsi(i_rsi2_src, i_rsi2_len)) : na
g_rsi3 = 'RSI #3'
i_rsi3_enabled = input.bool(true, title = 'Enabled', group = g_rsi3)
i_rsi3_tf = input.timeframe('60', 'Timeframe', group = g_rsi3)
i_rsi3_len = input.int(30, 'Length', minval = 1, group = g_rsi3)
i_rsi3_src = input.source(close, 'Source', group = g_rsi3) * 10000
v_rsi3 = i_rsi3_enabled ? request.security(syminfo.tickerid, i_rsi3_tf, ta.rsi(i_rsi3_src, i_rsi3_len)) : na
g_rsi4 = 'RSI #4'
i_rsi4_enabled = input.bool(true, title = 'Enabled', group = g_rsi4)
i_rsi4_tf = input.timeframe('240', 'Timeframe', group = g_rsi4)
i_rsi4_len = input.int(30, 'Length', minval = 1, group = g_rsi4)
i_rsi4_src = input.source(close, 'Source', group = g_rsi4) * 10000
v_rsi4 = i_rsi4_enabled ? request.security(syminfo.tickerid, i_rsi4_tf, ta.rsi(i_rsi4_src, i_rsi4_len)) : na
g_rsi5 = 'RSI #5'
i_rsi5_enabled = input.bool(true, title = 'Enabled', group = g_rsi5)
i_rsi5_tf = input.timeframe('D', 'Timeframe', group = g_rsi5)
i_rsi5_len = input.int(30, 'Length', minval = 1, group = g_rsi5)
i_rsi5_src = input.source(close, 'Source', group = g_rsi5) * 10000
v_rsi5 = i_rsi5_enabled ? request.security(syminfo.tickerid, i_rsi5_tf, ta.rsi(i_rsi5_src, i_rsi5_len)) : na
g_rsi6 = 'RSI #6'
i_rsi6_enabled = input.bool(true, title = 'Enabled', group = g_rsi6)
i_rsi6_tf = input.timeframe('W', 'Timeframe', group = g_rsi6)
i_rsi6_len = input.int(30, 'Length', minval = 1, group = g_rsi6)
i_rsi6_src = input.source(close, 'Source', group = g_rsi6) * 10000
v_rsi6 = i_rsi6_enabled ? request.security(syminfo.tickerid, i_rsi6_tf, ta.rsi(i_rsi6_src, i_rsi6_len)) : na
g_rsi7 = 'RSI #7'
i_rsi7_enabled = input.bool(false, title = 'Enabled', group = g_rsi7)
i_rsi7_tf = input.timeframe('W', 'Timeframe', group = g_rsi7)
i_rsi7_len = input.int(30, 'Length', minval = 1, group = g_rsi7)
i_rsi7_src = input.source(close, 'Source', group = g_rsi7) * 10000
v_rsi7 = i_rsi7_enabled ? request.security(syminfo.tickerid, i_rsi7_tf, ta.rsi(i_rsi7_src, i_rsi7_len)) : na
g_rsi8 = 'RSI #8'
i_rsi8_enabled = input.bool(false, title = 'Enabled', group = g_rsi8)
i_rsi8_tf = input.timeframe('W', 'Timeframe', group = g_rsi8)
i_rsi8_len = input.int(30, 'Length', minval = 1, group = g_rsi8)
i_rsi8_src = input.source(close, 'Source', group = g_rsi8) * 10000
v_rsi8 = i_rsi8_enabled ? request.security(syminfo.tickerid, i_rsi8_tf, ta.rsi(i_rsi8_src, i_rsi8_len)) : na
g_rsi9 = 'RSI #9'
i_rsi9_enabled = input.bool(false, title = 'Enabled', group = g_rsi9)
i_rsi9_tf = input.timeframe('W', 'Timeframe', group = g_rsi9)
i_rsi9_len = input.int(30, 'Length', minval = 1, group = g_rsi9)
i_rsi9_src = input.source(close, 'Source', group = g_rsi9) * 10000
v_rsi9 = i_rsi9_enabled ? request.security(syminfo.tickerid, i_rsi9_tf, ta.rsi(i_rsi9_src, i_rsi9_len)) : na
g_rsi10 = 'RSI #10'
i_rsi10_enabled = input.bool(false, title = 'Enabled', group = g_rsi10)
i_rsi10_tf = input.timeframe('W', 'Timeframe', group = g_rsi10)
i_rsi10_len = input.int(30, 'Length', minval = 1, group = g_rsi10)
i_rsi10_src = input.source(close, 'Source', group = g_rsi10) * 10000
v_rsi10 = i_rsi10_enabled ? request.security(syminfo.tickerid, i_rsi10_tf, ta.rsi(i_rsi10_src, i_rsi10_len)) : na
// --- Panel Helper Functions ---
// Function 4: String Position to Constant (Indentation cleaned)
f_StrPositionToConst(_p) =>
switch _p
'Top Left' => position.top_left
'Top Right' => position.top_right
'Top Center' => position.top_center
'Middle Left' => position.middle_left
'Middle Right' => position.middle_right
'Middle Center' => position.middle_center
'Bottom Left' => position.bottom_left
'Bottom Right' => position.bottom_right
'Bottom Center' => position.bottom_center
=> position.bottom_right
// Function 5: Timeframe to Human Readable (Indentation cleaned)
f_timeframeToHuman(_tf) =>
seconds = timeframe.in_seconds(_tf)
if seconds < 60
_tf
else if seconds < 3600
str.tostring(seconds / 60) + 'm'
else if seconds < 86400
str.tostring(seconds / 60 / 60) + 'h'
else
switch _tf
"1D" => "D"
"1W" => "W"
"1M" => "M"
=> str.tostring(_tf)
type TPanel
table src = na
bool vertical_orientation = true
int row = 0
int col = 0
// Method 1: Increment Column (Indentation cleaned)
method incCol(TPanel _panel) =>
if _panel.vertical_orientation
_panel.col += 1
else
_panel.row += 1
// Method 2: Increment Row (Indentation cleaned)
method incRow(TPanel _panel) =>
if not _panel.vertical_orientation
_panel.col += 1
_panel.row := 0
else
_panel.row += 1
_panel.col := 0
// Method 3: Add Cell (Indentation cleaned)
method add(TPanel _panel, string _v1, color _bg1, color _ctext1, string _v2, color _bg2, color _ctext2) =>
table.cell(_panel.src, _panel.col, _panel.row, _v1, text_color = _ctext1, bgcolor = _bg1)
_panel.incCol()
table.cell(_panel.src, _panel.col, _panel.row, _v2, text_color = _ctext2, bgcolor = _bg2)
_panel.incRow()
// Function 6: Background Color
f_bg(_rsi) =>
c_line = na(_rsi) ? i_color_mid :
_rsi >= i_threshold_ob ? i_color_ob :
_rsi >= i_threshold_uptrend ? i_color_uptrend :
_rsi <= i_threshold_os ? i_color_os :
_rsi <= i_threshold_downtrend ? i_color_downtrend :
i_color_mid
// Function 7: Text Color
f_rsi_text_color(_rsi) =>
c_line = na(_rsi) ? i_tcolor_mid :
_rsi >= i_threshold_ob ? i_tcolor_ob :
_rsi >= i_threshold_uptrend ? i_tcolor_uptrend :
_rsi <= i_threshold_os ? i_tcolor_os :
_rsi <= i_threshold_downtrend ? i_tcolor_downtrend :
i_tcolor_mid
f_formatRsi(_rsi) => na(_rsi) ? 'N/A' : str.tostring(_rsi, '0.00')
// --- Panel Execution Logic ---
if barstate.islast
v_panel = TPanel.new(vertical_orientation = i_orientation == 'Vertical')
v_max_rows = 20
v_panel.src := table.new(f_StrPositionToConst(i_position), v_max_rows, v_max_rows, border_width = i_border_width, border_color = i_color_border)
if i_showHeaders
v_panel.add('TF', i_color_header_bg, i_color_header_text, 'RSI', i_color_header_bg, i_color_header_text)
if i_rsi1_enabled
v_panel.add(f_timeframeToHuman(i_rsi1_tf), i_color_tf_bg, i_color_tf_text, f_formatRsi(v_rsi1), f_bg(v_rsi1), f_rsi_text_color(v_rsi1))
if i_rsi2_enabled
v_panel.add(f_timeframeToHuman(i_rsi2_tf), i_color_tf_bg, i_color_tf_text, f_formatRsi(v_rsi2), f_bg(v_rsi2), f_rsi_text_color(v_rsi2))
if i_rsi3_enabled
v_panel.add(f_timeframeToHuman(i_rsi3_tf), i_color_tf_bg, i_color_tf_text, f_formatRsi(v_rsi3), f_bg(v_rsi3), f_rsi_text_color(v_rsi3))
if i_rsi4_enabled
v_panel.add(f_timeframeToHuman(i_rsi4_tf), i_color_tf_bg, i_color_tf_text, f_formatRsi(v_rsi4), f_bg(v_rsi4), f_rsi_text_color(v_rsi4))
if i_rsi5_enabled
v_panel.add(f_timeframeToHuman(i_rsi5_tf), i_color_tf_bg, i_color_tf_text, f_formatRsi(v_rsi5), f_bg(v_rsi5), f_rsi_text_color(v_rsi5))
if i_rsi6_enabled
v_panel.add(f_timeframeToHuman(i_rsi6_tf), i_color_tf_bg, i_color_tf_text, f_formatRsi(v_rsi6), f_bg(v_rsi6), f_rsi_text_color(v_rsi6))
if i_rsi7_enabled
v_panel.add(f_timeframeToHuman(i_rsi7_tf), i_color_tf_bg, i_color_tf_text, f_formatRsi(v_rsi7), f_bg(v_rsi7), f_rsi_text_color(v_rsi7))
if i_rsi8_enabled
v_panel.add(f_timeframeToHuman(i_rsi8_tf), i_color_tf_bg, i_color_tf_text, f_formatRsi(v_rsi8), f_bg(v_rsi8), f_rsi_text_color(v_rsi8))
if i_rsi9_enabled
v_panel.add(f_timeframeToHuman(i_rsi9_tf), i_color_tf_bg, i_color_tf_text, f_formatRsi(v_rsi9), f_bg(v_rsi9), f_rsi_text_color(v_rsi9))
if i_rsi10_enabled
v_panel.add(f_timeframeToHuman(i_rsi10_tf), i_color_tf_bg, i_color_tf_text, f_formatRsi(v_rsi10), f_bg(v_rsi10), f_rsi_text_color(v_rsi10))
if i_debug
t = table.new(position.middle_center, 21, 20, border_width = i_border_width, border_color = i_color_border)
v_panel2 = TPanel.new(t, vertical_orientation = i_orientation == 'Vertical')
v_panel2.add('Debug', i_color_header_bg, i_color_header_text, 'Colors', i_color_header_bg, i_color_header_text)
// Using a tuple array for debugging colors demo
// Final Syntax Correction: Use array.new() and array.set() to avoid 'tuple()' function reference error
v_rows = 5 // We know we have 5 elements
demo = array.new(v_rows, '') // Initialize array with 5 string elements, will hold string representation of the tuple
// We will push the elements as a *string* representation of the tuple, as Pine v6 allows
// and then parse them inside the loop if necessary.
// To preserve the structure (string, float) without the tuple() function:
// We must define two separate arrays if the 'tuple' function is truly unavailable.
tf_array = array.new(v_rows)
rsi_array = array.new(v_rows)
// Populate the arrays
array.set(tf_array, 0, 'Overbought')
array.set(rsi_array, 0, float(i_threshold_ob))
array.set(tf_array, 1, 'Uptrend')
array.set(rsi_array, 1, float(i_threshold_uptrend))
array.set(tf_array, 2, 'No Trend')
array.set(rsi_array, 2, 50.0)
array.set(tf_array, 3, 'Downtrend')
array.set(rsi_array, 3, float(i_threshold_downtrend))
array.set(tf_array, 4, 'Oversold')
array.set(rsi_array, 4, float(i_threshold_os))
// Iterate over the arrays using a simple index
for i = 0 to v_rows - 1
tf = array.get(tf_array, i)
rsi = array.get(rsi_array, i)
v_panel2.add(tf, i_color_tf_bg, i_color_tf_text, f_formatRsi(rsi), f_bg(rsi), f_rsi_text_color(rsi))
