zone trading stratThis only works for DOGEUSD , I made it for the 8cap chart so only use it for that.
If you want this for other symbols/charts you need to comment below or msg me.
# Price Zone Trading System: Technical Explanation
## Core Concept
The Price Zone Tracker is built on the concept that price tends to respect certain key levels or "zones" on the chart. These zones act as support and resistance areas where price may bounce or break through. The system combines zone analysis with multiple technical indicators to generate high-probability trading signals.
## Zone Analysis
The system tracks 9 predefined price zones. Each zone has both a high and low boundary, except for Zone 5 which is represented by a single line. When price enters a zone, the system monitors whether it stays within the zone, breaks above it (bullish), or breaks below it (bearish).
This zone behavior establishes the foundational bias of the system:
- When price closes above its previous zone: Zone State = Bullish
- When price closes below its previous zone: Zone State = Bearish
- When price remains within a zone: Zone State = Neutral
## Trend Analysis Components
The system performs multi-timeframe analysis using several technical components:
1. **Higher Timeframe Analysis** (±3 points in scoring)
- Uses 15-minute charts for sub-5-minute timeframes
- Uses 30-minute charts for 5-minute timeframes
- Uses 60-minute charts for timeframes above 5 minutes
- Evaluates candlestick patterns and EMA crossovers on the higher timeframe
2. **EMA Direction** (±1 point in scoring)
- Compares 12-period and 26-period EMAs
- Bullish when fast EMA > slow EMA
- Bearish when fast EMA < slow EMA
3. **MACD Analysis** (±1 point in scoring)
- Uses standard 12/26/9 MACD settings
- Bullish when MACD line crosses above signal line with positive histogram
- Bearish when MACD line crosses below signal line with negative histogram
4. **Price Action** (±2 points in scoring)
- Evaluates whether price is making higher highs/higher lows (uptrend)
- Or lower highs/lower lows (downtrend)
- Also considers ATR-based volatility and strength of movements
## Trend Score Calculation
All these components are weighted and combined into a trend score:
- Higher timeframe components have stronger weights (±2-3 points)
- Current timeframe components have moderate weights (±1 point)
- Price action components have varied weights (±0.5-2 points)
The final trend state is determined by thresholds:
- Score > +3: Trend Analysis State = Bullish
- Score < -3: Trend Analysis State = Bearish
- Score between -3 and +3: Trend Analysis State = Neutral
## Signal Generation Logic
The system combines the Zone State with the Trend Analysis State:
1. If Zone State and Trend Analysis State are both bullish:
- Combined State = Bullish
- Line Color = Green
2. If Zone State and Trend Analysis State are both bearish:
- Combined State = Bearish
- Line Color = Red
3. If Zone State and Trend Analysis State contradict each other:
- Combined State = Neutral
- Line Color = Black
This implements a safety mechanism requiring both zone analysis and technical indicators to agree before generating a directional signal.
## Trading Signals
Trading signals are generated based on changes in the Combined State:
- When Combined State changes from neutral/bearish to bullish:
- Trading Signal = LONG (green triangle appears on chart)
- When Combined State changes from neutral/bullish to bearish:
- Trading Signal = SHORT (red triangle appears on chart)
- When Combined State changes from bullish/bearish to neutral:
- Trading Signal = EXIT (yellow X appears on chart)
- When Combined State remains unchanged:
- Trading Signal = NONE (no new marker appears)
## Reversal Warning
The system also monitors for potential reversal conditions:
- When Combined State is bullish but both RSI and MFI are overbought (>70)
- When Combined State is bearish but both RSI and MFI are oversold (<30)
In these cases, a yellow diamond appears on the chart as a warning that a reversal might be imminent.
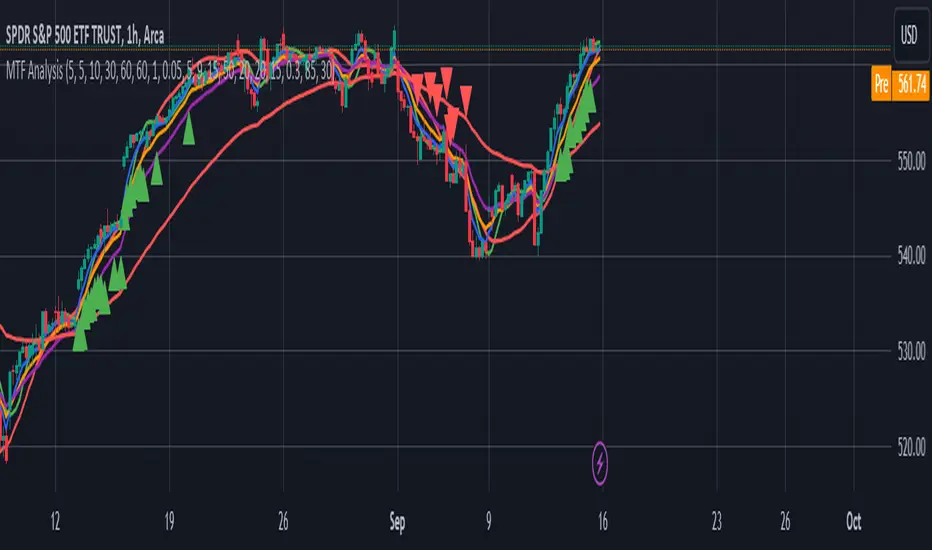
## Visual Elements
The indicator provides multiple visual elements:
1. Zone boundaries as translucent orange areas
2. A single colored line below price (green/red/black) showing the current signal
3. Trading signals as shapes on the chart
4. An information panel showing all relevant indicator values and signals
## Usage Limitations
The indicator is designed to work optimally on timeframes below 30 minutes. On higher timeframes, a warning appears and analysis is disabled.
Indicateur Pine Script®