Delta Volume Candles [LucF]█ OVERVIEW
This indicator plots on-chart volume delta information using candles that can replace your normal candles, tops and bottoms appended to normal candles, optional MAs of those tops and bottoms levels, a divergence channel and a chart background. The indicator calculates volume delta using intrabar analysis, meaning that it uses the lower timeframe bars constituting each chart bar.
█ CONCEPTS
Volume Delta
The volume delta concept divides a bar's volume in "up" and "down" volumes. The delta is calculated by subtracting down volume from up volume. Many calculation techniques exist to isolate up and down volume within a bar. The simplest use the polarity of interbar price changes to assign their volume to up or down slots, e.g., On Balance Volume or the Klinger Oscillator . Others such as Chaikin Money Flow use assumptions based on a bar's OHLC values. The most precise calculation method uses tick data and assigns the volume of each tick to the up or down slot depending on whether the transaction occurs at the bid or ask price. While this technique is ideal, it requires huge amounts of data on historical bars, which considerably limits the historical depth of charts and the number of symbols for which tick data is available. Furthermore, historical tick data is not yet available on TradingView.
This indicator uses intrabar analysis to achieve a compromise between the simplest and most precise methods of calculating volume delta. It is currently the most precise method usable on TradingView charts. TradingView's Volume Profile built-in indicators use it, as do the CVD - Cumulative Volume Delta Candles and CVD - Cumulative Volume Delta (Chart) indicators published from the TradingView account . My Delta Volume Channels and Volume Delta Columns Pro indicators also use intrabar analysis. Other volume delta indicators such as my Realtime 5D Profile use realtime chart updates to calculate volume delta without intrabar analysis, but that type of indicator only works in real time; they cannot calculate on historical bars.
This is the logic I use to determine the polarity of intrabars, which determines the up or down slot where its volume is added:
• If the intrabar's open and close values are different, their relative position is used.
• If the intrabar's open and close values are the same, the difference between the intrabar's close and the previous intrabar's close is used.
• As a last resort, when there is no movement during an intrabar, and it closes at the same price as the previous intrabar, the last known polarity is used.
Once all intrabars making up a chart bar have been analyzed and the up or down property of each intrabar's volume determined, the up volumes are added, and the down volumes subtracted. The resulting value is volume delta for that chart bar, which can be used as an estimate of the buying/selling pressure on an instrument. Not all markets have volume information. Without it, this indicator is useless.
Intrabar analysis
Intrabars are chart bars at a lower timeframe than the chart's. The timeframe used to access intrabars determines the number of intrabars accessible for each chart bar. On a 1H chart, each chart bar of an active market will, for example, usually contain 60 bars at the lower timeframe of 1min, provided there was market activity during each minute of the hour.
This indicator automatically calculates an appropriate lower timeframe using the chart's timeframe and the settings you use in the script's "Intrabars" section of the inputs. As it can access lower timeframes as small as seconds when available, the indicator can be used on charts at relatively small timeframes such as 1min, provided the market is active enough to produce bars at second timeframes.
The quantity of intrabars analyzed in each chart bar determines:
• The precision of calculations (more intrabars yield more precise results).
• The chart coverage of calculations (there is a 100K limit to the quantity of intrabars that can be analyzed on any chart,
so the more intrabars you analyze per chart bar, the less chart bars can be calculated by the indicator).
The information box displayed at the bottom right of the chart shows the lower timeframe used for intrabars, as well as the average number of intrabars detected for chart bars and statistics on chart coverage.
Balances
This indicator calculates five balances from volume delta values. The balances are oscillators with a zero centerline; positive values are bullish, and negative values are bearish. It is important to understand the balances as they can be used to:
• Color candle bodies.
• Calculate body and top and bottom divergences.
• Color an EMA channel.
• Color the chart's background.
• Configure markers and alerts.
The five balances are:
1 — Bar Balance : This is the only balance using instant values; it is simply the subtraction of the down volume from the up volume on the bar, so the instant volume delta for that bar.
2 — Average Balance : Calculates a distinct EMA for both the up and down volumes, and subtracts the down EMA from the up EMA.
The result is akin to MACD's histogram because it is the subtraction of two moving averages.
3 — Momentum Balance : Starts by calculating, separately for both up and down volumes, the difference between the same EMAs used in "Average Balance" and
an SMA of twice the period used for the "Average Balance" EMAs. The difference for the up side is subtracted from the difference for the down side,
and an RSI of that value is calculated and brought over the −50/+50 scale.
4 — Relative Balance : The reference values used in the calculation are the up and down EMAs used in the "Average Balance".
From those, we calculate two intermediate values using how much the instant up and down volumes on the bar exceed their respective EMA — but with a twist.
If the bar's up volume does not exceed the EMA of up volume, a zero value is used. The same goes for the down volume with the EMA of down volume.
Once we have our two intermediate values for the up and down volumes exceeding their respective MA, we subtract them. The final value is an ALMA of that subtraction.
The rationale behind using zero values when the bar's up/down volume does not exceed its EMA is to only take into account the more significant volume.
If both instant volume values exceed their MA, then the difference between the two is the signal's value.
The signal is called "relative" because the intermediate values are the difference between the instant up/down volumes and their respective MA.
This balance flatlines when the bar's up/down volumes do not exceed their EMAs, which makes it useful to spot areas where trader interest dwindles, such as consolidations.
The smaller the period of the final value's ALMA, the more easily it will flatline. These flat zones should be considered no-trade zones.
5 — Percent Balance : This balance is the ALMA of the ratio of the "Bar Balance" over the total volume for that bar.
From the balances and marker conditions, two more values are calculated:
1 — Marker Bias : This sums the up/down (+1/‒1) occurrences of the markers 1 to 4 over a period you define, so it ranges from −4 to +4, times the period.
Its calculation will depend on the modes used to calculate markers 3 and 4.
2 — Combined Balances : This is the sum of the bull/bear (+1/−1) states of each of the five balances, so it ranges from −5 to +5.
The periods for all of these balances can be configured in the "Periods" section at the bottom of the script's inputs. As you cannot see the balances on the chart, you can use my Volume Delta Columns Pro indicator in a pane; it can plot the same balances, so you will be able to analyze them.
Divergences
In the context of this indicator, a divergence is any bar where the bear/bull state of a balance (above/below its zero centerline) diverges from the polarity of a chart bar. No directional bias is assigned to divergences when they occur. Candle bodies and tops/bottoms can each be colored differently on divergences detected from distinct balances.
Divergence Channel
The divergence channel is the space between two levels (by default, the bar's open and close ) saved when divergences occur. When price (by default the close ) has breached a channel and a new divergence occurs, a new channel is created. Until that new channel is breached, bars where additional divergences occur will expand the channel's levels if the bar's price points are outside the channel.
Prices breaches of the divergence channel will change its state. Divergence channels can be in one of three different states:
• Bull (green): Price has breached the channel to the upside.
• Bear (red): Price has breached the channel to the downside.
• Neutral (gray): The channel has not yet been breached.
█ HOW TO USE THE INDICATOR
I do not make videos to explain how to use my indicators. I do, however, try hard to include in their description everything one needs to understand what they do. From there, it's up to you to explore and figure out if they can be useful in your trading practice. Communicating in videos what this description and the script's tooltips contain would make for very long videos that would likely exceed the attention span of most people who find this description too long. There is no quick way to understand an indicator such as this one because it uses many different concepts and has quite a bit of settings one can use to modify its visuals and behavior — thus how one uses it. I will happily answer questions on the inner workings of the indicator, but I do not answer questions like "How do I trade using this indicator?" A useful answer to that question would require an in-depth analysis of who you are, your trading methodology and objectives, which I do not have time for. I do not teach trading.
Start by loading the indicator on an active chart containing volume information. See here if you need help.
The default configuration displays:
• Normal candles where the bodies are only colored if the bar's volume has increased since the last bar.
If you want to use this indicator's candles, you may want to disable your chart's candles by clicking the eye icon to the right of the symbol's name in the top left of the chart.
• A top or bottom appended to the normal candles. It represents the difference between up and down volume for that bar
and is positioned at the top or bottom, depending on its polarity. If up volume is greater than down volume, a top is displayed. If down volume is greater, a bottom is plotted.
The size of tops and bottoms is determined by calculating a factor which is the proportion of volume delta over the bar's total volume.
That factor is then used to calculate the top or bottom size relative to a baseline of the average candle body size of the last 100 bars.
• An information box in the bottom right displaying intrabar and chart coverage information.
• A light red background when the intrabar volume differs from the chart's volume by more than 1%.
The script's inputs contain tooltips explaining most of the fields. I will not repeat them here. Following is a brief description of each section of the indicator's inputs which will give you an idea of what the indicator can do:
Normal Candles is where you configure the replacement candles plotted by the script. You can choose from different coloring schemes for their bodies and specify a unique color for bodies where a divergence calculated using the method you choose occurs.
Volume Tops & Botttoms is where you configure the display of tops and bottoms, and their EMAs. The EMAs are calculated from the high point of tops and the low point of bottoms. They can act as a channel to evaluate price, and you can choose to color the channel using a gradient reflecting the advances/declines in the balance of your choice.
Divergence Channel is where you set up the appearance and behavior of the divergence channel. These areas represent levels where price and volume delta information do not converge. They can be interpreted as regions with no clear direction from where one will look for breaches. You can configure the channel to take into account one or both types of divergences you have configured for candle bodies and tops/bottoms.
Background allows you to configure a gradient background color that reflects the advances/declines in the balance of your choice. You can use this to provide context to the volume delta values from bars. You can also control the background color displayed on volume discrepancies between the intrabar and the chart's timeframe.
Intrabars is where you choose the calculation mode determining the lower timeframe used to access intrabars. The indicator uses the chart's timeframe and the type of market you are on to calculate the lower timeframe. Your setting there should reflect which compromise you prefer between the precision of calculations and chart coverage. This is also where you control the display of the information box in the lower right corner of the chart.
Markers allows you to control the plotting of chart markers on different conditions. Their configuration determines when alerts generated from the indicator will fire. Note that in order to generate alerts from this script, they must be created from your chart. See this Help Center page to learn how. Only the last 500 markers will be visible on the chart, but this will not affect the generation of alerts.
Periods is where you configure the periods for the balances and the EMAs used in the indicator.
The raw values calculated by this script can be inspected using the Data Window.
█ INTERPRETATION
Rightly or wrongly, volume delta is considered by many a useful complement to the interpretation of price action. I use it extensively in an attempt to find convergence between my read of volume delta and price movement — not so much as a predictor of future price movement. No system or person can predict the future. Accordingly, I consider people who speak or act as if they know the future with certainty to be dangerous to themselves and others; they are charlatans, imprudent or blissfully ignorant.
I try to avoid elaborate volume delta interpretation schemes involving too many variables and prefer to keep things simple:
• Trends that have more chances of continuing should be accompanied by VD of the same polarity.
In trends, I am looking for "slow and steady". I work from the assumption that traders and systems often overreact, which translates into unproductive volatility.
Wild trends are more susceptible to overreactions.
• I prefer steady VD values over wildly increasing ones, as large VD increases often come with increased price volatility, which can backfire.
Large VD values caused by stopping volume will also often occur on trend reversals with abnormally high candles.
• Prices escaping divergence channels may be leading a trend in that direction, although there is no telling how long that trend will last; could be just a few bars or hundreds.
When price is in a channel, shifts in VD balances can sometimes give us an idea of the direction where price has the most chance of breaking.
• Dwindling VD will often indicate trend exhaustion and predate reversals by many bars, but the problem is that mere pauses in a trend will often produce the same behavior in VD.
I think it is too perilous to infer rigidly from VD decreases.
Divergence Channel
Here I have configured the divergence channels to be visible. First, I set the bodies to display divergences on the default Bar Balance. They are indicated by yellow bodies. Then I activated the divergence channels by choosing to draw levels on body divergences and checked the "Fill" checkbox to fill the channel with the same color as the levels. The divergence channel is best understood as a direction-less area from where a breach can be acted on if other variables converge with the breach's direction:
Tops and Bottoms EMAs
I find these EMAs rather interesting. They have no equivalent elsewhere, as they are calculated from the top and bottom values this indicator plots. The only similarity they have with volume-weighted MAs, including VWAP, is that they use price and volume. This indicator's Tops and Bottoms EMAs, however, use the price and volume delta. While the channel differs from other channels in how it is calculated, it can be used like others, as a baseline from which to evaluate price movement or, alternatively, as stop levels. Remember that you can change the period used for the EMAs in the "Periods" section of the inputs.
This chart shows the EMAs in action, filled with a gradient representing the advances/decline from the Momentum balance. Notice the anomaly in the chart's latest bars where the Momentum balance gradient has been indicating a bullish bias for some time, during which price was mostly below the EMAs. Price has just broken above the channel on positive VD. My interpretation of this situation would be that it is a risky opportunity for a long trade in the larger context where the market has been in a downtrend since the 5th. Intrepid traders choosing to enter here could do so with a "make or break" tight stop that will minimize their losses should the market continue its downtrend while hopefully preserving the potential upside of price continuing on the longer-term uptrend prevalent since the 28th:
█ NOTES
Volume
If you use indicators such as this one which depends on volume information, it is important to realize that the volume data they consume comes from data feeds, and that all data feeds are NOT created equally. Those who create the data feeds we use must make decisions concerning the nature of the transactions they tally and the way they are tallied in each feed, and these decisions affect the nature of our volume data. My Volume X-ray publication discusses some of the reasons why volume information from different timeframes, brokers/exchanges or sectors may vary considerably. I encourage you to read it. This indicator's display of a warning through a background color on volume discrepancies between the timeframe used to access intrabars and the chart's timeframe is an attempt to help you realize these variations in feeds. Don't take things for granted, and understand that the quality of a given feed's volume information affects the quality of the results this indicator calculates.
Markets as ecosystems
I believe it is perilous to think that behavioral patterns you discover in one market through the lens of this or any other indicator will necessarily port to other markets. While this may sometimes be the case, it will often not. Why is that? Because each market is its own ecosystem. As cities do, all markets share some common characteristics, but they also all have their idiosyncrasies. A proportion of a city's inhabitants is always composed of outsiders who come and go, but a core population of regulars and systems is usually the force that actually defines most of the city's observable characteristics. I believe markets work somewhat the same way; they may look the same, but if you live there for a while and pay attention, you will notice the idiosyncrasies. Some things that work in some markets will, accordingly, not work in others. Please keep that in mind when you draw conclusions.
On Up/Down or Buy/Sell Volume
Buying or selling volume are misnomers, as every unit of volume transacted is both bought and sold by two different traders. While this does not keep me from using the terms, there is no such thing as “buy only” or “sell only” volume. Trader lingo is riddled with peculiarities. Without access to order book information, traders work with the assumption that when price moves up during a bar, there was more buying pressure than selling pressure, just as when buy market orders take out limit ask orders in the order book at successively higher levels. The built-in volume indicator available on TradingView uses this logic to color the volume columns green or red. While this script’s calculations are more precise because it analyses intrabars to calculate its information, it uses pretty much the same imperfect logic. Until Pine scripts can have access to how much volume was transacted at the bid/ask prices, our volume delta calculations will remain a mere proxy.
Repainting
• The values calculated on the realtime bar will update as new information comes from the feed.
• Historical values may recalculate if the historical feed is updated or when calculations start from a new point in history.
• Markers and alerts will not repaint as they only occur on a bar's close. Keep this in mind when viewing markers on historical bars,
where one could understandably and incorrectly assume they appear at the bar's open.
To learn more about repainting, see the Pine Script™ User Manual's page on the subject .
Superfluity
In "The Bed of Procrustes", Nassim Nicholas Taleb writes: To bankrupt a fool, give him information . This indicator can display a lot of information. The inevitable adaptation period you will need to figure out how to use it should help you eliminate all the visuals you do not need. The more you eliminate, the easier it will be to focus on those that are the most useful to your trading practice. Don't be a fool.
█ THANKS
Thanks to alexgrover for his Dekidaka-Ashi indicator. His volume plots on candles were the inspiration for my top/bottom plots.
Kudos to PineCoders for their libraries. I use two of them in this script: Time and lower_tf .
The first versions of this script used functionality that I would not have known about were it not for these two guys:
— A guy called Kuan who commented on a Backtest Rookies presentation of their Volume Profile indicator.
— theheirophant , my partner in the exploration of the sometimes weird abysses of request.security() ’s behavior at lower timeframes.
Recherche dans les scripts pour "bias"

Price Streak Is Another Way to Spot TrendsPrice is never wrong, but sometimes reading it can be tricky.
Movements in the broader market or a sector can distract from a symbol that's been steadily trending in one direction or another. Sometimes the beginning of a move can also be so subtle that it flies under most people's radar.
Price Streak can help overcome these limitations by tracking consecutive up/down periods. It plots an easy-to-read color-coded histogram.
Because it simply counts the candles in a trend, Price Streak can give a clearer picture than magnitude-biased indicators like relative strength or MACD.
Applying Price Streak to the daily chart of Bitcoin Dominance , we find something very interesting right now: the longest drop since March 2017.
That moment in history, almost three years ago, marked the beginning of the last Altcoin bull market. Ethereum , for example, went from roughly $60 to over $1,300 in the following nine months.
While past performance isn't a guarantee of future results, this illustrates how sustained price moves can reveal changes in character.
Based on Price Streak's current reading, it may support the idea of another Altcoin cycle beginning now.

Scripting Tutorial B - TManyMA - Commission/FeesThis script is for a triple moving average strategy where the user can select from different types of moving averages, price sources, lookback periods and resolutions.
Features:
- 3 Moving Averages with variable MA types, periods, price sources, resolutions and the ability to disable each individually.
- Crossovers are plotted on the chart with detailed information regarding the crossover (Ex: 50 SMA crossed over 200 SMA )
- Forecasting available for all three MAs. MA values are forecasted 5 values out and plotted as if a continuation to the MA.
- Forecast bias also applies to all forecasting. Bias means we can forecast based on an anticipated bullish , bearish or neutral direction in the market.
- To understand bias, please read the source code, or if you can't read the code just send me a message on here or Twitter . Twitter should be linked to my profile.
- Ribbons added and on by default. Optional setting to disable the ribbons. 5 ribbons between MA1 and MA2 and another 5 between MA2 and MA3.
- Ribbons are alpha-color coded based on their relation to their default MAs.
- Ribbons are only visible between MAs if the MAs being compared share the same Type, Resolution, and Source because there is no way to consolidate those three in a simple manner.
- Ribbon values are calculated based on calculated MA Periods between the MAs.
- Converted the existing study into a strategy.
- Strategy only enters long positions with a market order when MA crossovers occur.
- Strategy exits positions when crossunders occur.
- Trades 100% of the equity with one order/position by default.
- Ability to disable trading certain crosses with input checks.
- Ability to exit trades with a take profit or stop loss.
- User input to allow quick changes to the take profit or stop loss percentages.
- Strategy now calculates on every tick
- Strategy also includes fixed commission values based on Coinbase standard order fees
This script is meant as an educational script with well-formatted styling, and references for specific functions.
*** PLEASE NOTE - THIS STRATEGY IS MEANT FOR LEARNING PURPOSES. DEPENDING ON IT'S CONFIGURATION IT MAY OR MAY NOT BE USEFUL FOR ACTUAL TRADING. THE STRATEGY IS NOT FINANCIAL ADVICE ***

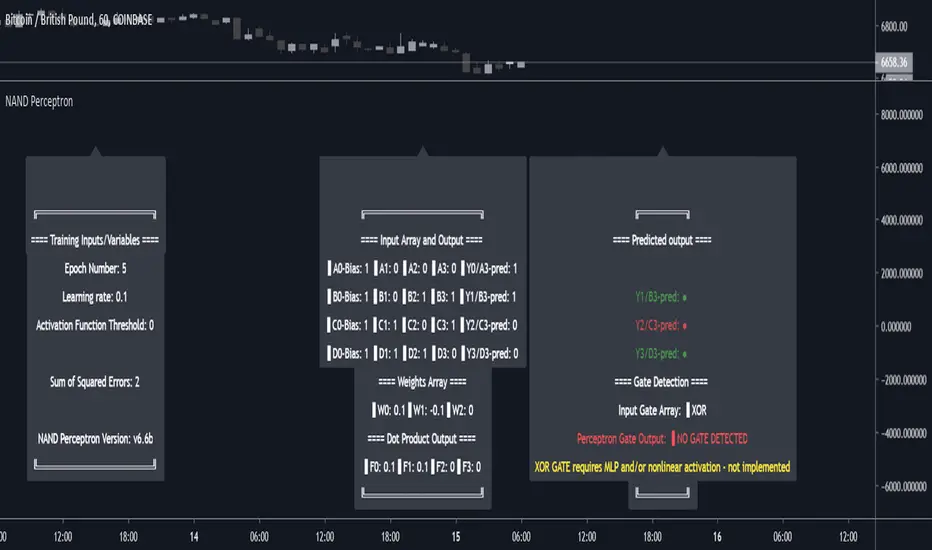
NAND PerceptronExperimental NAND Perceptron based upon Python template that aims to predict NAND Gate Outputs. A Perceptron is one of the foundational building blocks of nearly all advanced Neural Network layers and models for Algo trading and Machine Learning.
The goal behind this script was threefold:
To prove and demonstrate that an ACTUAL working neural net can be implemented in Pine, even if incomplete.
To pave the way for other traders and coders to iterate on this script and push the boundaries of Tradingview strategies and indicators.
To see if a self-contained neural network component for parameter optimization within Pinescript was hypothetically possible.
NOTE: This is a highly experimental proof of concept - this is NOT a ready-made template to include or integrate into existing strategies and indicators, yet (emphasis YET - neural networks have a lot of potential utility and potential when utilized and implemented properly).
Hardcoded NAND Gate outputs with Bias column (X0):
// NAND Gate + X0 Bias and Y-true
// X0 // X1 // X2 // Y
// 1 // 0 // 0 // 1
// 1 // 0 // 1 // 1
// 1 // 1 // 0 // 1
// 1 // 1 // 1 // 0
Column X0 is bias feature/input
Column X1 and X2 are the NAND Gate
Column Y is the y-true values for the NAND gate
yhat is the prediction at that timestep
F0,F1,F2,F3 are the Dot products of the Weights (W0,W1,W2) and the input features (X0,X1,X2)
Learning rate and activation function threshold are enabled by default as input parameters
Uncomment sections for more training iterations/epochs:
Loop optimizations would be amazing to have for a selectable length for training iterations/epochs but I'm not sure if it's possible in Pine with how this script is structured.
Error metrics and loss have not been implemented due to difficulty with script length and iterations vs epochs - I haven't been able to configure the input parameters to successfully predict the right values for all four y-true values for the NAND gate (only been able to get 3/4; If you're able to get all four predictions to be correct, let me know, please).
// //---- REFERENCE for final output
// A3 := 1, y0 true
// B3 := 1, y1 true
// C3 := 1, y2 true
// D3 := 0, y3 true
PLEASE READ: Source article/template and main code reference:
towardsdatascience.com
towardsdatascience.com
towardsdatascience.com
Scripting Tutorial A - TManyMA - StopsThis script is for a triple moving average strategy where the user can select from different types of moving averages, price sources, lookback periods and resolutions.
Features:
- 3 Moving Averages with variable MA types, periods, price sources, resolutions and the ability to disable each individually.
- Crossovers are plotted on the chart with detailed information regarding the crossover (Ex: 50 SMA crossed over 200 SMA )
- Forecasting available for all three MAs. MA values are forecasted 5 values out and plotted as if a continuation to the MA.
- Forecast bias also applies to all forecasting. Bias means we can forecast based on an anticipated bullish, bearish or neutral direction in the market.
- To understand bias, please read the source code, or if you can't read the code just send me a message on here or Twitter. Twitter should be linked to my profile.
- Ribbons added and on by default. Optional setting to disable the ribbons. 5 ribbons between MA1 and MA2 and another 5 between MA2 and MA3.
- Ribbons are alpha-color coded based on their relation to their default MAs.
- Ribbons are only visible between MAs if the MAs being compared share the same Type, Resolution, and Source because there is no way to consolidate those three in a simple manner.
- Ribbon values are calculated based on calculated MA Periods between the MAs.
- Converted the existing study into a strategy.
- Strategy only enters long positions with a market order when MA crossovers occur.
- Strategy exits positions when crossunders occur.
- Trades 100% of the equity with one order/position by default.
- Ability to disable trading certain crosses with input checks.
- Ability to exit trades with a take profit or stop loss.
- User input to allow quick changes to the take profit or stop loss percentages.
This script is meant as an educational script with well-formatted styling, and references for specific functions.
*** PLEASE NOTE - THIS STRATEGY IS MEANT FOR LEARNING PURPOSES. DEPENDING ON IT'S CONFIGURATION IT MAY OR MAY NOT BE USEFUL FOR ACTUAL TRADING. THE STRATEGY IS NOT FINANCIAL ADVICE ***

Extended Recursive Bands - Maximum Efficiency With Extra OptionsIntroducing A New Calculation For Efficient Bands Calculation !
Here it is ! The Recursive Bands Indicator, an indicator specially created to be extremely efficient, i think you already know that calculation time is extra important in algorithmic trading, and this is the principal motivation for the creation of the proposed indicator. Originally described in my paper "Pierrefeu, Alex (2019): Recursive Bands - A New Indicator For Technical Analysis" , the indicator framework has been widely used in my previous uploaded indicators, however it would have been a shame to not upload it, however user experience being a major concern for me, i decided to add extra options, which explain the term "extended".
On The Indicator Calculation
You can skip this part if it doesn't interest you. The calculation of the indicator is based on recursion, but i want to explain the mathematical formula described in the paper.
I've seen some users trying to remake it from the calculations, however there was always something weird, and i understand, mathematical notations are always a bit weird, even myself don't always write them correctly/understand them, however this one is relatively simple to understand.
First lets explain each elements of the calculation :
α = smoothing constant, or 2/(length+1)
max/min = maximum and minimum function, max return the greatest input value while min return the lowest one, for example :
max(4,2) = 4 while min(4,2) = 2
the "||" notation mean taking the absolute value, for example : |-1| = abs(-1) = 1
The calculation after the max/min function is called the correction factor, and is the core of the indicator. The last two variables are just here to provide an initial value for upper and lower, basically when we start our calculations we will assign the value of the closing price for upper and lower.
The motivation behind using a smoothing constant in range of (0,1) was to tell the reader that the indicator is easily made adaptive, this is what i did on my adaptive trailing stop indicator by using the efficiency ratio as smoothing variable, the user can use 1/length instead of the provided calculation for alpha.
If you interested on the indicator main logic, it is actually really simple, by using upper = max(price,upper) and lower = min(price,lower) we would get the maximum/minimum price value at time t , therefore upper can only be greater or equal than its precedent value, while lower can only be lower or equal than its precedent value, in order to fix that we subtract/sum upper/lower with a value, this allow the upper band to be lower than its precedent value and lower to be greater than its precedent value, this is the role of the correction factor.
The Indicator
The indicator display one upper and one lower band, every common usages applied to bands indicators such as support/resistance, breakout, trailing stop...etc, can also be applied to this one. length control how reactive the bands are, higher values of length will make the bands cross the price less often.
In order to provide more flexibility for the user i added the option to use various methods for the calculation of the indicator, therefore the indicator can use the average true range, standard deviation, average high-low range, and one totally exclusive method specially designed for this indicator.
Classic Method
This option make the indicator use its classical calculation, this is the most efficient method of all.
Atr Method (atr)
This method use the average true range as correction factor, notice that lower values of length can still produce wide band.
Standard Deviation Method (stdev)
This method use a biased estimate of the standard deviation as correction factor.
The method produce smoother bands that converge more slowly toward the price in comparison with the classic correction factor.
Average High-Low Range Method (ahlr)
This method use the average of the high-low range as correction factor, extremely similar to the average true range.
Rising Falling Volatility (rfv) Method
A new method created for this indicator, this correction factor use the absolute prices changes when price value is greater/lower than any length past values of the price, this allow to have more boxy shaped bands, work best with greater values of length.
The bands can be in contact with this method, a possible fix in the future.
Conclusion
The recursive band indicator is one of my greatest indicators in my opinion (i would love to have yours), as you can see the idea behind it is extremely simple and allow for a super efficient band indicator, which was the original motivation behind it, in order to provide more fun for the users i also added more option for the correction factor, this allow the user to be creative and not get stuck with the original calculation.
Like the trend step indicator family we have almost ended our series on the recursive band framework, 1 more trailing stop will be added in the future, and then we'll have more "boring" stuff until i find something cool again, it shouldn't be long ;)
Thanks for reading !

Scripting Tutorial 9 - TManyMA Strategy - Long Market Order OnlyThis script is for a triple moving average strategy where the user can select from different types of moving averages, price sources, lookback periods and resolutions.
Features:
- 3 Moving Averages with variable MA types, periods, price sources, resolutions and the ability to disable each individually
- Crossovers are plotted on the chart with detailed information regarding the crossover (Ex: 50 SMA crossed over 200 SMA )
- Forecasting available for all three MAs. MA values are forecasted 5 values out and plotted as if a continuation to the MA.
- Forecast bias also applies to all forecasting. Bias means we can forecast based on an anticipated bullish, bearish or neutral direction in the market.
- To understand bias, please read the source code, or if you can't read the code just send me a message on here or Twitter. Twitter should be linked to my profile.
- Ribbons added and on by default. Optional setting to disable the ribbons. 5 ribbons between MA1 and MA2 and another 5 between MA2 and MA3.
- Ribbons are alpha-color coded based on their relation to their default MAs.
- Ribbons are only visible between MAs if the MAs being compared share the same Type, Resolution, and Source because there is no way to consolidate those three in a simple manner.
- Ribbon values are calculated based on calculated MA Periods between the MAs.
- Converted the existing study into a strategy
- Strategy only enters long positions with a market order when MA crossovers occur
- Strategy exits positions when crossunders occur
- Trades 100% of the equity with one order/position by default
- Ability to disable trading certain crosses with input checks
This script is meant as an educational script with well-formatted styling, and references for specific functions.
*** PLEASE NOTE - THIS STRATEGY IS MEANT FOR LEARNING PURPOSES. DEPENDING ON IT'S CONFIGURATION IT MAY OR MAY NOT BE USEFUL FOR ACTUAL TRADING. THE STRATEGY IS NOT FINANCIAL ADVICE ***

Scripting Tutorial 8 - Triple Many Moving Averages RibbonsThis script is for a triple moving average indicator where the user can select from different types of moving averages, price sources, lookback periods and resolutions.
Features:
- 3 Moving Averages with variable MA types, periods, price sources, resolutions and the ability to disable each individually
- Crossovers are plotted on the chart with detailed information regarding the crossover (Ex: 50 SMA crossed over 200 SMA )
- Forecasting available for all three MAs. MA values are forecasted 5 values out and plotted as if a continuation to the MA.
- Forecast bias also applies to all forecasting. Bias means we can forecast based on an anticipated bullish, bearish or neutral direction in the market.
- To understand bias, please read the source code, or if you can't read the code just send me a message on here or Twitter. Twitter should be linked to my profile.
- Ribbons added and on by default. Optional setting to disable the ribbons. 5 ribbons between MA1 and MA2 and another 5 between MA2 and MA3.
- Ribbons are alpha-color coded based on their relation to their default MAs.
- Ribbons are only visible between MAs if the MAs being compared share the same Type, Resolution, and Source because there is no way to consolidate those three in a simple manner.
- Ribbon values are calculated based on calculated MA Periods between the MAs.
This script is meant as an educational script with well-formatted styling, and references for specific functions.

Kaufman Adaptive BandsIntroduction
Bands are quite efficient in technical analysis, they can provide support and resistance levels, provide breakouts points, trailing stop loss/take profits positions and can show the current market volatility to the user. Most of the time bands are made from a central tendency estimator like a moving average plus/minus a volatility indicator. Therefore bands can be made out of pretty much everything thus allowing for any kind of flavors.
So i propose a band indicator made from a Kaufman adaptive moving average using an estimate of the standard deviation.
Construction
The Kaufman moving average is an exponential averager using the efficiency ratio as smoothing variable, length control the period of kama and in order to provide more smoothness a power parameter has been introduced, higher values of power will return smoother results.
The volatility indicator is made from a biased estimation of the standard deviation by using the square root of the mean of the square minus the square of the mean method, except that we use kama instead of a mean.
The bands are made by adding/subtracting this volatility indicator with kama.
How To Use
The ability of the indicator to adapt to the current market state is what makes him a great tool for avoiding major exposition during ranging market, therefore the indicator will have a greater motion during trending market, or more simply the bands will move during trending markets while staying "flat" during ranging ones. Therefore the indicator might be more suited to breakouts, even if some cases will return what where turning points, this is particularly true during ranging markets.
Of course the efficiency ratio is not an "unbiased" trend metric indicator, it can consider high volatility markets as trending markets. Its one of his downsides.
High values of power will create smoother bands.
When using a low power parameter use an higher mult. In general using a low power value will make the bands move more freely as well as making them closer to each others.
Conclusion
At least the indicator is really nice to the eyes when using high power values, its ability to adapt to the market is a great addition to other more classical bands indicators, i also introduced a volatility estimator based on kama, some might have used the following estimation : kama(abs(price - kama)) which would have created a slower result. A trailing stop might be made from it if i see request about such addition.
If you are curious here are some more images of the indicator performing on different markets. Thanks for reading !

5 MAs w. alerts [LucF]Is this gazillionth MA indicator worth an addition to the already crowded field of contenders? I say yes! This one shows up to 5 MAs and 6 different marker conditions that can be used to create alerts, among many other goodies.
Features
MAs can be darkened when they are falling.
MAs from another time frame can be displayed, with the option of smoothing them.
Markers can be filtered to Longs or Shorts only.
EMAs can be selected for either all or the two shortest MAs.
The background can be colored using any of the marker states except no. 3.
Markers are:
1. On crosses between any two user-defined MAs,
2. When price is above or below an MA,
3. On Quick Flips (a specific setup involving a cross, multiple MA states and increasing volume, when available),
4. When the difference between two MAs is within a % of its high/low historic values,
5. When an MA has been rising/falling for n bars,
6. When the difference between two MAs is greater than a multiple of ATR.
Some markers use similar visual cues, so distinguishing them will be a challenge if they are used concurrently.
Alerts
Alerts can be created on any combination of alerts. Only non-consecutive instances of markers 5 and 6 will trigger the alert condition. Make sure you are on the interval you want the alert to run at. Using the “Once Per Bar Close” trigger condition is usually the best option.
When an alert is created in TradingView, a snapshot of the indicator’s settings is saved with the alert, which then takes on a life of its own. That is why even though there is only one alert to choose from when you bring up the alert creation dialog box and choose “5 MAs”, that alert can be triggered from any number of conditions. You select those conditions by activating the markers you want the alert to trigger on before creating the alert. If you have selected multiple conditions, then it can be a good idea to record a reminder in the alert’s message field. When the alert triggers, you will need the indicator on the chart to figure out which one of your conditions triggered the alert, as there is currently no way to dynamically change the alert’s message field from within the script.
Background settings will not trigger alerts; only marker configurations.
Notes
MAs are just… averages. Trader lure would have them act as support and resistance levels. I’m not sure about that, and not the only one thinking along these lines. Adam Grimes has studied moving averages in quite a bit of detail. His numbers point to no evidence indicating they act as support/resistance, and to specific MA lengths not being more meaningful than others. His point of view is debated by some—not by me. Mean reversion does not entail that price stops when it reaches its MA; rather, it makes sense to me that price would often more or less oscillate around its MA, which entails the MA does not act as support/resistance. Aren’t the best mean reversion opportunities when price is furthest away from its MA? If so, it should be more profitable to identify these areas, which some of this indicator’s markers try to do.
I think MAs can be much more powerful when thought of as instruments we can use to situate price events in contexts of various resolutions, from the instantaneous to the big picture. Accordingly, I use the relative positions and slopes of MAs in both discretionary and automated trading; but never their purported ability to support/resist.
Regardless of how you use MAs, I hope you will find this indicator useful.
Biased References
The Art and Science of Technical Analysis: Market Structure, Price Action, and Trading Strategies, Adam Grimes, 2012.
Does the 200 day moving average “work”?
Moving averages: digging deeper

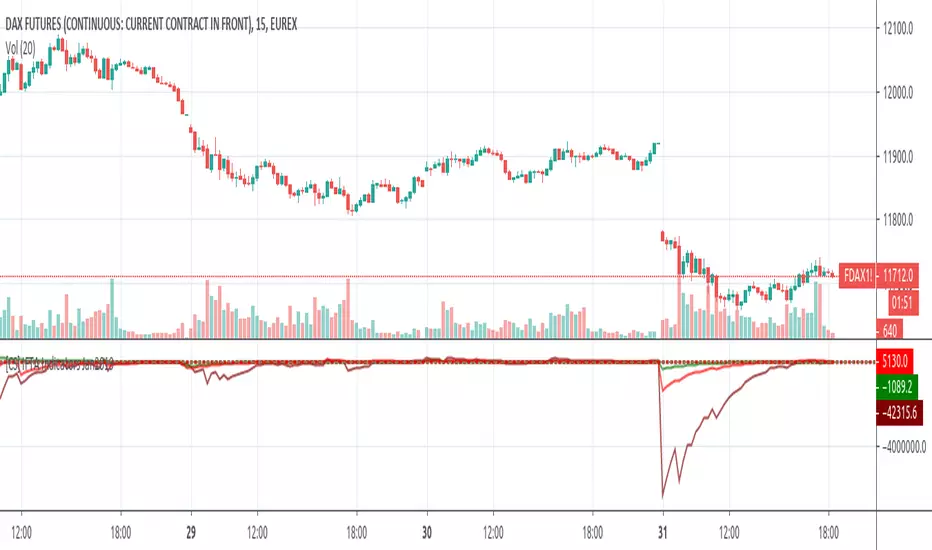
Linear Momentum and Performance IndicatorsThis a porting to Trading View of the 12 new indicators introduced in IFTA Journal (January Edition) by Akram El Sherbini, MFTA, CFTe, CETA.
Indicators are available in "Linear Momentum and Performance Indicators" at page four.
IFTA Journal is available below:
ifta.org
Indicators implemented herein:
Linear Force Index: The linear force index LFI measures the force of buyers and sellers during rallies and declines, respectively. It combines two important pieces of market information—the price acceleration
and volumes.
Pressure Index: The pressure index PRI measures the buying and selling pressure over a certain range within a time interval by moving around its zero line. The index indicates a rise in buying pressure when it crosses above the zero line and a rise in selling pressure
when it crosses below the zero line level. The buying and selling force moves the last price during the session to form a range with low and high boundaries.
Strength Index Index: The strength index SI is a leading indicator to the pressure index. It measures the ability of buyers to resist sellers and vice versa. SI of today is the ratio of the latest pressure index value to the strain of today.
Power Index: It measures the buying and selling power within a time interval by moving around its zero line.
Intensity Index: The intensity index II measures the buying and selling intensity within a time interval by moving around its zero line.
Dynamic Strength Index: The sole purpose of the dynamic strength index DSI and the integral dynamic strength index IDSI is to lead their intensity indicator peers.
Integral Force Index
Integral Pressure Index
Integral Strength Index
Integral Power Index
Integral Intensity Index
Integral Dynamic Strength Index
The following example shows a trade following the signal while several indicators are crossing the zero line:
Integral performance indicators have a fewer number of trades than the performance indicators. This result is normal, as the integral indicators are less sensitive than their peers. Moreover, the power, intensity, and dynamic strength are less sensitive than the force, pressure, and strength indicators. The same applies for their integrals. Therefore, the integrals of power, intensity, and dynamic strength indicators are more inclined to be medium-term indicators.
As the paper is suggesting "the linear momentum and the new performance indicators should make a significant change in categorizing several indicators in technical analysis."
Technical indicators are using biased mathematical implementations. For example Momentum Index is in reality a velocity indicator, Force index a Momentum indicator and so on. From a Physical perspective correct momentum, force, velocity etc. needs to be corrected and re-categorized.
The author also gives important insights in how these indicators can be used "simultaneously to identify price turning points and filter irrelevant divergences."
"This paper will attempt to adjust the price momentum and force concepts introduced by Welles Wilder and Alexander Elder, respectively. By introducing the concept of linear momentum, new indicators will emerge to dissect the market performance into six main elements: market’s force, pressure, strength, power, intensity, and dynamic strength. This will lead to a deeper insight about market action. The leading performance indicators can be used simultaneously to identify price turning points and filter irrelevant divergences. The linear momentum and the new performance indicators should make a significant change in categorizing several indicators in technical analysis."
Suggestions and feedbacks are welcome
Hope you enjoy this,
CryptoStatistical

Linear Momentum and Performance Indicators (IFTA Jan 2019)This a porting to Trading View of the 12 new indicators introduced in IFTA Journal (January Edition) by Akram El Sherbini, MFTA, CFTe, CETA.
Indicators are available in "Linear Momentum and Performance Indicators" at page four.
IFTA Journal is available below:
ifta.org
Indicators implemented herein:
Linear Force Index: The linear force index LFI measures the force of buyers and sellers during rallies and declines, respectively. It combines two important pieces of market information—the price acceleration
and volumes.
Pressure Index: The pressure index PRI measures the buying and selling pressure over a certain range within a time interval by moving around its zero line. The index indicates a rise in buying pressure when it crosses above the zero line and a rise in selling pressure
when it crosses below the zero line level. The buying and selling force moves the last price during the session to form a range with low and high boundaries.
Strength Index Index : The strength index SI is a leading indicator to the pressure index. It measures the ability of buyers to resist sellers and vice versa. SI of today is the ratio of the latest pressure index value to the strain of today.
Power Index : It measures the buying and selling power within a time interval by moving around its zero line.
Intensity Index : The intensity index II measures the buying and selling intensity within a time interval by moving around its zero line.
Dynamic Strength Index : The sole purpose of the dynamic strength index DSI and the integral dynamic strength index IDSI is to lead their intensity indicator peers.
Integral Force Index
Integral Pressure Index
Integral Strength Index
Integral Power Index
Integral Intensity Index
Integral Dynamic Strength Index
The following example shows a trade following the signal while several indicators are crossing the zero line:
Integral performance indicators have a fewer number of trades than the performance indicators. This result is normal, as the integral indicators are less sensitive than their peers. Moreover, the power, intensity, and dynamic strength are less sensitive than the force, pressure, and strength indicators. The same applies for their integrals. Therefore, the integrals of power, intensity, and dynamic strength indicators are more inclined to be medium-term indicators.
As the paper is suggesting "the linear momentum and the new performance indicators should make a significant change in categorizing several indicators in technical analysis."
Technical indicators are using biased mathematical implementations. For example Momentum Index is in reality a velocity indicator, Force index a Momentum indicator and so on. From a Physical perspective correct momentum, force, velocity etc. needs to be corrected and re-categorized.
The author also gives important insights in how these indicators can be used "simultaneously to identify price turning points and filter irrelevant divergences."
"This paper will attempt to adjust the price momentum and force concepts introduced by Welles Wilder and Alexander Elder, respectively. By introducing the concept of linear momentum, new indicators will emerge to dissect the market performance into six main elements: market’s force, pressure, strength, power, intensity, and dynamic strength. This will lead to a deeper insight about market action. The leading performance indicators can be used simultaneously to identify price turning points and filter irrelevant divergences. The linear momentum and the new performance indicators should make a significant change in categorizing several indicators in technical analysis."
Suggestions and feedback are welcome
Hope you enjoy this,
CryptoStatistical
Candlestick normalizer + MA's Crossing SignalingWell, after 25 tries I finally did it ._.
Here is the candlestick normalizer I was trying to achieve. In this way you can do a fast and not biased by price candlestick analysis, for example to catch engulfish and doji's on the go ;)
I also added a MAs crossing-over signal I optimized.
Btw, I will try to add volume signaling on this indicator. I had been thinking in 2 options:
1) Maybe as a colour/unfilled bar when volume exceed average
2) Represent the volume on the width of the candlestick.
What do you prefer? Let me know.
I hope you enjoy it!
Phi it.
FIB Band Signals with RSI FilterOriginal Author: Rashad
Added by Rashad 6-26-16
These Bollinger bands feature Fibonacci retracements to very clearly show areas of support and resistance . The basis is calculate off of the Volume Weighted Moving Average . The Bands are 3 standard deviations away from the mean. 99.73% of observations should be in this range.
Updated by Dysrupt 7-12-18
-Buy signals added on lower bands, mean and upper 3 bands
-Sell signals added to upper 3 bands
-RSI filter applied to signals
-Alerts not yet added
-Long Biased
NOTE: This is NOT a set and forget signal indicator. It is extremely versatile for all environments by adjusting the RSI filter and checking the band signals needed for the current trend and trading style.
Linear ExtrapolationBasic extrapolator for forecast a time-series, all forecasts are mades length periods ahead.
This is not a estimation of the exact price
This should only be used for forecasting direction, dont expect the price to be at the same value of its forecast.
Bias, Mean absolute error, Mean percentage error...etc look useless here, its better to use correlation as a accuracy measurement.
Correlation(Forecast ,close,period)
Rescaling for a better forecast ?
Transforming a non-stationary signal to a stationary signal can increase the forecasting accuracy, this can be done by detrending. Here is a list of somes detrending methods:
Auto-Bias : price - price
Mean-Bias : price - price moving average
Log transform : log(price/price moving average)
Correlation : correlation(price,n,period)

Ichimoku_on_steroids v 1.0 OLBased on the original Ichimoku formula, this indicator provides decent long/short entries/exit signals. It takes into account an EMA on price as well as the two leading lines (without the future projection). Works on all timeframes, on all bar style's (incl. Renko & PnF). Configurable to your taste in the settings.
Black line = EMA on close // Green line = Leading Span A // Red line = Leading Span B
Green = Long bias // Red = Short bias // Yellow = Neutral bias or close position
The cautious trader might want to wait for confirmation (red or green) before entering a position ; the riskier trader might want to enter as soon as neutral territory is reached.
As usual : use it at your own risk ;)
Comments / suggestions welcome
PS: there are more scripts in the pipeline ... :)

Anurag Balanced 0DTE Scalper SPY QQQBalanced 0DTE Scalper
1. Purpose: A 0DTE options day trading indicator for SPY/QQQ on 5-minute charts with visual CALL/PUT entry and exit signals.
2. Trend Filter: Uses 15-minute EMA crossover (9/21) + ADX to confirm trend direction before taking trades.
3. Entry Logic: Triggers on pullback to 5m EMA9 with RSI/VWAP/MACD confirmation, bullish or bearish candle required.
4. Exit System: ATR-based trailing stop, dual targets (TP1 partial, TP2 full), time stop, and auto-exit at EOD.
5. Risk Controls: Max trades/day limit, cooldown period after exits, session filter (avoids first 10 min & last 15 min).
6. Visual Feedback: Dynamic stop/target lines, entry/exit labels with P&L, background color for trend bias and cooldown.
7. Dashboard: 16-row panel showing bias, ADX, regime, RSI, VWAP, position, bars held, cooldown status, strike suggestions, and DTE recommendation.

GC/MGC VWAP Pullback + ADX Regime (Prop-Safe)GC / MGC VWAP Pullback + ADX Regime Strategy (Prop-Safe)
This strategy is designed specifically for Gold futures (GC & MGC) and prop firm trading, where capital preservation, consistency, and avoiding chop matter more than trade frequency.
The core philosophy is simple:
Only trade gold when it is expanding, aligned, and at the right location.
Strategy Concept
Gold moves in bursts, not constantly.
Most losses come from trading compression, VWAP chop, or late momentum.
This strategy filters those environments out and trades only:
Strong intraday momentum
Clear higher-timeframe direction
First pullbacks to VWAP
Clean price rejection with follow-through
It intentionally produces fewer but higher-quality trades.
Market Regime Filter (ADX)
ADX is evaluated on the 5-minute chart
This is the trade permission filter
ADX zones:
Below 18 → No trade (compression / chop)
20–35 → Optimal trading zone
35–45 → Caution (strong trend, reduced opportunity)
Above 45 → No new entries (late expansion / news risk)
ADX does not determine direction.
It only determines whether trading is allowed.
Direction Filter (Higher Timeframe)
Direction comes from the 1-Hour chart
EMA 20 above EMA 50 → Long bias only
EMA 20 below EMA 50 → Short bias only
Optional slope confirmation for additional strictness
No counter-trend trades.
Entry Logic (5-Minute Chart)
Trades are taken using a VWAP pullback continuation model.
Long Setup
ADX between 20–35
1H EMA 20 > EMA 50
Price pulls back to VWAP
Bullish rejection candle at VWAP
Entry on break of the rejection candle high
Short Setup
ADX between 20–35
1H EMA 20 < EMA 50
Price pulls back to VWAP from below
Bearish rejection candle at VWAP
Entry on break of the rejection candle low
All entries use stop orders, not market orders, to ensure follow-through.
Risk Management
Stop loss is placed beyond the rejection candle
Partial profit at 1R
Final target at 2R
No pyramiding
One clean setup is preferred over multiple trades
This structure aligns well with prop firm rules, trailing drawdowns, and consistency requirements.
What This Strategy Avoids
VWAP chop
Range-bound sessions
Overtrading
Late entries after news spikes
Counter-trend setups
If conditions are not ideal, no trade is the correct trade.
Best Use Case
Instruments: GC, MGC
Timeframe: 5-minute
Style: Intraday, prop-firm friendly
Ideal for traders who value:
Discipline
Structure
Capital protection

Futures Ultra CVD (Pure )Futures Ultra CVD (Pure)
Futures Ultra CVD (Pure) is a volume-driven Cumulative Volume Delta (CVD) indicator designed to expose real buying and selling pressure behind price movement. Unlike price-only indicators, this script analyzes how volume is distributed within each bar to determine whether aggressive buyers or sellers are in control, then tracks how that pressure evolves over time.
This version is intentionally pure and ungated: it does not rely on external symbols, market filters, session bias, or macro confirmation. All signals are derived strictly from price, volume, and delta behavior of the active chart, making it suitable for futures, equities, crypto, and FX.
Core Concept: How CVD Is Calculated
For each bar, volume is split into buying pressure and selling pressure using the bar’s price position:
Buying volume increases as price closes closer to the high
Selling volume increases as price closes closer to the low
The difference between buying and selling volume forms Delta:
Positive delta = net aggressive buying
Negative delta = net aggressive selling
This delta is then accumulated into Cumulative Volume Delta (CVD) using one of three user-selectable modes:
Total – running cumulative sum of all delta values
Periodic – rolling sum over a fixed lookback period
EMA – smoothed cumulative delta using an exponential average
This flexibility allows traders to choose between raw order-flow tracking or smoother, trend-like behavior depending on timeframe and instrument.
Visual Structure & Histogram Logic
The CVD is displayed as a column histogram, not a line, to emphasize momentum and pressure shifts.
Enhanced coloring provides additional context:
Brighter green/red bars indicate increasing momentum
Muted colors indicate stalling or weakening pressure
Optional footprint-style highlights appear when buy or sell volume overwhelms the opposite side by a user-defined imbalance factor
This allows traders to visually distinguish:
Strength vs weakness
Continuation vs exhaustion
Absorption and aggressive participation
Built-In Order Flow Signals
The script automatically detects and labels key order-flow events:
Strong Delta
Triggered when delta exceeds a user-defined threshold, highlighting unusually aggressive buying or selling.
Delta Surge
Detects sudden expansion in delta compared to the prior bar, often associated with breakout attempts or liquidation events.
Zero-Line Crosses
Marks transitions between net bullish and bearish participation as CVD crosses above or below zero.
CVD Continuation Logic (Trend Confirmation)
Beyond raw delta, the script evaluates CVD structure to identify continuation conditions:
A bullish continuation requires:
Positive and rising CVD
Strong buy delta
Confirmation from at least one of the following:
CVD above its EMA and SMA
Bullish price expansion
Sustained positive delta pressure
Bearish continuation follows the inverse logic.
These continuation signals are designed to confirm participation strength, not predict reversals.
Conflict Detection (Divergence Warning)
The indicator also flags conflict conditions, where:
Strong buying occurs while CVD remains negative
Strong selling occurs while CVD remains positive
These scenarios often precede failed breakouts, absorption zones, or short-term reversals and can be used as cautionary signals.
Alerts & Practical Use
All major events include built-in alerts:
Strong delta
Delta surge
CVD continuations
Zero-line crosses
Buy/sell imbalances
Conflict signals
Alerts can be set to trigger on bar close or intrabar in real time, depending on trader preference.
How Traders Typically Use This Indicator
Confirm breakouts with delta participation
Validate trends using CVD continuation instead of price alone
Identify absorption or exhaustion via conflicts and imbalances
Combine with price structure, VWAP, or market profile tools
This script is not a trading system by itself. It is a decision-support tool designed to reveal what price alone cannot: who is actually in control of the market.
On-Chart Symbols & What They Mean
This script uses a small number of visual symbols to communicate order-flow events clearly and consistently. All symbols are derived directly from the Cumulative Volume Delta calculations described above.
Δ+ (Green Up Arrow)
Strong Buy Delta
Indicates that buying pressure on the current bar exceeded the Strong Delta Threshold
Represents aggressive market buying dominating selling volume
Often appears during breakouts, trend acceleration, or initiative buying
This symbol does not imply direction by itself; it only confirms strong buyer participation.
Δ− (Red Down Arrow)
Strong Sell Delta
Indicates that selling pressure on the current bar exceeded the Strong Delta Threshold
Represents aggressive market selling dominating buying volume
Often appears during breakdowns, liquidation events, or initiative selling
Like Δ+, this symbol measures participation strength, not trade direction.
↑ (Green Label Up)
CVD Bullish Continuation
Appears when all of the following are present:
CVD is positive and increasing
Strong buy delta is detected
At least one confirmation condition is met:
CVD is above its EMA and SMA
Price shows bullish expansion
Consecutive positive delta bars (sustained buying pressure)
This symbol highlights trend continuation supported by volume, not a reversal signal.
↓ (Red Label Down)
CVD Bearish Continuation
Appears when:
CVD is negative and decreasing
Strong sell delta is detected
At least one confirmation condition is met:
CVD is below its EMA and SMA
Price shows bearish expansion
Consecutive negative delta bars (sustained selling pressure)
This indicates bearish continuation with participation confirmation.
Cyan / Orange Histogram Bars
Footprint-Style Volume Imbalance
Cyan bars indicate buy volume exceeds sell volume by the imbalance factor
Orange bars indicate sell volume exceeds buy volume by the imbalance factor
These bars highlight areas where one side is overwhelming the other, often associated with absorption, initiative moves, or failed auctions.
Bright vs Muted Histogram Colors
CVD Momentum State
Bright colors = CVD increasing in the direction of its current bias
Muted colors = CVD losing momentum or stalling
This allows quick visual identification of strengthening vs weakening participation.
Conflict Alerts (No Symbol by Default)
Delta vs CVD Disagreement
These conditions trigger alerts (but no fixed chart icon):
Strong buying while CVD remains negative
Strong selling while CVD remains positive
Conflicts often signal absorption, trap conditions, or short-term exhaustion.
Important Usage Notes
All symbols are informational, not trade entries.
Signals are calculated from price-based volume distribution, not true bid/ask data.
Results depend on the quality of volume data provided by the exchange and TradingView.

4MA / 4MA[1] Forward Projection with 4 SD Forecast Bands4MA / 4MA Projection + 4 SD Bands + Cross Table is a forward-projection tool built around a simple moving average pair: the 4-period SMA (MA4) and its 1-bar lagged value (MA4 ). It takes a prior MA behavior pattern, projects that structure forward, and wraps the projected mean path with four Standard Deviation (SD) bands to visualize probable future price ranges.
This indicator is designed to help you anticipate:
Where the MA structure is likely to travel next
How wide the “expected” future price corridor may be
Where a future MA4 vs MA4 crossover is most likely to occur
When the real (live) crossover actually prints on the chart
What you see on the chart
1) Live moving averages (current market)
MA4 tracks the short-term mean of price.
MA4 is simply the previous bar’s MA4 value (a 1-bar lag).
Their relationship (MA4 above/below MA4 ) gives a clean, minimal read on trend alignment and directional bias.
2) Projected MA path (forward curve)
A forward “ghost” of the MA structure is drawn ahead of price. This projected curve represents the indicator’s best estimate of how the moving average structure may evolve if the market continues to rhyme with the selected historical behavior window.
3) 4 Standard Deviation bands (predictive future price ranges)
Surrounding the projected mean path are four SD envelopes. Think of these as forecast corridors:
Inner bands = tighter “expected” range
Outer bands = wider “stress / extreme” range
These bands are not a guarantee—rather, they’re a structured way to visualize “how far price can reasonably swing” around the projected mean based on observed volatility.
4) Vertical projection lines (most probable cross zone)
Within the projected region you’ll see vertical lines running through the bands. These lines mark the most probable zone where MA4 and MA4 are expected to cross in the projection.
In plain terms:
The projected MAs are two curves.
When those curves are forecasted to intersect, the script marks the intersection region with a vertical line.
This gives you a forward “timing window” for a potential MA shift.
5) Cross Table (top-right)
The table is your confirmation layer. It reports:
Current MA4 value
Current MA4 value
Whether MA4 is above or below MA4
The most recent BUY / SELL cross event
When a real, live crossover happens on the actual chart:
It registers as BUY (MA4 crosses above MA4 )
Or SELL (MA4 crosses below MA4 )
…and the table updates immediately so you can confirm the event without guessing.
How to use it
Practical workflow
Use the projected SD bands as future range context
If price is projected to sit comfortably inside inner bands, the market is behaving “normally.”
If price reaches outer bands, you’re in a higher-volatility / stretched scenario.
Use vertical lines as a “watch zone”
Vertical lines do not force a trade.
They act like a forward “heads-up”: this is the most likely window for an MA crossover to occur if the projection holds.
Use the table for confirmation
When the crossover happens for real, the table is your confirmation signal.
Combine it with structure (support/resistance, trendlines, market context) rather than trading it in isolation.
Notes and best practices
This is a projection tool: it helps visualize a structured forward hypothesis, not a certainty.
SD bands are best used as forecast corridors (risk framing, range planning, and expectation management).
The table is the execution/confirmation layer: it tells you what the MAs are doing now.

Hurst-Optimized Adaptive Channel [Kodexius]Hurst-Optimized Adaptive Channel (HOAC) is a regime-aware channel indicator that continuously adapts its centerline and volatility bands based on the market’s current behavior. Instead of using a single fixed channel model, HOAC evaluates whether price action is behaving more like a trend-following environment or a mean-reverting environment, then automatically selects the most suitable channel structure.
At the core of the engine is a robust Hurst Exponent estimation using R/S (Rescaled Range) analysis. The Hurst value is smoothed and compared against user-defined thresholds to classify the market regime. In trending regimes, the script emphasizes stability by favoring a slower, smoother channel when it proves more accurate over time. In mean-reversion regimes, it deliberately prioritizes a faster model to react sooner to reversion opportunities, similar in spirit to how traders use Bollinger-style behavior.
The result is a clean, professional adaptive channel with inner and outer bands, dynamic gradient fills, and an optional mean-reversion signal layer. A minimalist dashboard summarizes the detected regime, the current Hurst reading, and which internal model is currently preferred.
🔹 Features
🔸 Robust Regime Detection via Hurst Exponent (R/S Analysis)
HOAC uses a robust Hurst Exponent estimate derived from log returns and Rescaled Range analysis. The Hurst value acts as a behavioral filter:
- H > Trend Start threshold suggests trend persistence and directional continuation.
- H < Mean Reversion threshold suggests anti-persistence and a higher likelihood of reverting toward a central value.
Values between thresholds are treated as Neutral, allowing the channel to remain adaptive without forcing a hard bias.
This regime framework is designed to make the channel selection context-aware rather than purely reactive to recent volatility.
🔸 Dual Channel Engine (Fast vs Slow Models)
Instead of relying on one fixed channel, HOAC computes two independent channel candidates:
Fast model: shorter WMA basis and standard deviation window, intended to respond quickly and fit more reactive environments.
Slow model: longer WMA basis and standard deviation window, intended to reduce noise and better represent sustained directional flow.
Each model produces:
- A midline (basis)
- Outer bands (wider deviation)
- Inner bands (tighter deviation)
This structure gives you a clear core zone and an outer envelope that better represents volatility expansion.
🔸 Rolling Optimization Memory (Model Selection by Error)
HOAC includes an internal optimization layer that continuously measures how well each model fits current price action. On every bar, each model’s absolute deviation from the basis is recorded into a rolling memory window. The script then compares total accumulated error between fast and slow models and prefers the one with lower recent error.
This approach does not attempt curve fitting on multiple parameters. It focuses on a simple, interpretable metric: “Which model has tracked price more accurately over the last X bars?”
Additionally:
If the regime is Mean Reversion, the script explicitly prioritizes the fast model, ensuring responsiveness when reversals matter most.
🔸 Optional Output Smoothing (User-Selectable)
The final selected channel can be smoothed using your choice of:
- SMA
- EMA
- HMA
- RMA
This affects the plotted midline and all band outputs, allowing you to tune visual stability and responsiveness without changing the underlying decision engine.
🔸 Premium Visualization Layer (Inner Core + Outer Fade)
HOAC uses a layered band design:
- Inner bands define the core equilibrium zone around the midline.
- Outer bands define an extended volatility envelope for extremes.
Gradient fills and line styling help separate the core from the extremes while staying visually clean. The midline includes a subtle glow effect for clarity.
🔸 Adaptive Bar Tinting Strength (Regime Intensity)
Bar coloring dynamically adjusts transparency based on how far the Hurst value is from 0.5. When market behavior is more decisively trending or mean-reverting, the tint becomes more pronounced. When behavior is closer to random, the tint becomes more subtle.
🔸 Mean-Reversion Signal Layer
Mean-reversion signals are enabled when the environment is not classified as Trending:
- Buy when price crosses back above the lower outer band
- Sell when price crosses back below the upper outer band
This is intentionally a “return to channel” logic rather than a breakout logic, aligning signals with mean-reversion behavior and avoiding signals in strongly trending regimes by default.
🔸 Minimalist Dashboard (HUD)
A compact table displays:
- Current regime classification
- Smoothed Hurst value
- Which model is currently preferred (Fast or Slow)
- Trend flow direction (based on midline slope)
🔹 Calculations
1) Robust Hurst Exponent (R/S Analysis)
The script estimates Hurst using a Rescaled Range approach on log returns. It builds a returns array, computes mean, cumulative deviation range (R), standard deviation (S), then converts RS into a Hurst exponent.
calc_robust_hurst(int length) =>
float r = math.log(close / close )
float returns = array.new_float(length)
for i = 0 to length - 1
array.set(returns, i, r )
float mean = array.avg(returns)
float cumDev = 0.0
float maxCD = -1.0e10
float minCD = 1.0e10
float sumSqDiff = 0.0
for i = 0 to length - 1
float val = array.get(returns, i)
sumSqDiff += math.pow(val - mean, 2)
cumDev += (val - mean)
if cumDev > maxCD
maxCD := cumDev
if cumDev < minCD
minCD := cumDev
float R = maxCD - minCD
float S = math.sqrt(sumSqDiff / length)
float RS = (S == 0) ? 0.0 : (R / S)
float hurst = (RS > 0) ? (math.log10(RS) / math.log10(length)) : 0.5
hurst
This design avoids simplistic proxies and attempts to reflect persistence (trend tendency) vs anti-persistence (mean reversion tendency) from the underlying return structure.
2) Hurst Smoothing
Raw Hurst values can be noisy, so the script applies EMA smoothing before regime decisions.
float rawHurst = calc_robust_hurst(i_hurstLen)
float hVal = ta.ema(rawHurst, i_smoothHurst)
This stabilized hVal is the value used across regime classification, dynamic visuals, and the HUD display.
3) Regime Classification
The smoothed Hurst reading is compared to user thresholds to label the environment.
string regime = "NEUTRAL"
if hVal > i_trendZone
regime := "TRENDING"
else if hVal < i_chopZone
regime := "MEAN REV"
Higher Hurst implies more persistence, so the indicator treats it as a trend environment.
Lower Hurst implies more mean-reverting behavior, so the indicator enables MR logic and emphasizes faster adaptation.
4) Dual Channel Models (Fast and Slow)
HOAC computes two candidate channel structures in parallel. Each model is a WMA basis with volatility envelopes derived from standard deviation. Inner and outer bands are created using different multipliers.
Fast model (more reactive):
float fastBasis = ta.wma(close, 20)
float fastDev = ta.stdev(close, 20)
ChannelObj fastM = ChannelObj.new(fastBasis, fastBasis + fastDev * 2.0, fastBasis - fastDev * 2.0, fastBasis + fastDev * 1.0, fastBasis - fastDev * 1.0, math.abs(close - fastBasis))
Slow model (more stable):
float slowBasis = ta.wma(close, 50)
float slowDev = ta.stdev(close, 50)
ChannelObj slowM = ChannelObj.new(slowBasis, slowBasis + slowDev * 2.5, slowBasis - slowDev * 2.5, slowBasis + slowDev * 1.25, slowBasis - slowDev * 1.25, math.abs(close - slowBasis))
Both models store their structure in a ChannelObj type, including the instantaneous tracking error (abs(close - basis)).
5) Rolling Error Memory and Model Preference
To decide which model fits current conditions better, the script stores recent errors into rolling arrays and compares cumulative error totals.
var float errFast = array.new_float()
var float errSlow = array.new_float()
update_error(float errArr, float error, int maxLen) =>
errArr.unshift(error)
if errArr.size() > maxLen
errArr.pop()
Each bar updates both error histories and computes which model has lower recent accumulated error.
update_error(errFast, fastM.error, i_optLookback)
update_error(errSlow, slowM.error, i_optLookback)
bool preferFast = errFast.sum() < errSlow.sum()
This is an interpretable optimization approach: it does not attempt to brute-force parameters, it simply prefers the model that has tracked price more closely over the last i_optLookback bars.
6) Winner Selection Logic (Regime-Aware Hybrid)
The final model selection uses both regime and rolling error performance.
ChannelObj winner = regime == "MEAN REV" ? fastM : (preferFast ? fastM : slowM)
rawMid := winner.mid
rawUp := winner.upper
rawDn := winner.lower
rawUpInner := winner.upper_inner
rawDnInner := winner.lower_inner
In Mean Reversion, the script forces the fast model to ensure responsiveness.
Otherwise, it selects the lowest-error model between fast and slow.
7) Optional Output Smoothing
After the winner is selected, the script optionally smooths the final channel outputs using the chosen moving average type.
smooth(float src, string type, int len) =>
switch type
"SMA" => ta.sma(src, len)
"EMA" => ta.ema(src, len)
"HMA" => ta.hma(src, len)
"RMA" => ta.rma(src, len)
=> src
float finalMid = i_enableSmooth ? smooth(rawMid, i_smoothType, i_smoothLen) : rawMid
float finalUp = i_enableSmooth ? smooth(rawUp, i_smoothType, i_smoothLen) : rawUp
float finalDn = i_enableSmooth ? smooth(rawDn, i_smoothType, i_smoothLen) : rawDn
float finalUpInner = i_enableSmooth ? smooth(rawUpInner, i_smoothType, i_smoothLen) : rawUpInner
float finalDnInner = i_enableSmooth ? smooth(rawDnInner, i_smoothType, i_smoothLen) : rawDnInner
This preserves decision integrity since smoothing happens after model selection, not before.
8) Dynamic Visual Intensity From Hurst
Transparency is derived from the distance of hVal to 0.5, so stronger behavioral regimes appear with clearer tints.
int dynTrans = int(math.max(20, math.min(80, 100 - (math.abs(hVal - 0.5) * 200))))

VWAP + RVOL (Merged):
📊 VWAP + RVOL (Merged)
VWAP + RVOL (Merged) is a professional intraday trading indicator that combines:
Session VWAP to define institutional direction and fair value
True Intraday Relative Volume (RVOL) to measure real-time volume strength compared to the same minute over previous days
The script is specifically designed for U.S. equities and performs best in:
Premarket momentum
Opening Range Breakout (ORB)
VWAP pullbacks
Scalping & day trading
🔍 What does this indicator provide?
1️⃣ True Intraday RVOL
Calculates minute-accurate relative volume, comparing current volume to the same minute across a user-defined number of prior days
Correctly handles sessions crossing midnight (after-hours & premarket)
Displays RVOL in a separate pane for clean, noise-free analysis
Default RVOL reference levels:
0.5 → Weak volume
1.0 → Normal volume
1.5 → Strong volume
2.0 → Unusual / institutional activity
2️⃣ Session VWAP
True session-based VWAP
Identifies institutional fair value
Acts as a primary directional filter:
Above VWAP → Bullish bias
Below VWAP → Bearish bias
✅ Practical Trading Use
Long Setup:
Price above VWAP
RVOL ≥ 1.5
Light pullback or VWAP retest
Confirmation candle with increasing volume
Avoid trades when:
Price below VWAP
RVOL < 1.0
⚙️ Settings
RVOL Lookback Days – Number of days used for RVOL comparison (default: 5)
RVOL Reference Lines – Toggle RVOL levels on/off
VWAP Source – Price source for VWAP calculation
Hide VWAP on 1D+ – Optional VWAP hiding on higher timeframes
📌 Important Notes
Designed for intraday timeframes only (≥ 1 minute and < 1 day)
Requires volume data from the data provider
Not intended for daily or higher timeframes
🎯 Who is this indicator for?
Momentum traders
Day traders & scalpers
ORB and VWAP pullback strategies
Traders seeking volume confirmation before entry
⚠️ Disclaimer
This indicator is a decision-support tool, not a trading recommendation.
Always apply proper risk management.

